딥러닝을 활용한 상실치아 수 예측의 가능성: 파일럿 스터디
김선집
1, 임도형
2, 허정욱
3, 조현재
11서울대학교 치의학대학원 예방치학교실, 2연세대학교 인지과학 협동과정, 3하단 굿윌치과 병원
Possibility of predicting missing teeth using deep learning:
a pilot study
Seon-Jip Kim1, Dohyoung Rim2, Jeong Uk Heo3, Hyun-Jae Cho1
1Department of Preventive Dentistry and Public Oral Health, School of Dentistry, Seoul National University,
2Department of Cognitive Science, Yonsei University, Seoul, 3Goodwill Dental Hospital at Hadan, Busan, Korea
Copyright © 2019 by Journal of Korean Academy of Oral Health
This is an open-access article distributed under the terms of the Creative Commons Attribution Non-Commercial License (http://creativecommons.org/licenses/by-nc/4.0/), which permits unrestricted non-commercial use, distribution, and reproduction in any medium, provided the original work is properly cited.
Objectives: The primary objective of this study was to determine if the number of missing teeth could be predicted by oral disease pathogens, and the secondary objective was to assess whether deep learning is a better way of predicting the number of missing teeth than multivariable linear regression (MLR).
Methods: Data were collected through review of patient’s initial medical records. A total of 960 par- ticipants were cross-sectionally surveyed. MLR analysis was performed to assess the relationship between the number of missing teeth and the results of real-time PCR assay (done for quantifica- tion of 11 oral disease pathogens). A convolutional neural network (CNN) was used as the deep learning model and compared with MLR models. Each model was performed five times to generate an average accuracy rate and mean square error (MSE). The accuracy of predicting the number of missing teeth was evaluated and compared between the CNN and MLR methods.
Results: Model 1 had the demographic information necessary for the prediction of periodontal dis- eases in addition to the red and the orange complex bacteria that are highly predominant in oral diseases. The accuracy of the convolutional neural network in this model was 65.0%. However, applying Model 4, which added yellow complex bacteria to the total bacterial load, increased the expected extractions of dental caries to 70.2%.
On the other hand, the accuracy of the MLR was about 50.0% in all models. The mean square error of the CNN was considerably smaller than that of the MLR, resulting in better predictability.
Conclusions: Oral disease pathogens can be used as a predictor of missing teeth and deep learn- ing can be a more accurate analysis method to predict the number of missing teeth as compared to MLR.
Key Words: Deep learning, Linear regression, Missing teeth, Real-time PCR, Periodontitis Received: November 23, 2019
Revised: December 3, 2019 Accepted: December 4, 2019
Corresponding Author: Hyun-Jae Cho Department of Preventive Dentistry and Public Oral Health, School of Dentistry, Seoul National University, 101 Daehakro, Jongno-gu, Seoul 03080, Korea Tel: +82-2-740-8677 Fax: +82-2-765-1722 E-mail: stbluewi@snu.ac.kr
https://orcid.org/0000-0002-3079-8629
*This research was supported by a program of data-science buildup from the Big Data Institute, Seoul National University and the ICT & Future Planning Program of the National Research Foundation (grant number: 2017R1C1B5017915).
JKAOH is available at http://www.jkaoh.org pISSN 1225-388X / eISSN 2093-7784
Introduction
Periodontal disease is a major oral disease, which threatens the oral health of humans1). This disease can result in missing teeth, including the destruction of the connective tissue and supporting bone2,3). Dental biofilm is an important etiologic
factor of periodontitis4). Dental biofilm contains various types of microorganisms, which Socransky et al. classified by potential pathogenicity5,6). Generally, the proportion of anaerobic Gram- negative bacteria is important regarding the development of periodontitis7,8).
Generally, missing teeth can be a useful marker of past and
current periodontal disease9). There is no prior study regard- ing the relationship between the number of missing teeth and periodontal pathogen as a covariate. Although some research- ers used the number of missing teeth as a covariate or outcome variable, these studies did not consider periodontal patho- gens10-12).
The convolutional neural network (CNN) is a form of deep learning, and can be used as an image classification tool through learning of characteristic features13). Recently, the CNN model was also used in a cross-sectional study, which should use logistic regression or multivariable linear regression (MLR)14,15).
A recent article in the 2017 world workshop on the classifi- cation of periodontal and peri-Implant diseases and conditions, which redefines the stages of periodontal disease, suggests that tooth loss is a major component of periodontal disease16). Us- ing this information, the tooth loss was considered as a power- ful risk factor, a research has been published to predict future tooth loss by stages of periodontal disease17). Long-term follow- up over 10 years of this study resulted in a significant increase in the risk of tooth loss at higher stages of periodontal disease.
In addition, many studies have investigated tooth loss as a risk factor for cardiovascular disease, metabolic syndrome, and cog- nitive impairment18-20). In many respects, tooth loss affects not only oral health, but also systemic disease, and is a risk factor to watch out for.
The first aim of this study is to determine if the number of tooth loss can be predicted by periodontal disease pathogen.
The second aim is to assess whether deep learning is a better way of predicting the number of teeth lost than MLR.
Materials and Methods
1. Subjects
This study was approved by the institutional review board of the School of Dentistry, Seoul National University, Seoul, Korea (IRB number S-D20170023), and was carried out at the Hadan Goodwill Dental Hospital, Busan.
We collected the data by searching the patient’s initial med- ical record. A total of 1,017 subjects were selected, who visited as new patients from August 1 to December 30, 2017. All pa- tients were asked of demographic information and systemic dis- eases such as age, sex, smoking, number of cigarettes per a day, hypertension, diabetes mellitus, heart disease, and lung disease.
A treatment plan was established for all patients when patients visited, and the number of planned tooth extractions was re- corded without considering wisdom teeth. The number of miss-
ing teeth was counted using oral examination of medical chart without wisdom teeth. Microbiologic analyses were performed to measure the risk of periodontitis using real-time PCR. Finally, a total of 960 participants (456 men and 504 women) were in- cluded, excluding patients who refused microbiologic analyses.
2. Measurements
Participants’ saliva specimens were collected after 30 sec- onds rinsing with mouthwash 10 ml (Garglin Dental Solution Regular, Dong-A Pharm Inc., Seoul, Korea) and processed for real-time PCR. Bacterial chromosomal DNA in saliva was extracted using a DNA extraction Kit (Exgene Clinic SV mini, GeneAll Inc., Seoul, Korea). The samples were analyzed using easyperio (BIOYD, Seongnam, Korea).
Socransky et al. classified the plaque bacteria into five groups according to the degree of influencing periodontal dis- ease and the various periods of plaque formation21), among them, 11 oral disease pathogens were selected from red and orange complexes, which are highly pathogenic, causing peri- odontal disease. 11 oral disease pathogens are as follows: Ag- gregatibacter actinomycetemcomitans (Aa), Porphyromonas gingivalis (Pg), Tannerella forsythus (Tf), Treponema denticola (Td), Fusobacterium nucleatum (Fn), Prevotella intermedia (Pi), Prevotella nigrescens (Pn), Streptococcus mitis (Sm), Strepto- coccus mutans (Smu), Streptococcus sobrinus (Ss), Lactobacil- lus casei (Lc), and total bacterial load. Each bacteria DNA was amplified by a specific primer using functional genes (rgpB, waaA, gtf). Total bacteria 16s rDNA control was used to detect DNA from total bacteria load species. The samples in the DNA polymerase (AmpONE Hot-start Taq DNA polymerase 250u, GeneAll Inc., Seoul, Korea) assay were analyzed in a 20 ml reac- tion mixture containing genomic DNA 2 ml, specific primer, probe set, and PCR reaction buffer. The thermal program cho- sen was 45 cycles of 95℃ for 15 seconds, 55℃ for 15 seconds, and 72℃ for 20 seconds, with an initial denaturation at 95℃ for 15 minutes. All data were analyzed using sequenced-detection system software (ABI 7500 Fast Real-Time PCR System, Applied Biosystems, Life Technologies Inc., Carlsbad, CA, USA). Standard curves were used to convert cycle threshold (Ct) scores into the number of bacterial cells using samples with known amounts of bacterial-specific DNA. DNA was 10-fold serially diluted from 100 to 105 copies and subjected to real-time PCR to create a standard curve by plotting threshold cycles against the copy number of the plasmid DNA as previously described.
3. Statistical analysis
Data was divided into training set and test set categories.
The training set is the data for training a model and the test set is data to verify the performance of the model. A randomiza- tion sequence was generated using the RAND function in Excel (Microsoft Corporation, Redmond, WA, USA), and used to divide the full dataset (N=960) into a training set (N=658) and a test set (N=302). Data analysis was performed by SPSS software version 23.0 (IBM Co., Armonk, NY, USA). Significance was determined at a=0.05 for all tests. Each variable between the test set and training set was analyzed by a Chi-square test for non-continu- ous variables and an independent samples t-test. After adjusting for demographic factors, systemic diseases, and the number of bacteria by species, MLR was used for estimating the number of missing teeth in the training set. Four multi-variable regression
models were designed to analyze influences of each group of covariates as follows: model 1 has covariates that are essential for periodontitis prediction, such as age, sex, smoking, diabe- tes, hypertension, and red and orange complex; model 2 adds yellow complexes to caries-related bacteria and total bacterial load; model 3 adds smoking parameters that ignore multiple collinearity that should not be used in linear regression analysis, and adds less reliable heart and lung disease questionnaires;
model 4 adds up to the tooth that was planned for extraction.
Using constants and intercept calculated by MLR, the accuracy rate was calculated within a margin of error (―1<x<1) in the training set.
A CNN was used in the deep learning model. This study
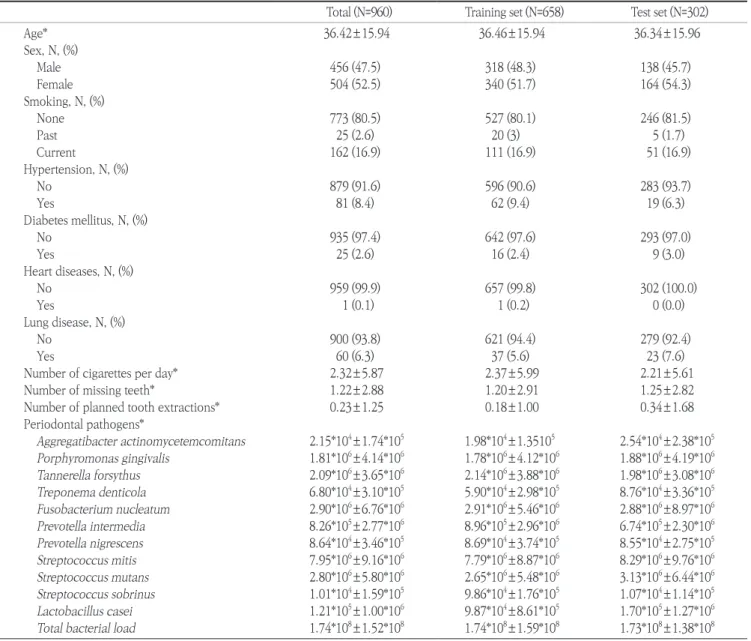
Table 1. Demographic information of the study population
Total (N=960) Training set (N=658) Test set (N=302)
Age* 36.42±15.94 36.46±15.94 36.34±15.96
Sex, N, (%)
Male 456 (47.5) 318 (48.3) 138 (45.7)
Female 504 (52.5) 340 (51.7) 164 (54.3)
Smoking, N, (%)
None 773 (80.5) 527 (80.1) 246 (81.5)
Past 25 (2.6) 20 (3) 5 (1.7)
Current 162 (16.9) 111 (16.9) 51 (16.9)
Hypertension, N, (%)
No 879 (91.6) 596 (90.6) 283 (93.7)
Yes 81 (8.4) 62 (9.4) 19 (6.3)
Diabetes mellitus, N, (%)
No 935 (97.4) 642 (97.6) 293 (97.0)
Yes 25 (2.6) 16 (2.4) 9 (3.0)
Heart diseases, N, (%)
No 959 (99.9) 657 (99.8) 302 (100.0)
Yes 1 (0.1) 1 (0.2) 0 (0.0)
Lung disease, N, (%)
No 900 (93.8) 621 (94.4) 279 (92.4)
Yes 60 (6.3) 37 (5.6) 23 (7.6)
Number of cigarettes per day* 2.32±5.87 2.37±5.99 2.21±5.61
Number of missing teeth* 1.22±2.88 1.20±2.91 1.25±2.82
Number of planned tooth extractions* 0.23±1.25 0.18±1.00 0.34±1.68
Periodontal pathogens*
Aggregatibacter actinomycetemcomitans 2.15*104±1.74*105 1.98*104±1.35105 2.54*104±2.38*105 Porphyromonas gingivalis 1.81*106±4.14*106 1.78*106±4.12*106 1.88*106±4.19*106 Tannerella forsythus 2.09*106±3.65*106 2.14*106±3.88*106 1.98*106±3.08*106 Treponema denticola 6.80*104±3.10*105 5.90*104±2.98*105 8.76*104±3.36*105 Fusobacterium nucleatum 2.90*106±6.76*106 2.91*106±5.46*106 2.88*106±8.97*106 Prevotella intermedia 8.26*105±2.77*106 8.96*105±2.96*106 6.74*105±2.30*106 Prevotella nigrescens 8.64*104±3.46*105 8.69*104±3.74*105 8.55*104±2.75*105 Streptococcus mitis 7.95*106±9.16*106 7.79*106±8.87*106 8.29*106±9.76*106 Streptococcus mutans 2.80*106±5.80*106 2.65*106±5.48*106 3.13*106±6.44*106 Streptococcus sobrinus 1.01*104±1.59*105 9.86*104±1.76*105 1.07*104±1.14*105 Lactobacillus casei 1.21*105±1.00*106 9.87*104±8.61*105 1.70*105±1.27*106 Total bacterial load 1.74*108±1.52*108 1.74*108±1.59*108 1.73*108±1.38*108
*SD, Standard deviation.
Table 2. Multiple linear regression results by model Model 1 (R2 =0.206, P<0.001)Model 2 (R2 =0.214, P<0.001)Model 3 (R2 =0.215, P<0.001)Model 4 (R2 =0.227, P<0.001) Log bSEPLog bSEPLog bSEPLog bSEP Constant―1.4330.4540.0020.004―1.3610.4800.005―1.3270.4770.006 Age0.0650.008<0.0010.0650.008<0.0010.0650.008<0.0010.0630.008<0.001 Sex0.0680.2210.7580.0600.2210.7860.0620.2230.7810.0680.2210.758 Number of planned tooth extraction0.3410.1060.001 Smoking0.1440.1470.3280.1570.1480.2900.1100.2700.6830.1050.2680.695 Number of cigarettes per day0.0070.0340.8380.0090.0340.795 Hypertension1.378 0.378<0.0011.3670.382<0.0011.3650.384<0.0011.2870.3820.001 Diabetes mellitus―0.970 0.6960.164―0.9780.6980.162―0.9670.7000.168―0.9760.6950.161 Heart disease2.0822.6280.4282.1802.6090.404 Lung disease―0.1480.4580.746―0.1320.4540.771 Aggregatibacter actinomy- cetemcomitans―1.1E-077.8E-070.886―8.6E-087.8E-070.912―9.3E-087.8E-070.905―1.2E-077.8E-070.878 Porphyromonas gingivalis8.1E-083.1E-080.0107.9E-083.2E-080.0137.9E-083.2E-080.0135.6E-083.2E-080.080 Tannerella forsythus―3.2E-083.5E-080.360―2.6E-083.5E-080.465―2.6E-083.5E-080.468―1.4E-083.5E-080.682 Treponema denticola―1.6E-083.7E-070.9662.0E-073.9E-070.6042.1E-074.0E-070.5922.2E-073.9E-070.585 Fusobacterium nucleatum―1.6E-082.0E-080.421―9.4E-092.0E-080.645―1.1E-082.0E-080.606―9.9E-092.0E-080.625 Prevotella intermedia―4.3E-083.7E-080.246―4.4E-083.7E-080.232―4.3E-083.7E-080.251―4.6E-083.7E-080.215 Prevotella nigrescens1.3E-072.8E-070.6419.0E-082.9E-070.7559.1E-082.9E-070.7552.7E-082.9E-070.926 Streptococcus mitis1.9E-081.5E-080.2041.9E-081.5E-080.2072.0E-081.5E-080.171 Streptococcus mutans―5.3E-092.3E-080.821―6.4E-092.4E-080.786―6.8E-092.3E-080.770 Streptococcus sobrinus9.4E-075.9E-070.1109.4E-075.9E-070.1111.0E-065.9E-070.086 Lactobacillus casei―1.4E-071.2E-070.240―1.4E-071.2E-070.238―1.3E-071.2E-070.268 Total bacterial load―1.2E-098.7E-100.165―1.2E-098.7E-100.176―1.3E-098.7E-100.148 Model 1 was adjusted for age, sex, smoking, hypertension, diabetes mellitus, A. actinomycetemcomitans, P. gingivalis, T. forsythus, F. nucleatum, P. intermedia, and P. nigrescens. Model 2 was ad- justed for age, sex, smoking, hypertension, diabetes mellitus, A. actinomycetemcomitans, P. gingivalis, T. forsythus, F. nucleatum, P. intermedia, and P. nigrescens, S. mitis, S. mutans, S. sobrinus, L. casei, and total bacterial load. Model 3 was adjusted for age, sex, smoking, number of cigarettes per a day, hypertension, diabetes mellitus, heart diseases, lung diseases, A. actinomycetemcomitans, P. gingivalis, T. forsythus, F. nucleatum, P. intermedia, and P. nigrescens, S. mitis, S. mutans, S. sobrinus, L. casei, and total bacterial load. Model 4 was adjusted for age, sex, number of planned tooth extractions, smoking, number of cigarettes per a day, hypertension, diabetes mellitus, heart diseases, lung diseases, A. actinomycetemcomitans, P. gingivalis, T. forsythus, F. nucleatum, P. inter- media, and P. nigrescens, S. mitis, S. mutans, S. sobrinus, L. casei, and total bacterial load. SE, Standard error.
used three convolutional layers and ten hidden nodes. Each convolutional layer has 25, 50, 25 filters of kernel size 1×3. A total of 200 epochs was used to reduce overfitting. Training network weights were learned using the Adam algorithm (learn- ing rate=0.0001), a stochastic gradient descent method. Four CNN models, which had different input nodes, were designed to compare with MLR models. Each model was performed five times to generate average accuracy rate and mean square error (MSE). All CNN analysis was performed by Python 3.6.1 (Python Software Foundation, Wilmington, DE, USA) with a TensorFlow (Google, Mountain View, CA, USA) framework.
Results
The demographic information of the study population is shown in Table 1. A total of 960 participants, 456 males (47.5%) and 504 females (52.5%), were included in this study. The mean number of missing teeth was 1.22±2.88 and mean number of planned tooth extraction was 0.23±1.25. The number of non- smoker was 773 (80.5%), and those who had diabetes mellitus numbered 25 (2.6%). There was no significant difference be- tween the training set (N=658) and test set (N=302) for any vari- able.
In the multi-variable linear regression, the number of miss- ing teeth was significantly associated with age and hypertension.
Porphyromonas gingivalis also showed significant association with the number of missing teeth, except for Model 4 (Table 2).
The accuracy of predicting the number of missing teeth was evaluated and compared between the CNN and MLR approach- es. The accuracy of the CNN method was 65.0% in Model 1, which increased to 70.2% in Model 4 (Table 3). The accuracy of the MLR was about 50.0% in all models. The MSE of the CNN method was significantly smaller than the MLR.
Discussion
This cross-sectional study assessed the relationship between the number of missing teeth and periodontal pathogens in sali- va using deep learning compared to MLR. The study was unique in that CNN was used in the analysis of a cross-sectional study, not in the analysis of the image. Generally, CNN was investi- gated as a diagnostic accuracy tool using a medical image such as a radiograph15,22,23). The results showed that the CNN model had higher accuracy for the prediction of missing teeth than the MLR model.
Model 1 variables were clinically reliable and acceptable in the traditional statistical model. Several studies about periodon- tal pathogens have dealt with red complex and orange complex similar to the periodontal pathogen of Model 16,9,24-26). Compar- ing Model 1, Model 2 used additionally S. mitis, S. mutans, S.
sobrinus, L. casei, and total bacterial load, which were seldom used in the periodontal pathogen. In the CNN model, the ac- curacy rate was increased by 4.5%. This may be due to adjusting the number of bacteria related to dental caries in that the cause of tooth extraction is not only periodontal disease but also den- tal caries.
Model 3 used heart disease, lung disease, and the number of cigarettes per a day additionally. Heart disease and lung disease were measured using a simple questionnaire about his- tory, not accurate medical examination. Moreover, adding the number of cigarettes per day could adjust collinearity, because the smoking variable already was adjusted. Model 4 used the number of planned tooth extraction which was calculated from the treatment plan of dental chart. However, this variable could be unreliable, because there was no consideration about pros- thetic extraction or residual root. Therefore, Models 2, 3, and 4 could be considered as poor statistical models. However, all Table 3. Comparison of accuracy between convolutional neural network and multiple linear regression for each model
Model 1 Model 2 Model 3 Model 4
Accuracy rate MSE Accuracy rate MSE Accuracy rate MSE Accuracy rate MSE
CNN 65.0 4.90 69.5 3.07 68.3 3.33 70.2 3.54
MLR 50.9 95.21 50.0 69.90 50.0 59.68 51.2 60.15
Model 1 was adjusted for age, sex, smoking, hypertension, diabetes mellitus, A. actinomycetemcomitans, P. gingivalis, T. forsythus, F. nucleatum, P. intermedia, and P. nigrescens. Model 2 was adjusted for age, sex, smoking, hypertension, diabetes mellitus, A. actinomycetemcomitans, P. gin- givalis, T. forsythus, F. nucleatum, P. intermedia, and P. nigrescens, S. mitis, S. mutans, S. sobrinus, L. casei, and total bacterial load. Model 3 was adjusted for age, sex, smoking, number of cigarettes per a day, hypertension, diabetes mellitus, heart diseases, lung diseases, A. actinomycetem- comitans, P. gingivalis, T. forsythus, F. nucleatum, P. intermedia, and P. nigrescens, S. mitis, S. mutans, S. sobrinus, L. casei, and total bacterial load. Model 4 was adjusted for age, sex, number of planned tooth extractions, smoking, number of cigarettes per a day, hypertension, diabetes mellitus, heart diseases, lung diseases, A. actinomycetemcomitans, P. gingivalis, T. forsythus, P. intermedia, P. intermedia, and P. nigrescens, S.
mitis, S. mutans, S. sobrinus, L. casei, and total bacterial load.
CNN, Convolutional neural network; MLR, Multi-variable linear regression; MSE, Mean squared error.
CNN models showed higher accuracy and lower MSE than MLR.
Interestingly, an increasing trend of accuracy was shown adding covariates. While the MLR model showed similar accuracy and MSE adding covariates.
Generally, the deep CNN model used several convolutional layers and fully connected layers, because object detection and image classification are complex problems. However, we used only a convolutional layer and hidden layer, because our data was not image, but cross-sectional data, which had only 22 variables. The data was not as large as other image stud- ies. Hence, the only three convolutional layers used to facilitate deep learning performance.
This study had several limitations. First, this study was a ret- rospective cross-sectional design. Hence, the available variables were limited. Probing depth in dental chart information could be a clinically important variable. However, probing depth without calibration training could not be reliable. Moreover, there were many individuals without a probing depth record.
Participants were all new patients, and the number of planned tooth extractions was skewed to zero or one. If the number of planned tooth extractions was distributed normally, then the number of planned tooth extractions could be an outcome variable.
The second limitation of this study was the number of par- ticipants. The number of participants in this study was 960. For the deep learning analysis, all data require labelling. Especially in this research area, dental professionals should label data by themselves. Therefore, it was difficult to increase the number of participants in this study. Considering these limitations, further prospective well-designed studies, which have more than 5,000 participants, are required.
Recently, the human microbiome has attracted attention as an emerging theme, because using only human genomic infor- mation can not solve the mechanism of disease progression5,27). Knowledge of the oral microbiome with deep learning will en- able more accurate prediction of oral diseases.
Conclusions
This study shows that oral disease-related bacteria can in- fluence the prediction of tooth loss, and the deep learning anal- ysis method can be used more effectively than the conventional MLR method. Although the association between oral disease bacteria and lost teeth has been well documented, few studies have been conducted on predictive models using deep learning.
In future studies, prospective study design and the collection of clinical and epidemiological evidence will be needed, using a
greater number of samples. This study can demonstrate the use of deep learning in research to develop predictive models of oral health.
ORCID
Seon-Jip Kim, https://orcid.org/0000-0001-5909-5743 Dohyoung Rim, https://orcid.org/0000-0003-2022-6333 Jeong Uk Heo, https://orcid.org/0000-0001-7112-3196
References
1. Kassebaum NJ, Bernabé E, Dahiya M, Bhandari B, Murray CJ, Mar- cenes W. Global burden of severe periodontitis in 1990-2010: a sys- tematic review and meta-regression. J Dent Res 2014;93:1045-1053.
2. Haffajee AD, Socransky SS. Microbial etiological agents of destruc- tive periodontal diseases. Periodontol 2000 1994;5:78-111.
3. Schätzle M, Löe H, Lang NP, Bürgin W, Anerud A, Boysen H.
The clinical course of chronic periodontitis. J Clin Periodontol 2004;31:1122-1127.
4. Theilade E, Theilade J. Role of plaque in the etiology of periodontal disease and caries. Oral Sci Rev 1976;9:23-63.
5. Pflughoeft KJ, Versalovic J. Human microbiome in health and dis- ease. Annu Rev Pathol 2012;7:99-122.
6. Socransky SS, Haffajee AD. Periodontal microbial ecology. Peri- odontol 2000 2005;38:135-187.
7. Slots J. The predominant cultivable microflora of advanced peri- odontitis. Scand J Dent Res 1977;85:114-121.
8. Haffajee AD, Cugini MA, Tanner A, Pollack RP, Smith C, Kent RL Jr, et al. Subgingival microbiota in healthy, well-maintained elder and periodontitis subjects. J Clin Periodontol 1998;25:346-353.
9. Hyvärinen K, Salminen A, Salomaa V, Pussinen PJ. Systemic expo- sure to a common periodontal pathogen and missing teeth are as- sociated with metabolic syndrome. Acta Diabetol 2015;52:179-182.
10. Piuvezam G, de Lima KC. Factors associated with missing teeth in the Brazilian elderly institutionalised population. Gerodontology 2013;30:141-149.
11. Choi HM, Han K, Park YG, Park JB. Associations between the num- ber of natural teeth and renal dysfunction. Medicine (Baltimore) 2016;95:e4681.
12. A-Dan W, Jun-Qi L. Factors associated with the oral health-related quality of life in elderly persons in dental clinic: validation of a Mandarin Chinese version of GOHAI. Gerodontology 2011;28:184- 191.
13. Krizhevsky A, Sutskever I, Hinton GE. Imagenet classification with deep convolutional neural networks. In: Advances in Neural Infor- mation Processing Systems 28. Neural Information Processing Sys- tems Foundation Inc.;2012:1097-1105.
14. Trtica-Majnaric L, Zekic-Susac M, Sarlija N, Vitale B. Prediction of influenza vaccination outcome by neural networks and logistic re- gression. J Biomed Inform 2010;43:774-781.
15. Wang Z, Li L, Glicksberg BS, Israel A, Dudley JT, Ma'ayan A. Predict- ing age by mining electronic medical records with deep learning characterizes differences between chronological and physiological age. J Biomed Inform 2017;76:59-68.
16. Tonetti MS, Greenwell H, Kornman KS. Staging and grading of peri- odontitis: Framework and proposal of a new classification and case definition. J Periodontol 2018;89 Suppl 1:S159-S172.
17. Ravidà A, Qazi M, Troiano G, Saleh MHA, Greenwell H, Kornman K,
et al. Using periodontal staging and grading system as a prognostic factor for future tooth loss: A long-term retrospective study. J Peri- odontol 2019 Sep 9 [Epub]. DOI: 10.1002/JPER.19-0390.
18. Cheng F, Zhang M, Wang Q, Xu H, Dong X, Gao Z, et al. Tooth loss and risk of cardiovascular disease and stroke: A dose-response meta analysis of prospective cohort studies. PLoS One 2018;13:e0194563.
19. Souza ML, Massignan C, Glazer Peres K, Aurelio Peres M. Associa- tion between metabolic syndrome and tooth loss: A systematic re- view and meta-analysis. J Am Dent Assoc 2019;150:1027-1039.e7.
20. Saito S, Ohi T, Murakami T, Komiyama T, Miyoshi Y, Endo K, et al.
Association between tooth loss and cognitive impairment in com- munity-dwelling older Japanese adults: a 4-year prospective cohort study from the Ohasama study. BMC Oral Health 2018;18:142.
21. Socransky SS, Haffajee AD, Cugini MA, Smith C, Kent RL Jr. Mi- crobial complexes in subgingival plaque. J Clin Periodontol 1998;25:134-144.
22. Lehman CD, Wellman RD, Buist DS, Kerlikowske K, Tosteson AN, Miglioretti DL. Diagnostic accuracy of digital screening mammogra- phy with and without computer-aided detection. JAMA Intern Med 2015;175:1828-1837.
23. Gulshan V, Peng L, Coram M, Stumpe MC, Wu D, Narayanaswamy A, et al. Development and validation of a deep learning algorithm for detection of diabetic retinopathy in retinal fundus photographs.
JAMA 2016;316:2402-2410.
24. Hyvärinen K, Laitinen S, Paju S, Hakala A, Suominen-Taipale L, Skurnik M, et al. Detection and quantification of five major peri- odontal pathogens by single copy gene-based real-time PCR. Innate Immun 2009;15:195-204.
25. Gomes SC, Nonnenmacher C, Susin C, Oppermann RV, Mutters R, Marcantonio RA. The effect of a supragingival plaque-control regi- men on the subgingival microbiota in smokers and never-smokers:
evaluation by real-time polymerase chain reaction. J Periodontol 2008;79:2297-2304.
26. Gomes SC, Piccinin FB, Oppermann RV, Susin C, Nonnenmacher CI, Mutters R, et al. Periodontal status in smokers and never- smokers: clinical findings and real-time polymerase chain reaction quantification of putative periodontal pathogens. J Periodontol 2006;77:1483-1490.
27. Wade WG. The oral microbiome in health and disease. Pharmacol Res 2013;69:137-143.