Original Article: Food Science/Microbiology
Risk Assessment on Nitrate and Nitrite in Vegetables Available in Korean Diet
Junghyuck Suh* · Ock jin Paek · YoungWoon Kang · Ji Eun Ahn · Ji Sun Jung
· Yeong Soon An · Sun-Hee Park · Sang-Jae Lee · Kwang-Ho Lee
Received: 29 March 2013 / Accepted: 16 June 2013 / Published Online: 31 December 2013
© The Korean Society for Applied Biological Chemistry 2013
Abstract Nitrate is a naturally occurring compound in plant and can be converted to nitrite in the nitrogen cycle and vice versa.
Therefore, it is easy to find nitrate in plants including vegetables.
Especially, it is known that high levels of nitrate found in leafy vegetables. Nitrate itself is relatively non-toxic but its metabolites and reaction products such as nitrite, nitric oxide and N-nitroso compounds, may produce adverse health effects such as methaemoglobinaemia and carcinogenesis. To execute the risk assessment of dietary nitrate and nitrite for the intake of vegetables, it is investigated that the levels of nitrate and nitrite in 23 vegetables (798 samples). The range of concentration were 0−6,719 mg/kg for nitrate and 0−1,635 mg/kg for nitrite, respectively.
The Estimated daily intakes (EDI) were 0.85−1.38 mg/kg body weight/day for nitrate and 0.02−0.03 mg/kg body weight/day for nitrite by ages. We conclude that there are no health concerns for eating various vegetables since the EDI were below the Tolerable Daily Intake (3.7 mg/kg body weight/day for nitrate, 0.06 mg/kg body weight/day for nitrite) level established by WHO.
Keywords dietary intake · nitrate · nitrite · risk assessment · vegetable
Introduction
Nitrate is a naturally occurring compound in plant and can be converted to nitrite in the nitrogen cycle and vice versa (EFSA,
2008). In addition, it is easy to find nitrate in plants since nitrate is used as a nitrogen source in order to synthesize protein from air, water, soil and etc (Shimada and Ko, 2004). Thus, nitrate and nitrite exist in plants including vegetables, particularly green leafy vegetables such as lettuce and spinach (EFSA, 2008). Nitrate itself is relatively non-toxic but its metabolites and reaction products such as nitrite, nitric oxide and N-nitroso compounds, may produce adverse health effects such as methaemoglobinaemia and carcinogenesis (FAO/WHO, 1996; Merino, 2009). Therefore, it is necessary to estimate how much those substances intake in our diet. Although the three main sources of nitrate intake in human are vegetables, water and cured meat. This study only focuses on vegetables since drinking water is routinely tested for nitrate with a maximum regulatory level, 10 mg/kg and it is strictly specify that a permissible amount of nitrate and nitrite in processed foods which were preserved with sodium nitrate and nitrite by the Korean Food Code (UMI, 2009; KFDA, 2010). In fact, vegetables are important components of a healthy diet since they are a good source of vitamins, minerals and other nutrients. The World Health Organization (WHO) already had recommended that a daily intake of fresh fruit and vegetables in 400 to 500 gram per day (g/d) through their many studies in which the conclusion was sufficient daily consumption of vegetables can help prevent many diseases, including cardiovascular disease, cancers, obesity and diabetes (FAO/WHO, 2002). It is important to recognize the exact amount of nitrate and nitrite content in various vegetables in order to provide a scientific basis with which the government makes a health policy decision. However, the available data on nitrate and nitrite level of vegetables in Korea were reported 10 years ago which would be assumed to differ from those of foods currently consumed by Korean. In addition, the consumption of vegetables in the Korean diet had increased three times from 1965 to 2005.
Furthermore, considerable variety is observed in the nitrate and nitrite concentrations of plants depending on species, variety, plant part, state of maturity and environmental conditions, such as drought, harvest temperature, nutrient deficiencies, insect damage, use of herbicides and/or insecticides and application of nitrogen- J. Suh · O. J. Paek · Y. Kang · J. E. Ahn · J. S. Jung · S. -H. Park · S. -J. Lee ·
K. -H. Lee
Food Safety Evaluation Department, National Institute of Food and Drug Safety Evaluation, Cheongwon-gun 363-951, Republic of Korea Y. S. An
Criminal Investigations Office, Ministry of Food and Drug Safety, Cheongwon-gun 363-951, Republic of Korea
*Corresponding author (J. Suh: [email protected])
based fertilizers to stimulate plant growth although it is known that high levels of nitrate are found in leafy vegetables (FAO/
WHO, 2003; 2007). The aim of this study was to investigate the amount of nitrate and nitrite in the various vegetables and to estimate whether the dietary intake of vegetables regarding health concern for Korean population.
Materials and Methods
Sample collection. In order to carry out a risk assessment on nitrate and nitrite in the dietary intake of vegetables, national-wide monitoring program was executed in 2012. The 23 items among the various vegetables were selected from the 2008 Korea national consumption data and the nitrate detecting background of food items. A total of 798 samples, including Kimchi cabbage, cabbage, lettuce, spinach, crown daisy, chard, chicory, parsley, radish, onion, carrot, garlic, pumpkin, cucumber, green pepper, egg plant, green onion, Chinese chive, celery, soybean sprouts, green bean sprouts, potato and sweet potato, were collected from retail markets during April-August, 2012 in 15 distributional regions (Table 1).
Reagent and standards. Sodium carbonate and standards of nitrate and nitrite were purchased from Sigma-Aldrich (USA). 9 mM sodium carbonate (NaNO3) solution was manufactured by dissolved with distilled water and filtrated under vacuum. Distilled water was prepared to 18 MΩ by 3rd distillatory (Nanopure
diamond, Barnstead, USA). Nitrate and nitrite standards diluted in distilled water were prepared at a concentration of 100 and 10 mg/
L, respectively. For calibration curves, the mixed standard solution was diluted to various concentrations (0.31, 0.63, 1.25, 2.50, 5.00, 10.00 mg/L for nitrite, 3.13, 6.25, 12.50, 25.00, 50.00, 100.00 mg/
Table 1 Number of collected vegetable samples according to the regions in Korea
Vegetables No. Seoul Incheon Gyeonggi Kangwon Chungnam Chungbuk Daejeon KangjuJeonnam JeonbukKyungnamKyungbuk Busan Daegu Ulsan
Kimchi cabbage 34 7 2 6 1 3 1 1 1 2 1 3 1 2 2 1
Cabbage 34 5 3 6 1 2 1 1 1 2 2 2 2 3 2 1
Lettuce 38 5 5 7 1 2 1 1 1 2 2 3 3 2 2 1
Spinach 37 5 3 6 1 3 2 1 1 2 2 3 2 3 2 1
Crown daisy 34 4 4 6 2 2 1 1 1 2 2 3 0 3 2 1
Chard 34 5 2 5 2 2 1 1 1 2 2 3 2 3 2 1
Chicory 34 5 2 6 2 2 1 1 1 2 2 3 2 2 2 1
Parsley 16 2 1 3 1 1 0 1 1 0 0 1 2 1 1 1
Radish 36 5 2 7 1 2 1 2 1 2 2 3 2 3 2 1
Onion 37 5 4 7 1 2 1 1 1 2 2 3 2 3 2 1
Carrot 37 5 4 7 1 2 1 1 1 2 2 3 2 3 2 1
Garlic 37 5 4 6 1 2 2 1 1 2 2 3 2 3 2 1
Pumpkin 37 5 4 6 1 2 2 1 1 2 2 3 2 3 2 1
Cucumber 37 5 3 7 1 3 1 1 1 2 2 3 2 3 2 1
Green pepper 37 5 4 7 1 2 2 1 1 2 1 3 2 3 2 1
Egg plant 33 5 3 5 1 2 1 2 1 2 2 1 2 3 2 1
Green Onion 37 5 2 7 3 2 1 1 1 2 2 3 2 3 2 1
Chinese chive 36 5 4 6 1 2 1 1 1 2 2 3 2 3 2 1
Celery 34 5 1 8 1 2 1 1 1 2 2 3 2 2 2 1
Soybean sprouts 37 6 2 8 1 2 1 1 1 2 3 3 2 2 2 1
Green bean sprouts 31 5 4 5 1 2 1 1 2 1 1 3 0 3 1 1
Potato 35 5 3 7 1 2 1 1 1 2 2 2 2 3 2 1
Sweet potato 36 5 2 7 1 3 1 1 1 2 2 3 2 3 2 1
Total No. 798 114 68 145 28 49 26 25 24 43 42 63 42 62 44 23
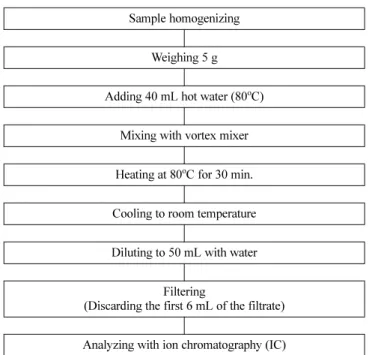
Sample homogenizing
Weighing 5 g
Adding 40 mL hot water (80oC)
Mixing with vortex mixer
Heating at 80oC for 30 min.
Cooling to room temperature
Diluting to 50 mL with water
Filtering
(Discarding the first 6 mL of the filtrate)
Analyzing with ion chromatography (IC) Fig. 1 Procedure for detection of nitrate and nitrite of vegetables.
L for nitrate).
Sample preparation and extraction. The all kind of collected vegetable samples were washed properly with distilled water and the edible portion was separated from the bark. Then the edible portions of the vegetables were homogenized using the grinder (Hallde, Sweden). From the homogenized samples, 5 g was inserted into 50 mL plastic tube with cap and then mixed vigorously using vortex mixer after adding 40 mL hot water (80oC) and capping. The extracted samples were incubated at 80oC for 30 min on water bath (Vision Scientific Co. LTD., Korea) and then adjusted to 50 mL with distilled water after cooling to room temperature. The samples were filtered by using
a 0.45µm syringe filter (Millipore co., USA) before being injected to Ion Chromatography/Conductivity Detector (IC/CD) (Fig. 1).
Instrumental analysis. The concentrations of nitrate and nitrite were determined using ion chromatography/conductivity detector, simultaneously. The analysis and data collection were carried out by LabNet IC1000 software. Both guard column (IonPacTM AS9-HC RFICTM Guard 4×50 mm) and analytical column (Ion PacTM AS9-HC RFICTM 4×250 mm) were purchased from Dionex (Thermo-Fisher Scientific, USA). The detail analytical condition of IC/CD was in Table 2.
Results and Discussion
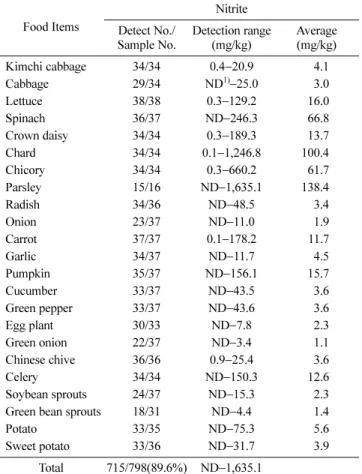
Nitrate and nitrite content in vegetables. A total of 798 vegetable samples were analyzed and the overall nitrate and nitrite concentrations ranged from 0−6,719 mg/kg and 0−1,635 mg/kg, respectively. The full results of the monitoring program are described in Table 3 and Table 4. Nitrate and nitrite were detected in 95.3 and 89.4% of the samples, respectively. Of the vegetables surveyed, the highest concentration of nitrate was measured in spinach (6,719 mg/kg) and that of nitrite was measured in parsley (1,635 mg/kg). On average, crown daisy had the highest nitrate concentration (2,938 mg/kg), whereas green bean sprouts had the Table 4 Levels of nitrite in vegetable samples
Food Items
Nitrite Detect No./
Sample No.
Detection range (mg/kg)
Average (mg/kg)
Kimchi cabbage 34/34 0.4−20.9 4.1
Cabbage 29/34 ND1)−25.0 3.0
Lettuce 38/38 0.3−129.2 16.0
Spinach 36/37 ND−246.3 66.8
Crown daisy 34/34 0.3−189.3 13.7
Chard 34/34 0.1−1,246.8 100.4
Chicory 34/34 0.3−660.2 61.7
Parsley 15/16 ND−1,635.1 138.4
Radish 34/36 ND−48.5 3.4
Onion 23/37 ND−11.0 1.9
Carrot 37/37 0.1−178.2 11.7
Garlic 34/37 ND−11.7 4.5
Pumpkin 35/37 ND−156.1 15.7
Cucumber 33/37 ND−43.5 3.6
Green pepper 33/37 ND−43.6 3.6
Egg plant 30/33 ND−7.8 2.3
Green onion 22/37 ND−3.4 1.1
Chinese chive 36/36 0.9−25.4 3.6
Celery 34/34 ND−150.3 12.6
Soybean sprouts 24/37 ND−15.3 2.3
Green bean sprouts 18/31 ND−4.4 1.4
Potato 33/35 ND−75.3 5.6
Sweet potato 33/36 ND−31.7 3.9
Total 715/798(89.6%) ND−1,635.1 ND: Not detection
Table 2 Analytical conditions of IC-Conductivity for nitrate and nitrite analysis in vegetables
Instrument IC-Condition
Guard Column IonPac AS9-HC RFICTM guard 4×50 mm Analytical Column IonPac AS9A-HC RFICTM 4×250 mm Mobile phase 9 mM Na2CO3
Detector Conductivity detector
Flow rate 1.0 mL/min
Column Temperature 30oC Cell Temperature 35oC Injection volume 50 µL
Table 3 Levels of nitrate in vegetable samples
Food Items
Nitrate Detect No./
Sample No.
Detection range (mg/kg)
Average (mg/kg) Kimchi cabbage 34/34 211.6−2,123.6 1,059.9
Cabbage 34/34 222.5−1,366.3 533.8
Lettuce 38/38 33.4−3,944.2 1,386.5
Spinach 37/37 17.6−6,719.8 2,123.8
Crown daisy 33/34 ND−6,186.2 2,938.3
Chard 34/34 215.9−3,748.1 2,021.2
Chicory 34/34 36.5−4,109.7 1,754.9
Parsley 16/16 63.3−4,621.1 2,336.4
Radish 35/36 ND−3,486.7 1,494.0
Onion 36/37 ND−98.4 36.0
Carrot 36/37 ND−1,005.4 261.9
Garlic 34/37 ND−145.7 35.7
Pumpkin 37/37 36.5−721.0 357.7
Cucumber 37/37 3.2−661.6 157.2
Green pepper 37/37 2.3−286.1 69.8
Egg plant 33/33 103.5−636.0 347.0
Green onion 37/37 6.1−1,319.8 382.0
Chinese chive 36/36 198.2−2,671.7 1,590.9
Celery 34/34 101.2−6,302.7 2,422.4
Soybean sprouts 21/37 ND−70.2 8.0
Green bean sprouts 19/31 ND−7.7 3.1
Potato 35/35 26.6−396.1 206.5
Sweet potato 33/36 ND−640.1 71.3
Total 762/798(95.4%) ND−6,719.8 ND: Not detection
Table 5 Estimated daily intake of nitrate from consumption of various vegetables
Food Items Ave. conc.
(mg/kg)
Daily consumption (g/day)
Daily exposure (mg/day)
Estimated Daily Intake (mg/kg body weight/day)
Kimchi cabbage 1,059.9 8.55 9.06 0.151
Cabbage 533.8 3.26 1.74 0.029
Lettuce 1,386.5 6.36 8.82 0.147
Spinach 2,123.8 6.63 14.08 0.235
Crown daisy 2,938.3 0.56 1.65 0.028
Chard 2,021.2 0.40 0.81 0.014
Chicory 1,754.9 0.04 0.07 0.001
Parsley 2,336.4 0.00 0.00 0.000
Radish 1,494.0 7.72 11.53 0.192
Onion 36.0 22.10 0.80 0.013
Carrot 261.9 5.63 1.47 0.025
Garlic 35.7 4.52 0.16 0.003
Pumpkin 357.7 11.00 3.93 0.066
Cucumber 157.2 12.98 2.04 0.034
Green pepper 69.8 23.24 1.62 0.027
Egg plant 347.0 1.41 0.49 0.008
Green onion 382.0 12.52 4.78 0.080
Chinese chive 1,590.9 2.18 3.47 0.058
Celery 2,422.4 0.10 0.24 0.004
Soybean sprouts 8.0 11.55 0.09 0.002
Green bean sprouts 3.1 1.65 0.01 0.000
Potato 206.5 19.78 4.08 0.068
Sweet potato 71.3 12.49 0.89 0.015
Total 174.67 71.83 1.20
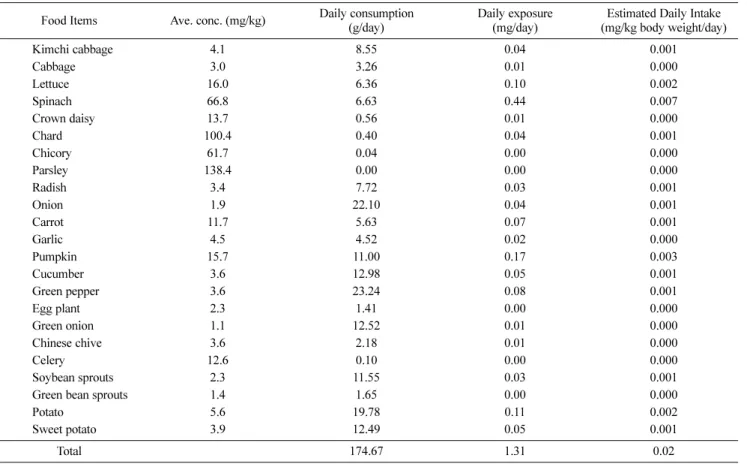
Table 6 Estimated daily intake of nitrite from consumption of various vegetables Food Items Ave. conc. (mg/kg) Daily consumption
(g/day)
Daily exposure (mg/day)
Estimated Daily Intake (mg/kg body weight/day)
Kimchi cabbage 4.1 8.55 0.04 0.001
Cabbage 3.0 3.26 0.01 0.000
Lettuce 16.0 6.36 0.10 0.002
Spinach 66.8 6.63 0.44 0.007
Crown daisy 13.7 0.56 0.01 0.000
Chard 100.4 0.40 0.04 0.001
Chicory 61.7 0.04 0.00 0.000
Parsley 138.4 0.00 0.00 0.000
Radish 3.4 7.72 0.03 0.001
Onion 1.9 22.10 0.04 0.001
Carrot 11.7 5.63 0.07 0.001
Garlic 4.5 4.52 0.02 0.000
Pumpkin 15.7 11.00 0.17 0.003
Cucumber 3.6 12.98 0.05 0.001
Green pepper 3.6 23.24 0.08 0.001
Egg plant 2.3 1.41 0.00 0.000
Green onion 1.1 12.52 0.01 0.000
Chinese chive 3.6 2.18 0.01 0.000
Celery 12.6 0.10 0.00 0.000
Soybean sprouts 2.3 11.55 0.03 0.001
Green bean sprouts 1.4 1.65 0.00 0.000
Potato 5.6 19.78 0.11 0.002
Sweet potato 3.9 12.49 0.05 0.001
Total 174.67 1.31 0.02
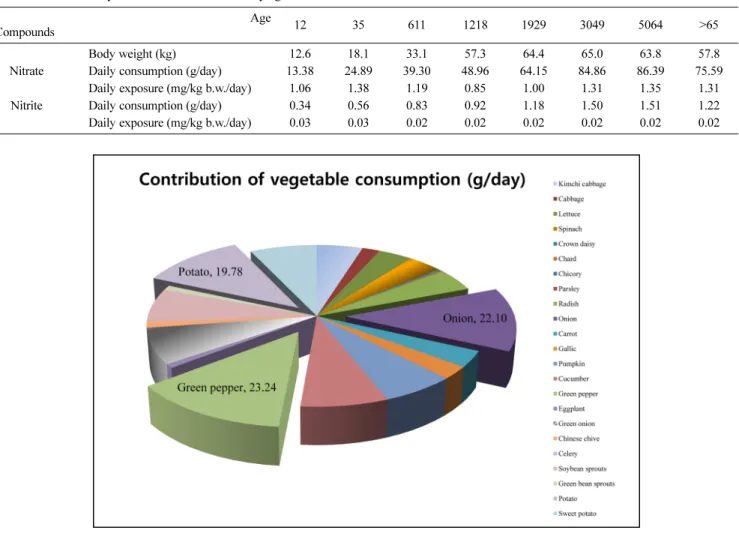
Table 7 Estimated daily intake of nitrate and nitrite by age Age
Compounds 12 35 611 1218 1929 3049 5064 >65
Body weight (kg) 12.6 18.1 33.1 57.3 64.4 65.0 63.8 57.8
Nitrate Daily consumption (g/day) 13.38 24.89 39.30 48.96 64.15 84.86 86.39 75.59
Daily exposure (mg/kg b.w./day) 1.06 1.38 1.19 0.85 1.00 1.31 1.35 1.31
Nitrite Daily consumption (g/day) 0.34 0.56 0.83 0.92 1.18 1.50 1.51 1.22
Daily exposure (mg/kg b.w./day) 0.03 0.03 0.02 0.02 0.02 0.02 0.02 0.02
Fig. 2 Contribution of vegetable consumption for average consumption group.
Fig. 3 Contribution of nitrate exposure of vegetable for average consumption group.
lowest (3.1 mg/kg). In regard to nitrite, parsley had the highest average concentration (138.4 mg/kg) and green onion had the lowest (1.1 mg/kg) (Table 3 and 4).
Risk assessment of nitrate and nitrite. Dietary exposure estimate was evaluated for the general population. Nitrate and nitrite exposure assessed by combining the dietary intake of the forth Korea National Health and Nutrition Examination survey (KNHANES IV-20 conducted by Korea Centers for Disease Control and Prevention in 2008). These estimates can be compared to the Tolerable Daily Intake (TDI) assigned by the WHO. The left-censored data (non-detect) were handled according to the WHO guideline (FAO/WHO, 1995).
Based on the results of this survey, the daily exposure to nitrate from investigated vegetables among general consumers was 71.83 mg/day (Table 5). The value of exposure to nitrate for general consumers has been declined compared with that reported in early study which was surveyed in 1998 (Chung et al., 2003). According to the literatures, the dietary intakes of nitrate were 267 mg/day for Australians and 89 mg/kg for France (Hsu et al., 2009; Menard et al., 2008). Thus, the typical dietary exposure to nitrate in Korean population is similar to that of another country population or lower. For nitrite, the daily exposure was 1.31 mg/day for general consumers (Table 6). The daily exposure of nitrite is ten times higher than old report even though it is impossible to compare those results directly because of the difference of two methods (IC and UV/Vis spectrometry) (Chung et al., 2003).
Assuming the body weight with 60 kg for the average population, the estimated daily intakes (EDI) was 1.20 mg/kg body weight/
day for nitrate (Table 5) and 0.02 mg/kg body weight/day for nitrite (Table 6). We also estimate the EDI by age because infants
and young children are the main target group for health concern of nitrate intake. From the consumption data, the EDI of nitrate were estimated from 0.85 to 1.38 mg/kg body weight/day and from 0.02 to 0.03 mg/kg body weight/day for nitrite for eight different age groups (Table 7).
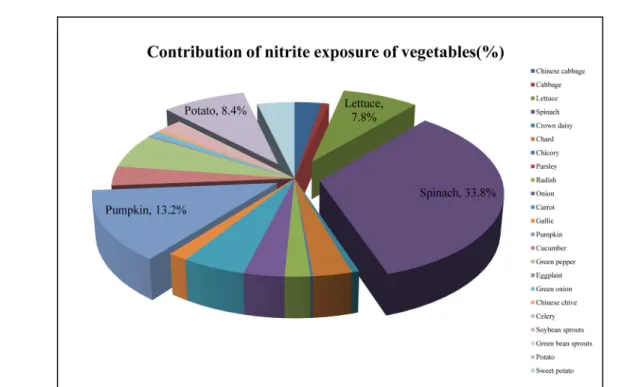
Fig. 2 shows the contribution of investigated vegetable consumption. Green pepper was contributed most to the consumption followed by onion, potato, cucumber and green onion. As seen in Fig. 3, spinach is the major individual contributor to Korean population’s nitrate intake from vegetables, followed by radish, Kimchi cabbage, lettuce and green onion. In the vegetables under study, the consumption of spinach was not the items higher items than that of the other vegetables consumption.
Therefore, we can estimate the exposure of nitrate via dietary vegetables depend on the contents of nitrate rather than the level of vegetable consumption (Fig. 3). Similar results are shows in the exposure of nitrite (Fig. 4).
As a result, the estimates of exposure to nitrate and nitrite from investigated vegetables for the general consumers indicate that those exposures are below the TDI (3.7 mg/kg weight/day for nitrate, 0.06 mg/kg body weight/day for nitrite) established by the WHO.
In conclusion, we estimate that there is no health concern for eating various vegetables for Korean population because those EDI were below the level of the TDI which were established by the WHO. According to recent research, nitrate participates in the host-defence having antimicrobial activity, and other nitrate metabolites play important physiological roles such as vasoregulation.
Therefore, we suggest that eating more than 350 g vegetable each day for a person is ideal for a healthy balanced diet.
Fig. 4 Contribution of nitrite exposure of vegetable for average consumption group.
References
Chung SY, Kim JS, Kim MC, Hong MK, Lee JO, and Kim CM (2003) Survey of nitrate and nitrite contents of vegetables grown in Korea. Food Additives and Contaminants 220, 621–28.
EFSA [European Food Safety Authority] (2008) Nitrate in vegetables.
Scientific opinion of the panel on contaminants in the food chain. The EFSA Journal 689, 179.
Hsu J, Arcot J, and Alice L (2009) Nitrate and nitrite quantification from cured meat and vegetables and their estimated dietary intake in Australians. Food Chemistry 115, 334–9.
Korea Food and Drug Administration (2010) Food Code, Korea.
Menard C, Heraud F, Volatier JL, and Leblanc JC (2008) Assessment of dietary exposure of nitrate and nitrite in France. Food Additives and Contaminants 25, 971–88.
Merino L (2009) In Nitrate in Foodstuffs: Analytical Standardization and Monitoring and Control in Leafy Vegetable, SLU Service/Repro, Sweden Shimada Y and Ko S (2004) Nitrate in Vegetables. Chugokugakuen J 3, 7–10
UMI (2009) Estimated Dietary Intake of Nitrate, Nitrites, and Nitrosamines in U.S. Women of Child-bearing Age. USA.
FAO/WHO (1995) GEMS/Food-EURO Second Workshop on Reliable Evaluation of Low-level Contamination of Food. Geneva, World Health Organization, Report on a Workshop in the Frame of GEMS/Food- EURO, Switzerland.
FAO/WHO (1996) Toxicological evaluation of certain food additives and contaminants. Geneva, World Health Organization, Joint FAO/WHO Expert Committee on Food Additives, WHO food additive series No.
35), Switzerland.
FAO/WHO (2002) Reducing risk, promoting health life. Geneva, World Health Organization, The World Health Report, Switzerland.
FAO/WHO (2003) Nitrate and nitrite, Geneva, WHO food additive series 50, Switzerland
FAO/WHO (2007) Nitrate and nitrite in drinking-water, Geneva, Background document for development of WHO Guidelines for Drinking-water Quality, WHO/SDE/WSH/07.01./16, Switzerland.