aGraduate Student, cAssociate Professor, dProfessor, Department of Orthodontics, School of Dentistry and Dental Research Institute, Seoul National University, Seoul, Korea.
bProfessor, Department of Prosthodontics and Orthodontics, School of Dentistry, Health Science University of Mongolia, Ulaan- baatar, Mongolia.
Corresponding author: Tae-Woo Kim.
Department of Orthodontics, School of Dentistry and Dental Research Institute, Seoul National University, 275-1 Yeongeon- dong, Jongno-gu, Seoul 110-768, Korea.
+82 2 2072 3317; e-mail, [email protected].
Received August 4, 2010; Last Revision November 29, 2010;
Accepted December 3, 2010.
DOI:10.4041/kjod.2011.41.1.42
*This study was supported by grant No. 04-2008-0022 from the Seoul National University Dental Hospital Research Fund. We would like to thank Dr. Nomingerel Sukhbaatar, Dr. Su-Jung Ma, Dr. Yun-Sik Lee, and other staff for their assistance in data acquisition and analysis.
Comparison of cephalometric norms between Mongolian and Korean adults with normal occlusions and well-balanced profiles
Ji-Hwan Kim, DDS, MSD,a Odontuya Gansukh, DDS, MSD,a Bazar Amarsaikhan, DDS, PhD,b Shin-Jae Lee, DDS, MSD, PhD,c Tae-Woo Kim, DDS, MSD, PhDd
Objective: The purposes of this study were to establish cephalometric norms of Mongolian adults, which have not previously been reported in orthodontic journals, and to compare them with cephalometric norms of Korean adults. Methods: Lateral cephalometric radiographs of 74 Mongolian adults (35 men, 39 women) and 95 Korean adults (52 men, 43 women) with normal occlusions and well-balanced lateral profiles were obtained. The subjects were chosen by orthodontists of the same ethnic background. Forty craniofacial var- iables were measured, and groups were compared by analysis of covariance. Results: The cephalometric norms for male and female Mongolian and Korean adults with normal occlusions and well-balanced lateral profiles were established. Sexual dimorphism was found in linear skeletal measurements and vertical skel- etal relationships. Compared with Korean adults, Mongolian adults had shorter anterior facial height, more prominent chins, and more upright upper incisors. There were few differences in soft tissue measurements.
The differences were statistically significant, but their clinical importance may be limited. Conclusions:
Cephalometric differences can be considered, but little difference may exist in the orthodontic diagnosis and treatment planning of Mongolian and Korean adults. (Korean J Orthod 2011;41(1):42-50)
Key words: Cephalometrics, Ethnic norms
INTRODUCTION
Facial esthetics and functional occlusion have been recognized as the most important goals of orthodontic treatment. To accomplish these goals, it is important to know the normal craniofacial structure of adults in var- ious ethnic groups.
Radiographic cephalometry is one of the most im- portant tools of clinical and research orthodontics, and cephalometric standard values have provided useful guidelines in orthodontic diagnosis and treatment plan- ning. However, most classical cephalometric stand- ards1-4 were based on Caucasians with European ances- try, and cephalometric norms for patients from differ- ent racial and ethnic backgrounds were established later.5-13 Korean cephalometric norms have been re- ported by several Korean authors14-17 and the Korean Association of Orthodontists.18 Most of these studies
concluded that cephalometric norms are specific to an ethnic or racial group and cannot always be applied to other ethnic types.
Social and academic interest in orthodontics is in- creasing in Mongolia, but there are no data available in orthodontic or other professional journals concerning cephalometric standards for the Mongolian population.
Various anthropological studies have reported linguis- tic19 and genetic20-24 associations between Mongolians and Koreans, but cephalometric comparisons between the two related ethnic groups have not been reported.
The purposes of this study were (1) to establish the cephalometric norms of men and women adults from Mongolia who were selected on the basis of having normal occlusions and well-balanced profiles, and (2) to compare them with the cephalometric norms of the Korean samples selected with the same process. An understanding of the underlying possible structural sim- ilarities and differences between these two ethnic groups could be applied to the orthodontic diagnosis, treatment planning, and treatment mechanics.
MATERIAL AND METHODS Sample selection
Institutional review board approval (No. CRI0927) was obtained from the Research Ethics Committee of the Clinical Dental Research Institute, Seoul National University Dental Hospital.
Selection of subjects was performed in three steps in Ulaanbaatar, Mongolia and Seoul, Korea. First, a clin- ical examination was performed by several orthodont- ists to evaluate the occlusion. Among non-growing adults of Mongolian/Korean ancestry (18 - 28 years old), subjects who were judged to have a normal oc- clusion were selected. Study casts and lateral cephalo- grams of these subjects were obtained.
For the second step, two examiners (J-H K and T-W K) selected subjects with normal occlusion on the basis of the study casts, using the following criteria: Class I molar and canine relationship with normal occlusal interdigitation; well-aligned maxillary and mandibular dental arches with minimal crowding or spacing (< 3
overjet and overbite (2 - 4 mm); no previous ortho- dontic treatment or orthognathic surgery; no or mini- mal restorative or prosthodontic treatment.
Finally, two Mongolian and two Korean orthodont- ists selected final subjects of their own ethnicity, who were judged to have well-balanced profiles with good facial harmony, based on untraced lateral cephalo- grams. Subjects with protrusive or retrusive profiles (upper/lower lip to Ricketts’ E-line > 3 mm or < −3 mm) were excluded.
The Mongolian subjects (35 men and 39 women) were chosen from Ulaanbaatar university students who were born in Ulaanbaatar or its suburbs and belonged to the Khalkha Mongol group. The Korean subjects (52 men and 43 women) were chosen from dental stu- dents at Seoul National University. They were born and had lived in various cities in Korea, but all were of Korean ancestry.
Data acquisition
Lateral cephalograms were taken with two cepha- lostats. A Veraviewepocs digital cephalostat (J. Morita Mfg. Corp., Kyoto, Japan) at the Department of Dental Radiology, Health Science University of Mongolia (target-source distance, 150 cm target-film distance 15 cm, 80 kV; 9 mA) was used to take cephalograms of the Mongolian sample. The magnification rate was 110.0%. A Cranex 3+ cephalostat (Orion Corporation Soredex, Helsinki, Finland) at the Department of Orthodontics, Seoul National University Dental Hospit- al (target-source distance, 150 cm target-film distance, 20 cm; 75 kV; 10 mA) was used to take cephalograms of the Korean sample. The magnification rate was 113.3%. The linear measurements of the Korean sam- ple were converted to the generally accepted magnifi- cation rate of 110.0%. All cephalograms were taken with the subjects in natural head position, teeth in cen- tric occlusion, and lips relaxed.
Lateral cephalograms of each subject were digitized and then analyzed with V-Ceph 5.3 software (Osstem, Seoul, Korea) by a single investigator (J-H K) to elim- inate inter-examiner variability. All landmarks were checked twice, adjusting radiographic density, contrast, and
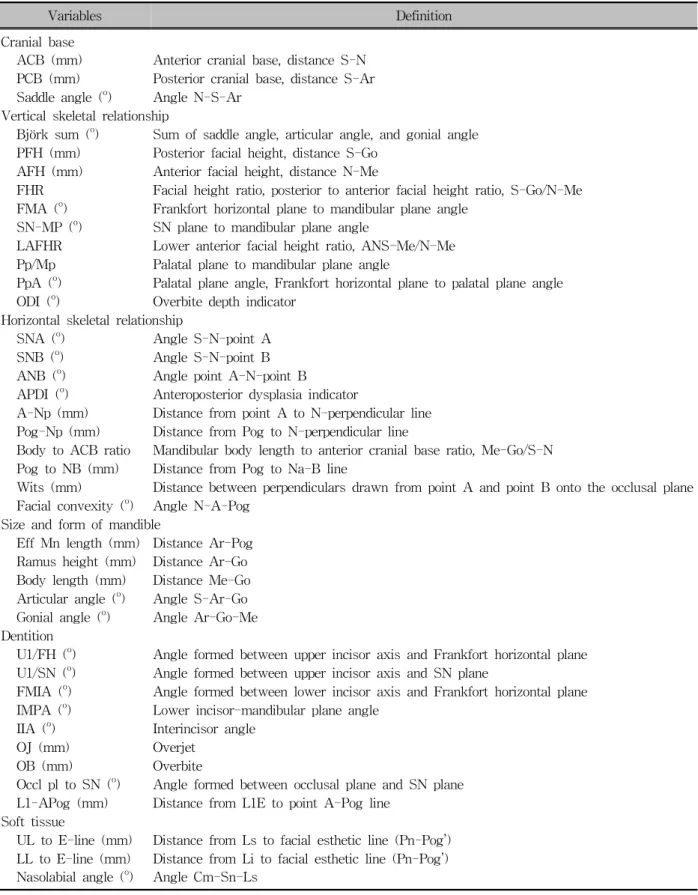
Variables Definition Cranial base
ACB (mm) Anterior cranial base, distance S-N PCB (mm) Posterior cranial base, distance S-Ar Saddle angle (o) Angle N-S-Ar
Vertical skeletal relationship
Björk sum (o) Sum of saddle angle, articular angle, and gonial angle PFH (mm) Posterior facial height, distance S-Go
AFH (mm) Anterior facial height, distance N-Me
FHR Facial height ratio, posterior to anterior facial height ratio, S-Go/N-Me FMA (o) Frankfort horizontal plane to mandibular plane angle
SN-MP (o) SN plane to mandibular plane angle
LAFHR Lower anterior facial height ratio, ANS-Me/N-Me Pp/Mp Palatal plane to mandibular plane angle
PpA (o) Palatal plane angle, Frankfort horizontal plane to palatal plane angle ODI (o) Overbite depth indicator
Horizontal skeletal relationship
SNA (o) Angle S-N-point A
SNB (o) Angle S-N-point B ANB (o) Angle point A-N-point B
APDI (o) Anteroposterior dysplasia indicator
A-Np (mm) Distance from point A to N-perpendicular line Pog-Np (mm) Distance from Pog to N-perpendicular line
Body to ACB ratio Mandibular body length to anterior cranial base ratio, Me-Go/S-N Pog to NB (mm) Distance from Pog to Na-B line
Wits (mm) Distance between perpendiculars drawn from point A and point B onto the occlusal plane Facial convexity (o) Angle N-A-Pog
Size and form of mandible
Eff Mn length (mm) Distance Ar-Pog Ramus height (mm) Distance Ar-Go Body length (mm) Distance Me-Go Articular angle (o) Angle S-Ar-Go Gonial angle (o) Angle Ar-Go-Me Dentition
U1/FH (o) Angle formed between upper incisor axis and Frankfort horizontal plane U1/SN (o) Angle formed between upper incisor axis and SN plane
FMIA (o) Angle formed between lower incisor axis and Frankfort horizontal plane IMPA (o) Lower incisor-mandibular plane angle
IIA (o) Interincisor angle
OJ (mm) Overjet
OB (mm) Overbite
Occl pl to SN (o) Angle formed between occlusal plane and SN plane L1-APog (mm) Distance from L1E to point A-Pog line
Soft tissue
UL to E-line (mm) Distance from Ls to facial esthetic line (Pn-Pog’) LL to E-line (mm) Distance from Li to facial esthetic line (Pn-Pog’) Nasolabial angle (o) Angle Cm-Sn-Ls
Table 1. Cephalometric variables measured
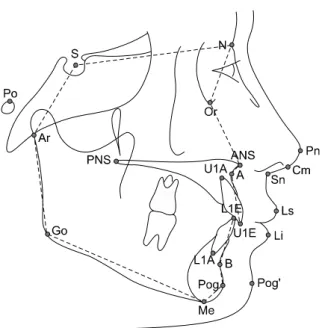
Fig 1. The cephalometric landmarks used in this study.
S, Sella; N, nasion; Or, orbitale; Po, porion; Ar, articu- lare; ANS, anterior nasal spine; PNS, posterior nasal spine; A, point A; B, point B; Pog, pogonion; Me, men- ton; Go, gonion; U1E, upper incisor edge; U1A, upper incisor root apex; L1E, lower incisor edge; L1A, lower incisor root apex; Pn, pronasale; Cm, columella; Sn, subnasale; Ls, labrale superius; Li, labrale inferius;
Pog’, soft tissue pogonion. The broken line indicates a skeletal profile diagram with 12 representative land- marks used for comparison in Fig 2.
Age (yrs)
Mongolian Korean
Multiple comparisons* Female (MF)
(n = 39)
Male (MM) (n = 35)
Female (KF) (n = 43)
Male (KM) (n = 52)
Mean 20.62 20.93 24.94 25.37
MF = MM < KF = KM
SD 2.60 2.33 2.09 2.30
Minimum 18.00 18.08 21.50 21.33
Maximum 27.50 27.50 28.00 28.00
Median 19.67 20.17 25.00 25.42
Min, Minimum; Max, maximum; SD, standard deviation. *Bonferroni correction for multiple comparison at the 0.05 Table 2. Age of study subjects according to sex and ethnicity
used in the study are shown in Fig 1 and measured variables are shown in Table 1.
Statistical analysis
The reproducibility of the measurements was as- sessed by comparing measurements taken at least 2 weeks apart of 10 randomly selected cephalograms from each group. The selected cephalograms were re- digitized by the same operator (J-H K). Dahlberg’s for- mula25 was used to determine the method error, which did not exceed 0.86 mm for the linear variables, 0.84o for the angular variables, and 0.14 for the ratio variables.
Descriptive statistics were calculated for each varia- ble, and analysis of covariance (ANCOVA) was per- formed to take into account age differences across the four groups (Mongolian female, Mongolian male, Korean female, Korean male) when comparing cepha- lometric traits between sexes and ethnic groups.
Statistical significance was set at 0.05, and the null hy- potheses of this study were: cephalometric norms of males do not differ from those of females; cephalo- metric norms of Mongolian adults do not differ from those of Korean adults; and there is no interaction be- tween sex and ethnicity.
RESULTS
Seventy-four Mongolian adults (35 men and 39 women) and 95 Korean adults (52 men and 43 wom- en) were selected as subjects for this study. Age char- acteristics of the groups are shown in Table 2.
Mongolian subjects were significantly younger than Korean subjects.
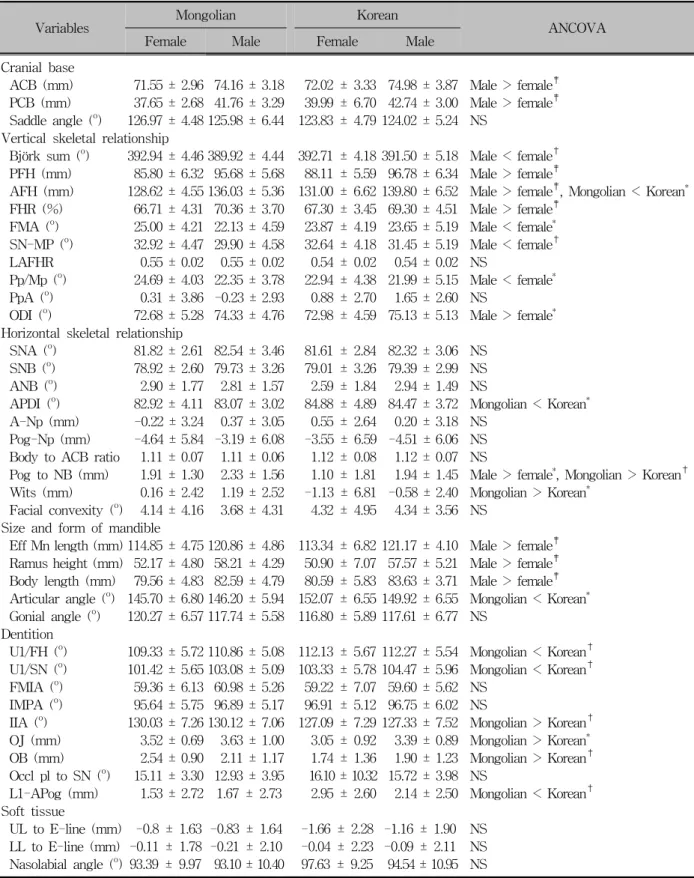
Variables Mongolian Korean
ANCOVA
Female Male Female Male
Cranial base
ACB (mm) 71.55 ± 2.96 74.16 ± 3.18 72.02 ± 3.33 74.98 ± 3.87 Male > female‡ PCB (mm) 37.65 ± 2.68 41.76 ± 3.29 39.99 ± 6.70 42.74 ± 3.00 Male > female‡ Saddle angle (o) 126.97 ± 4.48 125.98 ± 6.44 123.83 ± 4.79 124.02 ± 5.24 NS
Vertical skeletal relationship
Björk sum (o) 392.94 ± 4.46 389.92 ± 4.44 392.71 ± 4.18 391.50 ± 5.18 Male < female† PFH (mm) 85.80 ± 6.32 95.68 ± 5.68 88.11 ± 5.59 96.78 ± 6.34 Male > female‡
AFH (mm) 128.62 ± 4.55 136.03 ± 5.36 131.00 ± 6.62 139.80 ± 6.52 Male > female‡, Mongolian < Korean* FHR (%) 66.71 ± 4.31 70.36 ± 3.70 67.30 ± 3.45 69.30 ± 4.51 Male > female‡
FMA (o) 25.00 ± 4.21 22.13 ± 4.59 23.87 ± 4.19 23.65 ± 5.19 Male < female* SN-MP (o) 32.92 ± 4.47 29.90 ± 4.58 32.64 ± 4.18 31.45 ± 5.19 Male < female† LAFHR 0.55 ± 0.02 0.55 ± 0.02 0.54 ± 0.02 0.54 ± 0.02 NS
Pp/Mp (o) 24.69 ± 4.03 22.35 ± 3.78 22.94 ± 4.38 21.99 ± 5.15 Male < female* PpA (o) 0.31 ± 3.86 -0.23 ± 2.93 0.88 ± 2.70 1.65 ± 2.60 NS
ODI (o) 72.68 ± 5.28 74.33 ± 4.76 72.98 ± 4.59 75.13 ± 5.13 Male > female* Horizontal skeletal relationship
SNA (o) 81.82 ± 2.61 82.54 ± 3.46 81.61 ± 2.84 82.32 ± 3.06 NS SNB (o) 78.92 ± 2.60 79.73 ± 3.26 79.01 ± 3.26 79.39 ± 2.99 NS ANB (o) 2.90 ± 1.77 2.81 ± 1.57 2.59 ± 1.84 2.94 ± 1.49 NS
APDI (o) 82.92 ± 4.11 83.07 ± 3.02 84.88 ± 4.89 84.47 ± 3.72 Mongolian < Korean* A-Np (mm) -0.22 ± 3.24 0.37 ± 3.05 0.55 ± 2.64 0.20 ± 3.18 NS
Pog-Np (mm) -4.64 ± 5.84 -3.19 ± 6.08 -3.55 ± 6.59 -4.51 ± 6.06 NS Body to ACB ratio 1.11 ± 0.07 1.11 ± 0.06 1.12 ± 0.08 1.12 ± 0.07 NS
Pog to NB (mm) 1.91 ± 1.30 2.33 ± 1.56 1.10 ± 1.81 1.94 ± 1.45 Male > female*, Mongolian > Korean† Wits (mm) 0.16 ± 2.42 1.19 ± 2.52 -1.13 ± 6.81 -0.58 ± 2.40 Mongolian > Korean*
Facial convexity (o) 4.14 ± 4.16 3.68 ± 4.31 4.32 ± 4.95 4.34 ± 3.56 NS Size and form of mandible
Eff Mn length (mm) 114.85 ± 4.75 120.86 ± 4.86 113.34 ± 6.82 121.17 ± 4.10 Male > female‡ Ramus height (mm) 52.17 ± 4.80 58.21 ± 4.29 50.90 ± 7.07 57.57 ± 5.21 Male > female‡ Body length (mm) 79.56 ± 4.83 82.59 ± 4.79 80.59 ± 5.83 83.63 ± 3.71 Male > female‡ Articular angle (o) 145.70 ± 6.80 146.20 ± 5.94 152.07 ± 6.55 149.92 ± 6.55 Mongolian < Korean* Gonial angle (o) 120.27 ± 6.57 117.74 ± 5.58 116.80 ± 5.89 117.61 ± 6.77 NS
Dentition
U1/FH (o) 109.33 ± 5.72 110.86 ± 5.08 112.13 ± 5.67 112.27 ± 5.54 Mongolian < Korean† U1/SN (o) 101.42 ± 5.65 103.08 ± 5.09 103.33 ± 5.78 104.47 ± 5.96 Mongolian < Korean† FMIA (o) 59.36 ± 6.13 60.98 ± 5.26 59.22 ± 7.07 59.60 ± 5.62 NS
IMPA (o) 95.64 ± 5.75 96.89 ± 5.17 96.91 ± 5.12 96.75 ± 6.02 NS
IIA (o) 130.03 ± 7.26 130.12 ± 7.06 127.09 ± 7.29 127.33 ± 7.52 Mongolian > Korean† OJ (mm) 3.52 ± 0.69 3.63 ± 1.00 3.05 ± 0.92 3.39 ± 0.89 Mongolian > Korean* OB (mm) 2.54 ± 0.90 2.11 ± 1.17 1.74 ± 1.36 1.90 ± 1.23 Mongolian > Korean† Occl pl to SN (o) 15.11 ± 3.30 12.93 ± 3.95 16.10 ± 10.32 15.72 ± 3.98 NS
L1-APog (mm) 1.53 ± 2.72 1.67 ± 2.73 2.95 ± 2.60 2.14 ± 2.50 Mongolian < Korean† Soft tissue
UL to E-line (mm) -0.8 ± 1.63 -0.83 ± 1.64 -1.66 ± 2.28 -1.16 ± 1.90 NS LL to E-line (mm) -0.11 ± 1.78 -0.21 ± 2.10 -0.04 ± 2.23 -0.09 ± 2.11 NS Nasolabial angle (o) 93.39 ± 9.97 93.10 ± 10.40 97.63 ± 9.25 94.54 ± 10.95 NS
Results are expressed as mean ± standard deviation. NS, Not significant. *p < 0.05; †p < 0.01; ‡p < 0.001.
Table 3. Descriptive statistics and ANCOVA of cephalometric measurements of Mongolian and Korean subjects
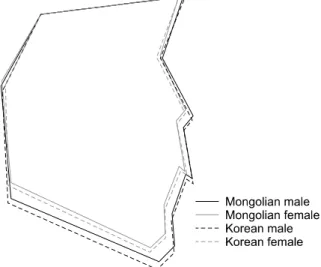
Fig 2. Comparison of skeletal profile diagrams among Mongolian male, Mongolian female, Korean male, and Table 3 shows the cephalometric measurements of the subjects according to sex and ethnicity. Cephalo- metric measurements of the groups were compared by ANCOVA, using age as the covariate. Interactions be- tween sex and ethnicity were not significant for all measurements.
Of the 40 craniofacial measurements, 14 showed significant sexual dimorphism, which primarily re- flected differences in size (anterior and posterior cra- nial base, anterior and posterior facial height, effective mandibular length, ramus height, and mandibular body length) or vertical skeletal relationship (Björk sum, fa- cial height ratio, Frankfort mandibular plane angle, an- terior cranial base-mandibular plane angle, palatal plane to mandibular plane angle, and overbite depth in- dicator). Female subjects exhibited a more vertical skeletal pattern, but no differences were observed in dental or soft tissue measures (Table 3).
Comparison of the two ethnic groups showed that Mongolian subjects had shorter anterior facial height (AFH, p < 0.05) with decreased articular angle (p < 0.05) and increased Pog-NB line distance (p < 0.01) compared with Korean subjects. In the dentition, Mongolian subjects exhibited less proclination of the upper incisors (smaller U1/FH and U1/SN angle, p < 0.01), larger interincisal angle (p < 0.01), and larger overjet (p < 0.05) and overbite (p < 0.01) than
Korean subjects. No differences were seen in soft tissue measurements between Mongolian and Korean sub- jects.
The skeletal profile diagrams were constructed ac- cording to ethnicity and sex, and superimposed images were registered on the sella point and oriented on the sella-nasion line (Fig 2).
DISCUSSION
In this study, we established cephalometric norms by evaluating untreated Mongolian and Korean subjects with normal occlusions and well-balanced lateral pro- files. We chose inclusion criteria and methodology to identify normative values for diagnosis and treatment planning for Mongolian and Korean adults seeking or- thodontic treatment or orthognathic surgery. Previous studies of Korean cephalometric norms16,18 focused pri- marily on good occlusion rather than balanced faces.
With an increasing awareness of esthetic dentistry, a norm based on esthetically pleasing faces would be useful. On the other hand, skeletal variations may exist in subjects with a Class I molar relationship.26,27 For this reason, the present study included a subsample of subjects who were judged to have well-balanced profiles.
Reducing selection bias is important when establish- ing population norms. For this study, untreated uni- versity students were selected to obtain a representative sample of normal Mongolian and Korean non-growing adults, whereas other studies5,13 used records of in- dividuals who sought orthodontic treatment, which risks introducing selection bias. Sample selection used primarily objective criteria such as Angle classification, proper overbite and overjet, lack of crowding, spacing, and excessive restoration. Orthodontists from each eth- nic background examined the facial profile, which was the only subjective criterion, and the subjects were se- lected by consensus of the examiners. Positions of the upper and lower lip relative to Ricketts’ E-line were evaluated to support the selection criteria.
Among ethnic comparison studies, some studies7,9,17 analyzed more than one ethnic group at a time, but many others measured only one ethnic group and com-
studies, which may cause problems due to differences in sample selection, landmark definition, and potential inter-observer error. In this study, we obtained data from both the Mongolian and Korean subjects, and one investigator digitized both groups of cephalograms si- multaneously to reduce selection and measurement biases.
Ethnic homogeneity was achieved by selecting the sample of Korean/Mongolian ancestry. The Ethnic Homogeneity Index1) for Korea and Mongolia has been reported to be 1.00 and 0.69, respectively,28 reflecting a high degree of homogeneity. The Korean population shares facial features that are distinct, even from those of other Asian groups. The Korean subjects in this study originated from different cities in Korea, but all were of Korean ancestry. The Mongolian population can be divided into four groups; the Khalkha Mongols make up the majority of modern Mongolians.21 All Mongolian subjects in this study had Khalkha Mongol family names.
The cephalometric measurement data were separated according to sex and ethnicity to obtain specific and useful cephalometric normative values. Because of the significant difference in the mean age among the groups, ANCOVA was performed using age as the covariable.
Sexual dimorphism was found to be significant, es- pecially for skeletal linear measurements and vertical skeletal relationships (Table 3). Along with the ex- pected differences in skeletal linear measurements, women showed more vertical patterns in most vertical angular measurements. Among intergender comparisons in other ethnic studies, some7,12 reported no significant differences between men and women; however, Miyaji- ma et al.9 reported that Japanese women had more ver- tically oriented facial axis angles and mandibular plane angles, which is consistent with our results.
In the present study, no statistically significant sex- ual dimorphism was detected in dental and soft tissue measurements. This result supports the findings of Miyajima et al.9 and Basciftci et al.,10 who did not find dental or soft tissue sexual dimorphisms in Japanese and Anatolian Turkish adults. However, in the sophisti- 1) Ethnic Homogeneity Index = ∑(fraction of ethnic group)2
cated soft tissue measurements by Hwang et al.,17 Korean subjects showed sexual dimorphism in the nose, lower lip, and mentolabial sulcus area. We per- formed only three soft tissue measurements in our study, which may explain, at least in part, why no dif- ferences were found.
Our results showed that cranial base length of the Mongolian subjects was similar to that of the Korean subjects, but the AFH was shorter in the Mongolian subjects. The mean differences in AFH were 3.77 mm in men and 2.38 mm in women, which was the most obvious difference between the two ethnic groups.
Most variables reflecting mandible size did not differ significantly, but the chin was more prominent in Mongolian subjects. The Wits appraisal value, which is affected by the cant of occlusal plane,29 was larger in Mongolian subjects. Along with genetic factors, vari- ous environmental factors like mastication stress can influence the occlusal plane as well as facial types and growth patterns,30 but the clinical significance of these differences may not be great.
Previous studies that compared cephalometric fea- tures of Caucasian populations with Asians8,9,16 or with African Americans11 reported the greatest racial differ- ences in the soft tissue profile and dentoalveolar pro- trusion, concluding that the convexity and the inter- incisal angle are characteristic of each race. Few stud- ies have compared two or more ethnic groups of the same race. Despite differences in sample selection cri- teria and measurements, multicenter studies by Trenouth et al.31 and el-Batouti et al.5 demonstrated that differences exist within Caucasian populations. In this study, which compared the cephalometric features between two Asian ethnic groups, soft tissue measure- ments did not differ significantly between the two eth- nic groups, but differences in dentition variables were observed. Upper incisors were more proclined in Korean subjects, which may affect the interincisal angle. However, the mean differences in the U1/SN angle (1.39o in men and 1.91o in women) were smaller, with limited clinical significance, compared with differ- ences reported by studies comparing Asian and Caucasian populations.9,16,32 The mandibular incisor plane angle was similar in both groups, but the L1- APog distance was smaller in Mongolian subjects, who
have more prominent chins, as reflected by the Pog to NB variable.
The observed differences between the two groups in this study may reflect differences in the populations from which they were drawn. Although all subjects were Asian, it is possible that there were ethnic differ- ences, as there are two recognized subgroups, North Asians and South Asians. It is possible that the pop- ulations of Mongolia and Korea differ in the pro- portion of these two subgroups, which could therefore account for the observed morphologic differences.
Studies20,21 of genetic markers showed that Koreans tend to have a close genetic affinity with Mongolians among East Asians. However, more recent surveys22-24 of Y-chromosomal DNA variation have revealed that the Korean population contains lineages typical of both southern and northern East Asian populations.
The perception of facial esthetics differs by culture, individuals within the culture, and with time.33 In a study by Ko et al.,34 the same ethnic groups with different cultural background showed statistically different preferences when judging esthetic profiles.
Therefore, our sample selection procedure may have influenced the results. Despite the possible ethnic differences, the small differences between the two groups suggest that these results should be interpreted carefully.
The results of this study have clinical implications for the diagnosis and treatment planning of adult Mongolian patients. Features of Mongolian adults were very similar to those of Korean adults. Significant dif- ferences were detected only in relation to vertical fa- cial height, chin prominence, and inclination of upper incisors. However, the clinical importance of these dif- ferences may be limited regarding the diagnosis and treatment planning of Mongolian and Korean adults.
CONCLUSION
In the present study, we established cephalometric norms for male and female Mongolian adults with nor- mal occlusions and well-balanced lateral profiles.
Sexual dimorphism was found in skeletal linear meas- urements and vertical skeletal relationships. Mongolian
more upright upper incisors than Korean adults, but few differences were observed in the soft tissue measurements. Because of limited clinical significance in differences between the two ethnic groups, similar diagnosis and treatment planning are feasible for Mongolian and Korean patients seeking orthodontic treatment or orthognathic surgery.
- 국문초록 -
조화로운 측모를 가진 몽골인과 한국인 성인 정상교합자의 측모두부계측방사선학적 비교 연구
김지환ㆍOdontuya GansukhㆍBazar Amarsaikhan 이신재ㆍ김태우
현재까지 몽골인의 측모두부계측방사선학적 기준치가 문 헌 상으로 보고된 바가 없었던 바, 본 연구의 목적은 정상교 합과 조화로운 측모를 가진 몽골인을 선별하여 측모두부계 측방사선학적 기준치를 제시하고, 이를 같은 기준으로 선별 한 한국인의 기준치와 비교하는 것이다. 조화로운 측모를 가 진 74명의 몽골인(남자 35명, 여자 39명)과 95명의 한국인 (남자 52명, 여자 43명) 성인 정상교합자들의 측모두부계측 방사선 사진을 채득하였다. 이들은 해당 민족과 국적의 교정 의사들의 평가로 선별되었다. 40개의 계측치에 대하여 민족 별, 성별 평균 및 표준편차를 산출한 후, 그 차이를 ananl- ysis of covariance (ANCOVA)로 검정하였다. 조화로운 측모 를 가진 몽골인과 한국인 남녀 성인 정상교합자의 측모두부 방사선학적 기준치를 얻었다. 골격성 선 계측치와 수직적 골 격 관계에서 성별 간의 유의한 차이가 나타났다. 몽골인은 한국인에 비하여 짧은 전안면 고경, 돌출된 이부, 설측경사 된 상악 전치를 나타내었으나, 대부분의 계측치 간 평균 차 이가 적어 임상적 의미는 적었다. 몽골인과 한국인 성인 환 자의 교정치료를 위한 진단과 치료계획 시에 유사한 기준을 적용할 수 있을 것이라고 생각되었다.
주요 단어: 측모두부계측방사선학, 인종별 기준치
REFERENCES
1. Downs WB. Variations in facial relationships; their signifi- cance in treatment and prognosis. Am J Orthod 1948;34:
812-40.
2. Steiner CC. Cephalometrics for you and me. Am J Orthod 1953;39:729-55.
orthodontic diagnosis, treatment planning and prognosis. Angle Orthod 1954;24:121-69.
4. Ricketts RM. Planning treatment on the basis of the facial pat- terns and an estimate of its growth. Angle Orthod 1957;27:
14-37.
5. el-Batouti A, Ogaard B, Bishara SE. Longitudinal cephalo- metric standards for Norwegians between the ages of 6 and 18 years. Eur J Orthod 1994;16:501-9.
6. Cotton WN, Takano WS, Wong WM. The Downs analysis ap- plied to three other ethnic groups. Angle Orthod 1951;21:
213-20.
7. Cooke MS, Wei SH. A comparative study of southern Chinese and British Caucasian cephalometric standards. Angle Orthod 1989;59:131-8.
8. Wu J, Hägg U, Rabie AB. Chinese norms of McNamara's cephalometric analysis. Angle Orthod 2007;77:12-20.
9. Miyajima K, McNamara JA Jr, Kimura T, Murata S, Iizuka T.
Craniofacial structure of Japanese and European-American adults with normal occlusions and well-balanced faces. Am J Orthod Dentofacial Orthop 1996;110:431-8.
10. Basciftci FA, Uysal T, Buyukerkmen A. Craniofacial structure of Anatolian Turkish adults with normal occlusions and well-balanced faces. Am J Orthod Dentofacial Orthop 2004;
125:366-72.
11. Huang WJ, Taylor RW, Dasanayake AP. Determining cephalo- metric norms for Caucasians and African Americans in Birmingham. Angle Orthod 1998;68:503-11.
12. Hamdan AM, Rock WP. Cephalometric norms in an Arabic population. J Orthod 2001;28:297-300.
13. Yeong P, Huggare J. Morphology of Singapore chinese. Eur J Orthod 2004;26:605-12.
14. Yang WS. A roentgenocephalometric study of the linear analy- ses in normal occlusion for Korean. Korean J Orthod 1974;
4:7-12.
15. Lee KS, Chung KR. A cephalometric analysis of Korean adult normal occlusion. Korean J Orthod 1987;17:199-214.
16. Park IC, Bowman D, Klapper L. A cephalometric study of Korean adults. Am J Orthod Dentofacial Orthop 1989;96:54-9.
17. Hwang HS, Kim WS, McNamara JA Jr. Ethnic differences in the soft tissue profile of Korean and European-American adults with normal occlusions and well-balanced faces. Angle Orthod 2002;72:72-80.
18. Malocclusion Report Publication Committee of KAO. The re- port of cephalometric measurement study of Korean adults with normal occlusion. 1997. p. 1-17.
19. Georg S, Michalove PA, Ramer AM, Sidwell PJ. Telling gen- eral linguists about Altaic. J Linguistics 1999;35:65-98.
20. Saha N, Tay JS. Origin of the Koreans: a population genetic study. Am J Phys Anthropol 1992;88:27-36.
21. Chimge NO, Batsuuri J. Interethnic genetic differentiation:
HLA class I antigens in the population of Mongolia. Am J Hum Biol 1999;11:603-18.
22. Kim W, Shin DJ, Harihara S, Kim YJ. Y chromosomal DNA variation in east Asian populations and its potential for infer- ring the peopling of Korea. J Hum Genet 2000;45:76-83.
23. Karafet T, Xu L, Du R, Wang W, Feng S, Wells RS, et al.
Paternal population history of East Asia: sources, patterns, and microevolutionary processes. Am J Hum Genet 2001;69:
615-28.
24. Jin HJ, Kwak KD, Hammer MF, Nakahori Y, Shinka T, Lee JW, et al. Y-chromosomal DNA haplogroups and their im- plications for the dual origins of the Koreans. Hum Genet 2003;114:27-35.
25. Dahlberg G. Statistical methods for medical and biological students. London: George Allen and Unwin Ltd.; 1940.
26. Casko JS, Shepherd WB. Dental and skeletal variation within the range of normal. Angle Orthod 1984;54:5-17.
27. Kim JY, Lee SJ, Kim TW, Nahm DS, Chang YI. Classifica- tion of the skeletal variation in normal occlusion. Angle Orthod 2005;75:311-9.
28. Goldstone JA, Gurr TA, Harff B, Levy MA, Marshall MG, Bates RH, et al. State Failure Task Force Report: Phase III Findings. McLean, VA: Science Applications International Corporation 2000. (Available at: http://globalpolicy.gmu.edu/
pitf/. Accessed June 21, 2010)
29. Del Santo M Jr. Influence of occlusal plane inclination on ANB and Wits assessments of anteroposterior jaw relation- ships. Am J Orthod Dentofacial Orthop 2006;129:641-8.
30. King L, Harris EF, Tolley EA. Heritability of cephalometric and occlusal variables as assessed from siblings with overt malocclusions. Am J Orthod Dentofacial Orthop 1993;104:
121-31.
31. Trenouth MJ, Davies PH, Johnson JS. A statistical comparison of three sets of normative data from which to derive standards for craniofacial measurement. Eur J Orthod 1985;7:193-200.
32. Alcalde RE, Jinno T, Pogrel MA, Matsumura T. Cephalomet- ric norms in Japanese adults. J Oral Maxillofac Surg 1998;
56:129-34.
33. Pogrel MA. What are normal esthetic values? J Oral Maxillo- fac Surg 1991;49:963-9.
34. Ko SJ, Kim HS, Kim YJ. The influence of gender or culture on determining esthetic facial profile. Korean J Orthod 2001;
31:301-9.