An Analysis on Health-Related Difference according to Socio-economic Class in Our Country
6)Kyung-Soo Lee1, Gyeong-Tae Lim2, Hee-Tae Chung3*
1Department. of Health&Medical Administration, GyeongNam Provincial Geochang College
2Department of Medical Information, Hyechon University
3*Department of Health Administration, Namseoul University
(Received September 26, 2013 : Revised October 15, 2013 : Accepted October 29, 2013) Abstract
Purpose. The purpose of this study is to analyze difference in quality of life related to health according to our country's social stratification.
Methods. This study had analytical subjects as 7,992 adults(4,557 men, 3,435 women), who are included in a variable by social stratification among 15,691 people in the age group of 20~69 years old as examinees, based on the 4th Korea National Health and Nutrition Examination Survey.
Results. This study obtained the following results.
First, seeing the score of health-related life quality by social stratification, namely, the distribution of EQ-5D index, the new middle class(class Ⅱ) was the highest(men with 0.966 point, women with 0.955 point). The agricultural self-employed class(class Ⅴ) was indicated to be the lowest(men with 0.918 point, women with 0.866 point).
In general, the more belonging to low social stratification led to having shown the lower aspect in EQ-5D index value.
Second, as for the results of the hierarchical regression analysis, the factors of contributing to difference by social stratification in health-related quality of life were chronic disease, job stress, education, and income level in both men and women. The health behavior was grasped to be a factor of contributing only to women.
Conclusions. To reduce difference in health-related quality of life according to social stratification in the future, the continuous investment is needed for supporting socially high-quality education and economic stability. The sphere of health will need to be given priority to the prevention of chronic disease and the development in effective management policy for the lower classes.
Key words : Korea National Health and Nutrition, EQ-5D index, Examination Survey, Quality of life, Social stratification
* Corresponding Author : [email protected]
I. Introduction
Health inequality caused by socioeconomic difference is the phenomenon that is contrary to the ideology dubbed 'Health For All' by World Health Organization. Main advanced countries are establishing key goal in the national health objective as the solution of health inequality along with the enhancement in health level1).
Even terminology called social stratification is being used as a meaning of population group, which is differentiated socioeconomic characteristic. Generally, the researches related to social class and health status are adopting education, job and income as the objective data of socioeconomic hierarchy2). The most reliable single index, which reflects general hierarchy out of this, is being applied to many researches of inequality as job variable. This is because job has inter- relationship with other factors of deciding on rank such as income, education, property and position and also because the majority of people are recognizing that job is 'functionally important social role' that people perform in society3).
Inequality and difference in health level according to gap in socioeconomic level of population group have been performed an active research in the advanced countries. A fact was ever clarified4) that considerable inequality exists in death and disease by social stratification, which was classified focusing on job, education and income, through the first Whitehall research, which was begun in 1967, Black Report in 1980, the second Whitehall research in 1992, and a research of ‘Work Group on socioeconomic health inequality in Europe’ that carried out a comparative study on many countries in
Europe.
Even in our country, an interest in socioeconomic inequality in each sector of society is growing due to social polarization according to economic crisis at the end of the 1990s. An interest in the issue of inequality among social classes in the healthcare field is also increasing these days. The existing domestic researches on health inequality among social classes include a study by
5)Kim Min-gyeong et al.(2010), which analyzed difference in subjective health level according to socioeconomic position of adults aged 20-64 by using data of the Korea National Health and Nutrition Examination Survey, and the findings by 6)Yun Tae-ho (2003), which showed difference in mortality according to social stratification even in South Korea same as the advanced foreign countries.
A research by 7)Kim Chang-yeop(2004), which suggested difference in general health level and health behavior by social stratification, and a research by 4)Kim Hye-ryeon(2007), which investigated into inequality and change trend by social stratification in smoking rate also presented a basis of health inequality structure in Korean society.
Domestic researches on health inequality according to socioeconomic level have been evaluated death, chronic diseases preva- lence, subjective perception on health status, and health behavior as health index.
However, there was no research that had examined difference among social classes in index of health-related quality of life, which is one of comprehensive index in health level.
As the health-related quality of life is the word of implying quality of life, which is influenced by health level or disease level, it is involving extensive and multilateral
concept of embracing physical, social and emotional happiness on daily life or subjective experience8). In other words, the health-related quality of life shows a component of life quality, which has direct influence upon an individual's physical, psychological and mental health, as well as general well-being9). The reason that the health-related quality of life was highlighted is because patient's feeling and evaluation on own health came to be important, rather than improvement in opinion of patho- logical disease as the evaluation of medical result as the focus of medical treatment is changed to prevention and management from treatment of disease10).
Accordingly, this study aims to measure difference in health-related quality of life according to social stratification and to grasp factors of contributing to its difference by using data of the Korea National Health and Nutrition Examination Survey.
2. Purpose of research
The specific objectives of this study are as follows.
First, it analyzes health-related quality of life according to social stratification.
Second, it analyzes factors of describing difference in health-related quality of life according to social stratification.
3. Research subjects and method
3.1. Research subjects and data
Data of this study were used the Korea National Health and Nutrition Examination Survey as the raw data.
The age group in 20~69 years old of
having been included in the subjects of this study stood at 15,691 people. The number of people who were included from model I to model Ⅵ by social stratification stood at 8,356 people. It had final analytical subjects as 7,992 people(4,557 men, 3,435 women) except missing in a case of having no value of health-related quality of life and in general characteristics.
3.2. Variable and definition
3.2.1. Appearance of chronic disease
Chronic-disease variable was set for 9 diseases based on the findings by 11)Gil Seon-ryeong et al.(2008).
Diseases of significantly reducing health- related quality of life in the Korea National Health and Nutrition Examination Survey for 2005 were reported osteoarthritis, Rh- eumatoid arthritis, Osteoporosis, Herniated Nucleus Pulposus, apoplexy, and asthma in case of men, and osteoarthritis, Rheumatoid arthritis, Osteoporosis, Herniated Nucleus Pulposus, peptic ulcer, cataract, and joint disease in case of women. Even this study used these 9 diseases as chronic-disease variables.
3.2.2. Classification of social stratification
Social-class variable was applied the classification of social stratification, which had been used in a study by 5)Kim Min- gyeong et al.(2010). Social stratification was classified into 6 classes in the Korea National Health and Nutrition Examination Survey.
As the high and upper & middle class(class
Ⅰ) corresponds to self-employed, employer, and regular employee as for the position in
light of occupation while being high-ranking executive and expert, it is a case of belonging to the high-ranking occupational cluster regardless of the position in light of occupation. The middle class is divided into new middle class(class Ⅱ) and old middle class(class Ⅲ). The new middle class implies people from employer to daily employed worker in the position in light of occupation as technician and clerk of engaging in brain labor. The old middle class was classified into a case of self-employed while being service
& sales worker, technician and relevant technician, and device machine operator.
Labor class(class Ⅳ) includes regular employee or temporary-daily employee as service and sales worker. The agricultural self-employed(class Ⅴ) was classified into a case of being self-employed while engaging in agriculture and fishery. The lower class(class Ⅵ) was classified into employee or simple laborer among people of engaging in agriculture and fishery.
3.2.3. Health-related quality of life
As EQ-5D is a tool that was developed by Euroqol Group with the aim of evaluation, it is composed of five dimensions in mobility, self-care, usual activities, pain/discomfort, anxiety/depression, and is composed of 3 stages in ‘having nothing at all,’ ‘having a little problem,’ and ‘having serious problem.’
EQ-5D index comes to be obtained by applying a weighted value to each of measure- ment value in item as for these five dimensions. The range of the value is distributed from point 1, which implies perfect health status, to point -1, which is health status of being worse than death. This study calculated health-related quality of life
by using a weighted value of quality in a survey tool(EQ-5D) for quality of life into which researched12).
3.3. Analytical method of data
Analysis of data was used SPSSWIN(Ver.
18.0). The analytical process of data is as follows.
First, to grasp the distribution of social stratification by gender and by age in survey subjects and the score for health-related quality of life, the descriptive analysis was carried out.
Second, t-test or analysis of variance was used in the comparison of score for health-related quality of life according to socio-demographic characteristic, health- behavior characteristic, and chronic disease by gender in research subjects.
Third, to examine whether there is difference in health-related quality of life according to gender, age, and social class in research subjects, the analysis of variance was carried out. Also, Tukey's Multiple Comparison was carried out in case of having significant difference.
Fourth, to grasp the influence of the difference and contributional factor in health-related quality of life, which is dependent variable, the hierarchical multiple regression analysis of including significant independent variables in the above univariate analysis was carried out. The independent variable was classified into socio-demographic factor, health-behavior factor, and chronic-disease factor. Thus, R2 variation was understood. The aim was to grasp the influence of variable, which was added to each model, upon health-related quality of life according to model Ⅰ, which
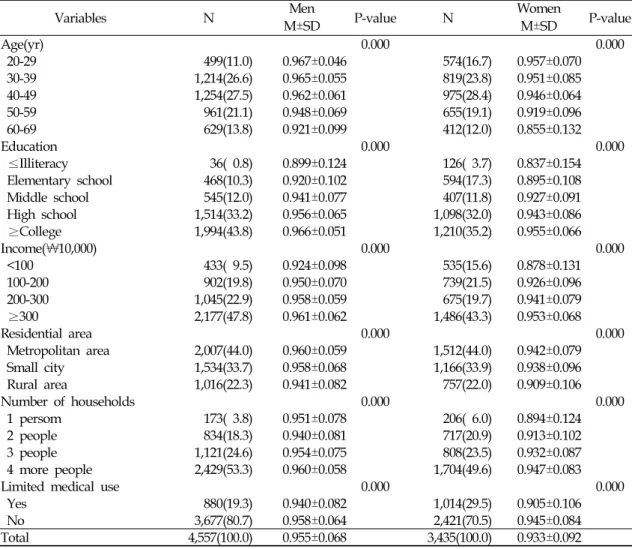
Variables N Men
P-value N Women
P-value
M±SD M±SD
Age(yr) 0.000 0.000
20-29 499(11.0) 0.967±0.046 574(16.7) 0.957±0.070
30-39 1,214(26.6) 0.965±0.055 819(23.8) 0.951±0.085
40-49 1,254(27.5) 0.962±0.061 975(28.4) 0.946±0.064
50-59 961(21.1) 0.948±0.069 655(19.1) 0.919±0.096
60-69 629(13.8) 0.921±0.099 412(12.0) 0.855±0.132
Education 0.000 0.000
≤Illiteracy 36( 0.8) 0.899±0.124 126( 3.7) 0.837±0.154
Elementary school 468(10.3) 0.920±0.102 594(17.3) 0.895±0.108
Middle school 545(12.0) 0.941±0.077 407(11.8) 0.927±0.091
High school 1,514(33.2) 0.956±0.065 1,098(32.0) 0.943±0.086
≥College 1,994(43.8) 0.966±0.051 1,210(35.2) 0.955±0.066
Income(₩10,000) 0.000 0.000
<100 433( 9.5) 0.924±0.098 535(15.6) 0.878±0.131
100-200 902(19.8) 0.950±0.070 739(21.5) 0.926±0.096
200-300 1,045(22.9) 0.958±0.059 675(19.7) 0.941±0.079
≥300 2,177(47.8) 0.961±0.062 1,486(43.3) 0.953±0.068
Residential area 0.000 0.000
Metropolitan area 2,007(44.0) 0.960±0.059 1,512(44.0) 0.942±0.079
Small city 1,534(33.7) 0.958±0.068 1,166(33.9) 0.938±0.096
Rural area 1,016(22.3) 0.941±0.082 757(22.0) 0.909±0.106
Number of households 0.000 0.000
1 persom 173( 3.8) 0.951±0.078 206( 6.0) 0.894±0.124
2 people 834(18.3) 0.940±0.081 717(20.9) 0.913±0.102
3 people 1,121(24.6) 0.954±0.075 808(23.5) 0.932±0.087
4 more people 2,429(53.3) 0.960±0.058 1,704(49.6) 0.947±0.083
Limited medical use 0.000 0.000
Yes 880(19.3) 0.940±0.082 1,014(29.5) 0.905±0.106
No 3,677(80.7) 0.958±0.064 2,421(70.5) 0.945±0.084
Total 4,557(100.0) 0.955±0.068 3,435(100.0) 0.933±0.092
Table 1. Mean value of EQ-5D index by general characteristics modified age at this time, model Ⅱ, which
modified health behavior additionally, model
Ⅲ, which additionally modified general stress, model Ⅳ, which additionally modified chronic disease, model Ⅴ, which additionally modified educational level, and model Ⅵ, which additionally modified income level.
4. Results
4.1. Health-related quality level of life by general characteristic
It examined whether there is difference in score for health-related quality of life as for general & socio-demographic characteristics
(gender, age, educational level, income level, residential area, number of family members, medical-care limitation).
By gender, men(0.955±0.068)'s score for health-related quality of life was higher (P<0.001)than women(0.933±0.092). Score for health-related quality of life in each was statistically higher significantly in the lower age by age, in the higher academic backg- round as for educational level, in the more income, in residents of special city and metropolitan city compared to other local residents as for residential area, in a case of being more than 4 family members, and in a case of having no medical-care limitation compared to having the limitation(Table 1).
Variables N Men
P-value N Women
P-value
M±SD M±SD
Smoking 0.237 0.077
Non-smoker 802(17.6) 0.958±0.061 3,025(88.1) 0.934±0.091
Ex-smoker 1,551(34.0) 0.953±0.064 162( 4.7) 0.941±0.077
Current-smoker 2,204(48.4) 0.955±0.073 248( 7.2) 0.921±0.115
Drinking 0.000 0.000
Non-drinker 546(12.0) 0.943±0.089 926(27.0) 0.920±0.098
Suitable-drinker 2,140(47.0) 0.959±0.066 2,107(61.3) 0.941±0.080
Problem-drinker 1,871(41.1) 0.953±0.062 402(11.7) 0.925±0.128
Walking 0.135 0.956
No 2,418(53.1) 0.956±0.071 1,808(52.6) 0.933±0.093
Yes 2,139(46.9) 0.953±0.065 1,627(47.4) 0.933±0.092
Sleeping 0.000 0.000
7-8hrs 2,406(52.8) 0.959±0.059 1,836(53.4) 0.944±0.080
<7 or>,8hrs 2,151(47.2) 0.950±0.077 1,599(46.6) 0.921±0.104
BMI 0.943 0.000
<18.5 102( 2.2) 0.955±0.059 216( 6.3) 0.952±0.062
18.5-25.0 2,703(59.3) 0.954±0.068 2,325(67.7) 0.939±0.084
25.0< 1,752(38.4) 0.955±0.069 894(26.0) 0.914±0.114
Job stress 0.000 0.000
Yes 2,383(52.3) 0.948±0.071 1.582(46.1) 0.914±0.112
No 2,174(47.7) 0.963±0.064 1,853(53.9) 0.950±0.068
Total 4,557(100.0) 0.955±0.068 3,435(100.0) 0.933±0.092
Table 2. Mean value of EQ-5D index by health behavior 4.2. Health-related quality level of life by
health behavior
Examining score for health-related quality of life according to health behavior, both men and women had no significant difference in score for quality of life among smoking group. past-smoking group, and non-smoking group. In the drinking sphere, both men and women were the highest in score for health-related quality of life in group with 'moderate drinking,' and showed statistically significant difference. In the sphere of walking exercise, both men and women had no significant difference in score for health-related quality of life between group with practice and group with non-practice. In the sleeping sphere, both men and women were statistically higher significantly in score for health-related quality of life in group with normal sleeping for '7-8 hours' compared to the
remaining groups. In the sphere of BMI, men had no significant difference in score for health-related quality of life among 'low-weight group,' normal-weight group,' and 'overweight group.' However, women were statistically high significantly in score for health-related quality of life in 'low-weight group.' In the sphere of job stress, both men and women were statistically high significantly in score for health-related quality of life in group of 'not feeling(Table 2).
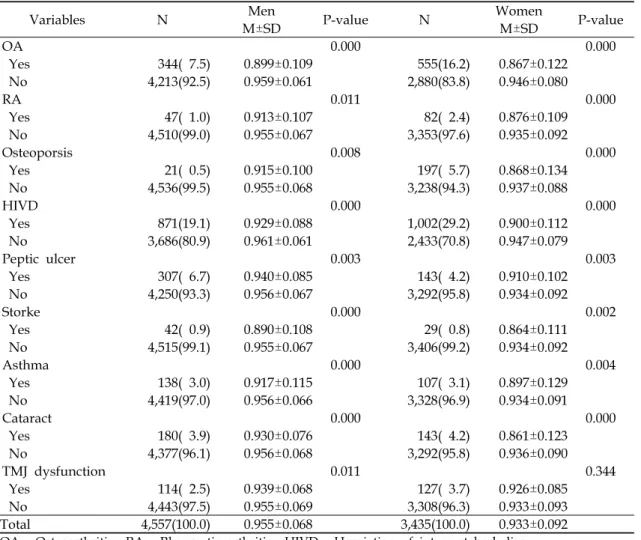
4.3. Health-related quality level of life by chronic disease
Seeing distribution in score for health- related quality of life by chronic disease, both men and women were statistically higher significantly in health-related quality of life for each in the group with non-prevalence of Osteoarthritis, Rheumatoid arthritis, Herniated
Variables N Men
P-value N Women
P-value
M±SD M±SD
OA 0.000 0.000
Yes 344( 7.5) 0.899±0.109 555(16.2) 0.867±0.122
No 4,213(92.5) 0.959±0.061 2,880(83.8) 0.946±0.080
RA 0.011 0.000
Yes 47( 1.0) 0.913±0.107 82( 2.4) 0.876±0.109
No 4,510(99.0) 0.955±0.067 3,353(97.6) 0.935±0.092
Osteoporsis 0.008 0.000
Yes 21( 0.5) 0.915±0.100 197( 5.7) 0.868±0.134
No 4,536(99.5) 0.955±0.068 3,238(94.3) 0.937±0.088
HIVD 0.000 0.000
Yes 871(19.1) 0.929±0.088 1,002(29.2) 0.900±0.112
No 3,686(80.9) 0.961±0.061 2,433(70.8) 0.947±0.079
Peptic ulcer 0.003 0.003
Yes 307( 6.7) 0.940±0.085 143( 4.2) 0.910±0.102
No 4,250(93.3) 0.956±0.067 3,292(95.8) 0.934±0.092
Storke 0.000 0.002
Yes 42( 0.9) 0.890±0.108 29( 0.8) 0.864±0.111
No 4,515(99.1) 0.955±0.067 3,406(99.2) 0.934±0.092
Asthma 0.000 0.004
Yes 138( 3.0) 0.917±0.115 107( 3.1) 0.897±0.129
No 4,419(97.0) 0.956±0.066 3,328(96.9) 0.934±0.091
Cataract 0.000 0.000
Yes 180( 3.9) 0.930±0.076 143( 4.2) 0.861±0.123
No 4,377(96.1) 0.956±0.068 3,292(95.8) 0.936±0.090
TMJ dysfunction 0.011 0.344
Yes 114( 2.5) 0.939±0.068 127( 3.7) 0.926±0.085
No 4,443(97.5) 0.955±0.069 3,308(96.3) 0.933±0.093
Total 4,557(100.0) 0.955±0.068 3,435(100.0) 0.933±0.092
OA : Osteoarthritis RA : Rheumatic arthritis HIVD : Herniation of intervertebral disc TMJ dysfuction : Temporo-mandibular joint dysfuntion
Table 3. Mean value of EQ-5D index by chronic diseases
Nucleus Pulposus, Peptic ulcer, apoplexy, asthma, and cataract, compared to the group with prevalence. As for joint disease, only men were statistically higher significantly in score for health-related quality of life in group with non-prevalence compared to group with prevalence. There was no significant differ- ence in women(Table 3).
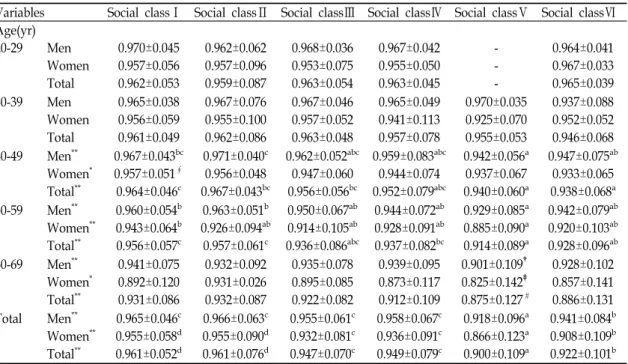
4.4. Distribution in health-related quality level of life among social classes
It examined distribution in score for health-related quality of life among social classes. Analysis of variance was carried out in order to examine whether there is
difference in score for health-related quality of life among social classes by dividing research subjects by age and by gender. As a result, there was no difference among social classes in both men and women in case of being their 20s and 30s. On the other hand, both men and women were indicated to have significant difference among social classes in their 40s, 50s, and 60s(p<0.05).
Also, to examine difference by social stratification in case of having significant difference among social classes, Tukey's multiple comparative analysis was carried out as post-test. As a result, in case of the whole men, EQ-5D index of the agricultural
Variables Social classⅠ Social classⅡ Social classⅢ Social classⅣ Social classⅤ Social classⅥ Age(yr)
20-29 Men 0.970±0.045 0.962±0.062 0.968±0.036 0.967±0.042 - 0.964±0.041 Women 0.957±0.056 0.957±0.096 0.953±0.075 0.955±0.050 - 0.967±0.033 Total 0.962±0.053 0.959±0.087 0.963±0.054 0.963±0.045 - 0.965±0.039 30-39 Men 0.965±0.038 0.967±0.076 0.967±0.046 0.965±0.049 0.970±0.035 0.937±0.088 Women 0.956±0.059 0.955±0.100 0.957±0.052 0.941±0.113 0.925±0.070 0.952±0.052 Total 0.961±0.049 0.962±0.086 0.963±0.048 0.957±0.078 0.955±0.053 0.946±0.068 40-49 Men** 0.967±0.043bc 0.971±0.040c 0.962±0.052abc 0.959±0.083abc 0.942±0.056a 0.947±0.075ab
Women* 0.957±0.051∮ 0.956±0.048 0.947±0.060 0.944±0.074 0.937±0.067 0.933±0.065 Total** 0.964±0.046c 0.967±0.043bc 0.956±0.056bc 0.952±0.079abc 0.940±0.060a 0.938±0.068a 50-59 Men** 0.960±0.054b 0.963±0.051b 0.950±0.067ab 0.944±0.072ab 0.929±0.085a 0.942±0.079ab Women** 0.943±0.064b 0.926±0.094ab 0.914±0.105ab 0.928±0.091ab 0.885±0.090a 0.920±0.103ab Total** 0.956±0.057c 0.957±0.061c 0.936±0.086abc 0.937±0.082bc 0.914±0.089a 0.928±0.096ab 60-69 Men** 0.941±0.075 0.932±0.092 0.935±0.078 0.939±0.095 0.901±0.109† 0.928±0.102
Women* 0.892±0.120 0.931±0.026 0.895±0.085 0.873±0.117 0.825±0.142‡ 0.857±0.141 Total** 0.931±0.086 0.932±0.087 0.922±0.082 0.912±0.109 0.875±0.127# 0.886±0.131 Total Men** 0.965±0.046c 0.966±0.063c 0.955±0.061c 0.958±0.067c 0.918±0.096a 0.941±0.084b
Women** 0.955±0.058d 0.955±0.090d 0.932±0.081c 0.936±0.091c 0.866±0.123a 0.908±0.109b Total** 0.961±0.052d 0.961±0.076d 0.947±0.070c 0.949±0.079c 0.900±0.109a 0.922±0.101b
*p<0.05, **p<0.01 by ANOVA to test the relationship between social class and EQ-5D index in each strata.
The footnotes below show the results of pairwise comparison by Tukey test
a, b, c, dif a pair does not share any footnote, both groups are significantly different in EQ-5D index (p<0.05)
∮significantly different to class Ⅵ (p<0.05)
†significantly different to class Ⅲ, Ⅳ(p<0.05)
‡significantly different to class Ⅲ (p<0.05)
#significantly different to class Ⅰ,Ⅲ, Ⅳ (p<0.05)
Table 4. Comparison of EQ-5D index by social class in each age and sex strata
(Unit: mean ± standard deviation)
self-employed class(class Ⅴ) was the lowest with 0.918(p<0.05). The lower class(class Ⅵ) was secondly low with 0.941(p<0.05). On the other hand, there was no significant difference in the high and upper & middle class(class Ⅰ), new middle class(class Ⅱ), old middle class(class Ⅲ), and labor class(class
Ⅳ). In case of the whole women, EQ-5D index of the agricultural self-employed class(class Ⅴ) was the lowest with 0.866. The lower class(class Ⅵ) was secondly low with 0.908. The old middle class(class Ⅲ) showed the thirdly low level. On the other hand, the high and upper & middle class(class Ⅰ) and the new middle class(class Ⅱ) showed the higher health-related quality of life than other classes. Even in case of the whole subjects of combining men and women, EQ-
5D index of the agricultural self- employed class(class Ⅴ) was the lowest with 0.900. The lower class(class Ⅵ) was secondly low with 0.922. The old middle class(class Ⅲ) showed the thirdly low level. On the other hand, the high and upper & middle class(class Ⅰ) and the new middle class(class Ⅱ) showed the higher health-related quality of life than other classes(Table 4).
5. Consideration
This study aimed to measure difference in health-related quality of life among social classes in 7,992 adults aged 20-69 in our country, namely, difference in EQ-5D index, and to grasp the contributional level of socio-demographic factor, health behavior,
stress, and chronic-disease factor as factors of describing difference among these classes, by using the 4th Korea National Health and Nutrition Examination Survey.
Social stratification is stronger factor of predicting health level than any socioe- conomic variable(Chandola et al., 2003), but has been researched by using job, education, income, and age as alternative variables in investigating into difference based on the classification of social stratification owing to the absence of suitable classification of social stratification13).
Domestically prior research is using the classification of stratification based on job classification as the main index of represen- ting social class. It is the real situation that a research is more needed on suitable classific- ation of social stratification for healthcare, which better reflects the difference in health level or health behavior6). This study applied classification of social stratification, which had been used in a research by 5)Kim Min-gyeong et al.(2010). 5)Kim Min-gyeong et al.(2010) used it in analysis by re- classi- fying social stratification into 7 classes by using 13 pieces of rough classification out of the Korean standard job classification based on researches by 6)Yoon et al. (2000). The 4th Korea National Health and Nutrition Examination Survey isn't included house- wife variable. Thus, this study classified it only into 6 classes except the housewife class.
As a result of research, both men and women showed low aspect in EQ-5D index value in the more belonging to the low social class as a whole. This outcome was the consistent direction with the existing researches4,6), which evaluated health behavior, subjective health level, prevalence, and death.
When comparing it with the high and upper
& middle class, the significant difference was shown in labor class, agricultural self-employed class, and lower class as for men and in the agricultural self-employed class and lower class as for women. A research by 5)Kim Min-gyeong et al.(2010) reported that the agricultural self-employed class in case of women showed the lowest subjective health level. In this study, EQ-5D index of the agricultural self-employed class was grasped to be the lowest even in men as well as women. This outcome implies that the health-related quality of life in people of engaging in agriculture and fishery of belonging to the agricultural self-employed class in our country is especially low compared to other social classes. It is considered to be likely related to what the agricultural self- employed class is much distributed low- income brackets, is low in practice of health behavior6), and has high incidence rate on musculoskeletal system. In their 20s and 30s, the difference in EQ-5D index value among classes wasn't distinct.
This is supposed to be the reason that social stratification is decided by parents' job rather than own job in case of age group in the 20s and 30s. On the other hand, the difference among the agricultural self-employed class, lower class, and remaining classes was outstanding in the more rise in age group.
This tendency came to be clearer in women.
This study aimed to seek factors of contributing to difference in health-related quality of life among social classes through hierarchical regression analysis. As a result of analysis, both men and women were understood that job stress, chronic disease, educational level, and income level contribute to difference among classes. Health behavior
was grasped to be contributional factor only to women.
Examining researches14,15,16,17) in other co- untries in terms of the contribution of health behavior to socioeconomic health inequality, the health behavior is being reported to contribute consistently to explanatory power about total mortality among occupational classes or income classes. However, the general conclusion on the existing researches is said that the socioeconomic health inequality fails to be completely explained or is not great in its influence1). In a study by
5)Kim Min-gyeong et al.(2010) that is domestic research, the health behavior was understood to contribute to difference in subjective health level among classes. In this study, this phenomenon couldn't be observed in men. This is guessed to be the pheno- menon that the influence of health-behavior factor failed to be properly reflected because difference in health level among classes isn't distinct compared to women. However, an additional research on this is considered to be likely necessary.
As the job-stress factor, which was grasped to be contributional factor among classes in this study, is also psycho-social factor, it is the factor that had been noted as an element of socioeconomic health inequality in the advanced countries18,19,20). It is said that a psycho-social and environmental factor needs to be considered in order to explain the health inequality aspect in the ordinal form, which exists in the main advanced countries without material hardship1). This study was understood that the chronic disease except education and income level greatly contributes to difference in health level among classes. 4)Kim Hye-ryeon et al.(2002) ever reported that considerable
inequality exists in chronic disease and subjective health level among social classes in population group of Seoul Metropolis in our country.
In the meantime, as for difference in health-related quality of life in relation to educational level, the group with high academic background and job showed high health-related quality of life. It was statisti- cally significant and was consistent even with the findings by21). The more income level leads even to the higher health- related quality of life. However, large income and economic well-being leads to having lots of time, cost, and mental composure available for using medical treatment with the aim of prevention like medical examination or for taking exercise, thereby being consistent even with the findings22) as saying of contributing to increasing health-related quality of life.
As for limitations of this study, first, the economically inactive population was excluded such as housewife, student, unemployed, and soldier given classi- fication of social stratification. Thus, the health-related quality level of life in these groups failed to be suggested. A future research is considered to be needed an analysis on health-related quality level of life in these groups and on contributional factor.
Second, as the limitation of cross-sectional study, a factor of contributing to difference in health level among social classes couldn't be examined on the basis of time-series approach. In case of our country, the importance of life-course approach is being emphasized1)(Gang Yeong-ho, 2005) in a sense of having many important diseases in exposure during childhood. The life-course approach has interest in the risk-factor
exposure over the lifetime among generations and within generations, as well as the risk-factor exposure in the specific period as for socioeconomic inequality in health. A research of overcoming the limitation of cross-sectional study is expected to be followed by tracing and observing subjects in the future.
Third, the job variable, which was used in the Korea National Health and Nutrition Examination Survey, is not what was devised in order to classify social stratifi- cation. Thus, there is limitation in categorizing social stratification by using this variable. This results from a factor of being indistinct in definition on job and of failing to define clearly in the Korean standard job classification. Accordingly, there may be error of classification in variable of social stratification to which this study applied.
This classification error may weaken correlation between social stratification and health level more than reality. There is a need of developing categorization of social stratification suitable for our country in the future.
Fourth, severity on chronic-disease variable wasn't reflected. Also, it failed to consider contributional degree of the complex status in chronic disease. A future research is thought to be likely necessary for being considered the application of index, which reflects this.
In the face of these limitations, the significance of this study can be known that the health-related quality of life by social stratification is closely related to an individual's socio-demographic characte- ristic, health behavior, or chronic disease.
There will be a need of being continued a research by supplementing the limitations of
this study, and an additional research, which will devise proper measure for enhancing health-related quality of life as well as maintaining and promoting health.
6. Conclusion
This study measured health-related quality level of life by social stratification in 7,992 adults aged 20~69 in our country by using data of the 4th Korea National Health and Nutrition Examination Survey, and grasped the contributional degree in socio-demographic factor, health behavior, and chronic-disease factor as the elements of describing difference in health-related quality level of life by this stratification.
Thus, the following results were obtained.
First, seeing score for health-related quality of life by social stratification, namely, distribution of EQ-5D index, the new middle class(class Ⅱ) was the highest with 0.966 point in men. It was in order of the high and upper & middle class(class Ⅰ) with 0.965 point, labor class(class Ⅳ) with 0.958 point, old middle class(class Ⅲ) with 0.955 point, lower class(class Ⅵ) with 0.941 point, and agricultural self-employed class(class Ⅴ) with 0.918 point. In women, the new middle class(class Ⅱ) was the highest with 0.955 point. Difference by stratification was shown in order of the high and upper & middle class(class Ⅰ) with 0.955 point, labor class(class Ⅳ) with 0.936 point, old middle class(class Ⅲ) with 0.932 point, lower class(class Ⅵ) with 0.908 point, and agricultural self-employed class(class Ⅴ) with 0.866 point.
Second, as for the results of hierarchical regression analysis, the factors of contributing to difference by social stratification in
health-related quality of life included chronic disease, job stress, education, and income level in both men and women. Health behavior was grasped as contributional factor only in women.
Generally, the more belonging to low social stratification led to having shown the low aspect in EQ-5D index value. Both men and women were understood to have the lowest EQ-5D index value in the agricultural self-employed class(class Ⅴ).
Excluding education and income level, the prevalence of chronic disease showed the greatest contributional degree to difference in health-related quality of life by social stratifi- cation. Accordingly, to reduce difference in health-related quality of life according to social stratification in our people, the continuous investment in supporting good- quality education and economic stability is needed in the whole society. In the sphere of health, the priority is considered to be necessarily given to the prevention of chronic disease and to the development in effective management policy for the lower classes.
As for the limitation of this study, the local characteristic failed to be considered.
A future research is thought to be likely good even to comparatively analyze with the 5th Korea National Health and Nutrition Examination Survey.
References
1. Kang YH. Lifecourse Approaches to So- cioeconomic Health Inequalities. JPMPH, 2005;38(3):267-275.
2. Cockeham, William C. Health Behavior, Medical Sociology Printice Hall, 1995.
3. Grabb, E. Theories of Social Inequalities:
Classical and Contemporary Perspe-
ctives, 1990.
4. Kim HR. The Relationship of Socio- economic Position and Health Behaviors with Morbidity in Seoul, Korea. KIHASA, 2005;25(2):3-35.
5. Kim MK, Jeong WJ, Lim SJ, et al. Socio- economic Inequity in Self-Rated Health Status and Contribution of Health Behavioral Factors in Korea. JPMPH, 2010;43(1):50-61.
6. Yoon TH. The relationship between social class distribution and mortality.
KSHPA, 2003;13(4):99-114.
7. Kim CY. Socio-economic status, health, and health risk behavior. HWPF, 2004.
8. Calvert MJ, Freemantle N. Use of health- related qualty of life in prescribin research. PartI : why evaluate health- related qualty of life. J Clim Pharm Ther, 2003;28;513-21.
9. Han MA, Rhu SY, Park J, et al. Health- related Quality of Life Assessment by the EuroQol-5D in Some Rural Adults.
JPMPH, 2008 ;41(3):173-180.
10. Kim GY, Cheon BY, Gam S, et al.
Development of Measurement Scale for the Quality of Life in Hypertensive Patients. JPMPH, 2005;38:61-70.
11. Gill SY, Lee SI, Yoon SC,et al. The decline of health-related quality of life associated with some diseases in Korean adults. JPMPH, 2008;41(6):434- 441.
12. Nam HS. South Korean time trade-off values for EQ-5D health states. KCDC, 2010.
13. Dowd JB, Zajacova. Does the predictive power of Self-rated health for subse- quent mortality risk vary by socio- economic status in the US. Int J Epidemiol, 2007;36(6):12(4-122).
14. Pekkanen J, Tuomilehto J, Uutela A, Vartiainen E, Nissinen A. Social class, health behaviour, and mortality among men and women in eastern Finland.
BMJ, 1995;589-93.
15. Lantz PM, House JS, Lepkowski JM, Williams DR, Mero RP, Chen J. Socio- economic factors, health behaviors, and mortality: results from a nationally re- presentative prospective study of US a dults. JAMA 1998;279:1703-8.
16. Schrijvers CTM, Stronks K, van de Mheen HD, Mackenbach JP. Explaining educational differences in mortality:
the role of behavioral and material factors. Am J Public Health, 1999;89:
535-40.
17. Woodward M, Oliphant J, Lowe G, Tunstall-Pedoe H. Contribution of con- temporaneous risk factors to social inequality in coronary heart disease and all causes mortality. Prev Med, 2003;36:
561-8.
18. Adler NE, Boyce T, Chesney MA, Cohen S, Folkman S, Kahn RL, Syme SL. Socioeconomic status and health:
The challenge of the gradient, Am Psycholo, 1994;49(1):15-24.
19. Adler NE, Ostrobe JM. socioeconomic status and health: what we know and what we don't. Ann New York Acad Sci, 1999;896:3-15.
20. Marmot M, Wilkinson RG. Psychoso cial and material pathways in the relation between income and health. A response to Lynch, 2001;322:1233-1236.
21. Ko SD. 1996. An analytical study of factors affecting quality of life of the elderly. Ewah womans university grad- uate school, 1996.
22. Lee SG, Jeon SY. The Relations of Socioeconomic Status to Health Status, Health Behaviors in the Elderly. JPMPH, 2005;38(2):154-162.