289
"J. Korean Soc. Radiol., Vol. 12, No. 3, June 2018"
Diagnostic X-ray Spectra Detection by Monte Carlo Simulation
Cheol-Ha Baek,1 Seung-Jae Lee,2 Daehong Kim3,*
1Department of Radiological Science, Kangwon National University
2Department of Radiological Science, Dongseo University
3Department of Radiological Science, Eulji University
Received: March 12, 2018. Revised: June 25, 2018. Accepted: June 30, 2018
ABSTRACT
Most diagnostic devices in the medical field use X-ray sources, which emit energy spectra. In radiological diagnosis, the quantitative and qualitative analyses of X-rays are essential for maintaining the image quality and minimizing the radiation dose to patients. This work aims to obtain the X-ray energy spectra used in diagnostic imaging by Monte Carlo simulation. Various X-ray spectra are simulated using a Monte Carlo simulation tool.
These spectra are then compared to the reference data obtained with a tungsten anode spectral model using the interpolating polynomial (TASMIP) code. The X-ray tube voltages used are 50, 60, 80, 100, and 110 kV, respectively. CdTe and a-Se detector are used as the detectors for obtaining the X-ray spectra. Simulation results demonstrate that the various X-ray spectra are well matched with the reference data. Based on the simulation results, an appropriate X-ray spectrum, in accordance with the tube voltage, can be selected when generating an image for diagnostic imaging. The dose to be delivered to the patient can be predicted prior to examination in the diagnostic field.
Keywords: X-ray spectrum, Monte Carlo simulation
Ⅰ. INTRODUCTION
In radiology, various devices have been used for detecting lesions in the human body. The diagnostic systems used in medical applications require X-ray generating sources. These machines use different X-ray energy ranges for mammography, computed tomography (CT), digital radiography (DR), and panoramic X-ray devices. In radiological diagnostics, the quantitative and qualitative analyses of X-rays are essential for maintaining the image quality and minimizing the radiation dose delivered to patients.
Therefore, the amount of radiation emitted from the target at a given voltage, current is significant in the development of diagnostic systems. In addition, the radiation detected from the emitted radiation is
critical.
X-ray spectra measurements have been performed by other researchers. In a previous work, the spectral distribution of a X-ray beam was extracted by measuring the transmission data from a step wedge.[1]
The energy deposited by X-ray photons was measured by a photon-counting detector.[2] As described in previous works[3,4], X-ray spectra were measured to predict the detected spectral distribution, thereby the trade-off between the image quality and radiation dose was determined. In addition, for determining the X-ray spectra before the examination is performed, the proposed method, which obtains the spectral distribution by Monte Carlo simulation can be simple and useful. The detected output spectra have been proved by Monte Carlo N-particle radiation transport
* Corresponding Author: Daehong Kim E-mail: [email protected] Tel: +82-31-740-7494 https://doi.org/10.7742/jksr.2018.12.3.289
computer code (MCNP) and Penetration and ENErgy Loss of Positrons and Electrons (PENELOPE). Their results could be expected to assuming the X-ray spectral distribution. As a Monte Carlo simulation tool, Geant4 application for tomographic emission (GATE) has been mainly used to assist not only SPECT and PET but also X-ray imaging and radiation therapy dose monitoring.[5,6] GATE has a possibility to detect diagnostic X-ray energy spectra.
Tungsten anodes are the most extensively used target material in X-ray tubes. Cadmium telluride (CdTe) and amorphous selenium(a-Se) detectors are used in X-ray imaging. CdTe detectors are fabricated using a novel hybrid method, in which CdTe is pre-deposited onto a glass substrate and then connected to a thin film transistor (TFT) substrate, whereas a-Se detectors are fabricated using direct deposition on a TFT substrate.
The purpose of this simulation study is to acquire the X-ray spectra for various tube voltages and two detector materials. We propose simulation for obtaining the X-ray spectra prior to measurement. The initial X-ray tube voltages used are 50, 60, 80, 100, and 110 kV, respectively. CdTe and a-Se are the detector materials used for detecting the X-ray photon energy. The initial X-ray spectra are generated using the model of Fewell et al.,.[7]
Ⅱ. MATERIALS AND METHODS
1. Incident X-ray spectra
The incident X-ray spectra of a commercial X-ray tube (ROTANODETM, Toshiba, Japan) were generated with a tungsten-anode spectral model, using the interpolating polynomial (TASMIP) model.[3] The technique for interpolating the spectra is identical for all anode material. Let be the photon fluence (photons/mm2) at energy, E, when a voltage, V, is applied to the X-ray tube. At each energy 'bin' (1 keV intervals were used), a polynomial function was defined as follows:
(1)
The coefficient arrays , , , and define the polynomial coefficients for each anode material.
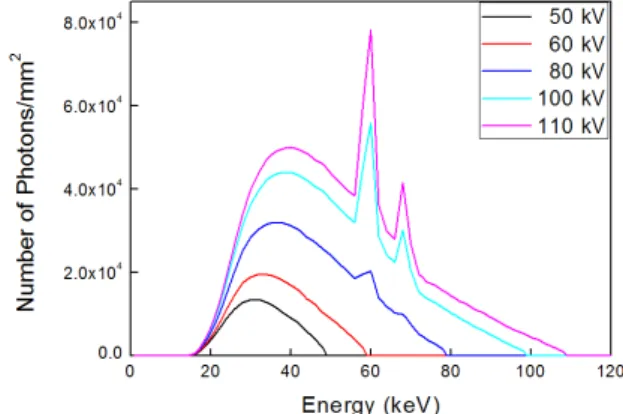
We generated the initial X-ray spectra (50, 60, 80, 100, and 110 kV) using this model as shown in Fig. 1.
Fig. 1. Initial X-ray spectra for tube voltages of 50, 60, 80, 100, and 110 kV, respectively.
2. Process for calculating the detected spectrum
The detected spectra are dependent on the detection efficiency, D(E), of the detector, which yields the relative signal amount generated by a quantum of energy, E. For an ideal integrating detector, D(E)=E. However, for practical detectors D(E) has a more complex, and should be calculated or measured for a precise description. By parameterizing the source and detector, we can describe the measurement process. The measured spectra are given by
(2)where w(E) is the detected photon for each energy, E. S(E) is the initial X-ray spectrum emitted through the window of the X-ray tube, and D(E) is the detection efficiency of the detector. The detection efficiency of a material can be calculated by the following equation:
"J. Korean Soc. Radiol., Vol. 12, No. 3, June 2018"
(3)
where is the linear attenuation coefficient of the detector material, and x is its thickness. CdTe (XR100T, Amptek, US) and a-Se (FDXD 1417, DRtech, Korea) were used as detector materials for detecting the X-ray photons. The thicknesses of the CdTe and a-Se material were 1 mm and 500 μm, respectively. We calculated the detected spectra from the incident spectra for 50, 60, 80, 100, and 110 kV, respectively, using equation 2.
3. Monte Carlo simulation
X-ray beams were produced by a TASMIP model with reference to a Toshiba tube. CdTe and a-Se detectors, sized 1˟1˟1 ㎣ and 1˟1˟0.5 ㎣, respectively, were used for measuring the X-ray spectra at different tube voltages. GATE was used as the simulation tool for detecting the X-ray spectra.
The energy distributions of the emitted X-ray photons were obtained from the spectra produced by simulating the X-ray generation. Their directions are randomly distributed within a fixed solid angle. The source to detector distance (SDD) was 100 cm. The X-ray spectra were detected for tube voltages of 50, 60, 80, 100, and 110 kV, with CdTe and a-Se detectors, respectively.
Ⅲ. RESULTS
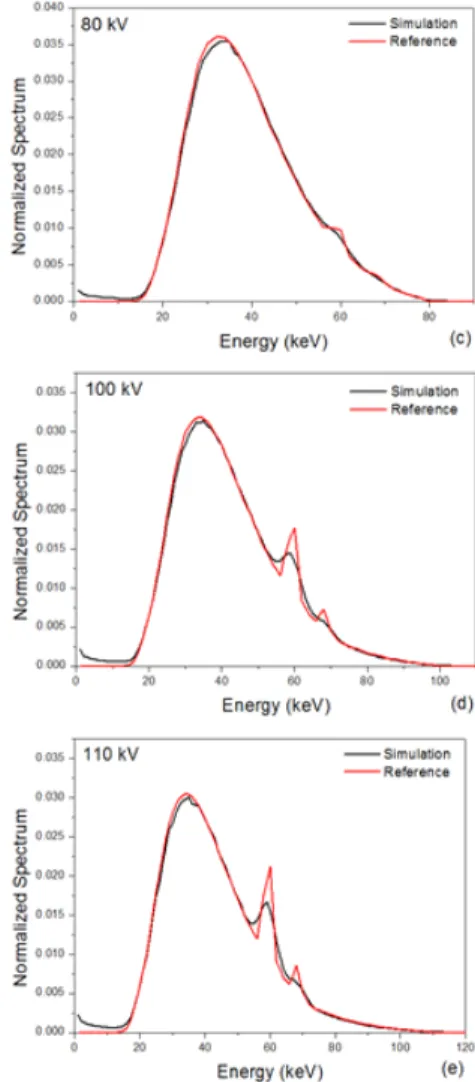
The X-ray spectra acquired by Monte Carlo simulation were compared with the reference X-ray spectra, which were calculated using equations (2) and (3). The results of the X-ray spectra acquired by Monte Carlo simulation and the reference results detected by the CdTe detector are illustrated in figures 2 (a–e). The total photon counts were normalized to unity and the energy interval was 1 keV. In the figures 2 (a) and (b), the simulation spectra are well-matched with the reference spectra. In figures 2
(c), (d), and (e), tungsten K-edge energy peaks appear at 59.31 (Kα) and 67.23 (Kβ) keV. The K-edge energy peak is more obvious in the reference spectra than in the simulation results.
Fig. 2. (a-e) are the X-ray spectra estimated by Monte Carlo simulation and the calculated data detected by a CdTe detector for 50, 60, 80, 100, and 110 kV, respectively.
Figures 3 (a-e) depict the X-ray spectra estimated by Monte Carlo simulation and the reference results detected by an a-Se detector. In figures 3 (a) and (b), the K-edge energy peak does not appear because the tube voltage is below 60 kV. The simulated spectra agrees with the reference. In figure 3 (c), a tungsten K-edge energy peak appears at 59.31 (Kα). Figures 3 (d) and (e) show tungsten K-edge energy peaks at 59.31 (Kα) and 67.23 (Kβ) keV. In this case also, the K-edge energy peaks are more obvious in the reference spectra than in the simulation results.
Fig. 3. (a-e) are the X-ray spectra obtained by Monte Carlo simulation and the calculated data detected by
an a-Se detector for 50, 60, 80, 100, and 110 kV, respectively.
The simulated and reference spectra, for all the tube voltages, were compared with respect to the normalized root mean squared deviation (NRMSD), which is defined as[8]
max min
(4)
where is the simulated spectrum, is the reference spectrum, and N is the number of data points.
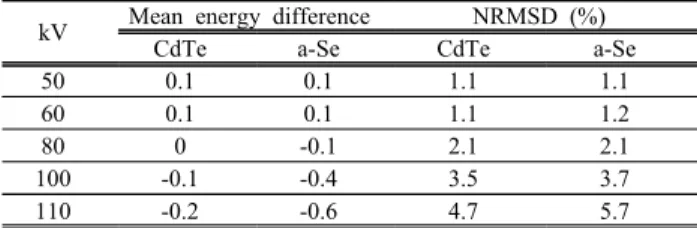
The mean energy difference and NRMSD results between the simulation and reference spectra are listed
"J. Korean Soc. Radiol., Vol. 12, No. 3, June 2018"
in table 1. On increasing the tube voltage, the mean energy difference as well as the NRMSD between the simulated and reference spectra increased. The mean energy difference, as well as the NRMSD, between the two spectral distributions detected by the CdTe and a-Se detectors was increased with the tube voltage.
Table 1. Comparison of the simulation and reference data.
kV Mean energy difference NRMSD (%)
CdTe a-Se CdTe a-Se
50 0.1 0.1 1.1 1.1
60 0.1 0.1 1.1 1.2
80 0 -0.1 2.1 2.1
100 -0.1 -0.4 3.5 3.7
110 -0.2 -0.6 4.7 5.7
Ⅳ. DISCUSSION AND CONCLUSION X-ray spectral distributions were assessed by Monte Carlo simulation and their results were compared to the reference data calculated using equations (2) and (3).
Figure 2 shows the X-ray spectra obtained using a CdTe detector. The K-edge energy peak dose not appear in figures 2 (a) and (b) because the tube voltage is below the K-edge energy of the tungsten target whereas these peaks are present in figures 2 (c), (d), and (e). In figure 2, there is an increase in both the mean energy difference and NRMSD between the simulated and reference spectra, with the tube voltage. This is due to the reduction in the K-edge peak energy in the simulation results, which increases both the mean energy difference and NRMSD, as observed in table 1. The results of the X-ray spectra detected by an a-Se detector exhibit the same trend, as shown in figure 3. The differences between the simulated and reference spectra can be attributed to the imperfect charge collection in the detector. Therefore, realistic simulations should include the rejection of the interactions near the cathode.
It is important to estimate the X-ray spectra related to the radiation dose, when selecting the X-ray tube voltage for diagnostic examination. Knowledge of the X-ray spectrum is crucial for several diagnostic X-ray imaging applications. Therefore, interest in estimating the patient dose from the X-ray imaging system continues to grow. However, because of the high photon flux produced by X-ray tubes, the direct measurement of the spectra from an X-ray machine is difficult. We assessed the Monte Carlo simulation method for estimating the X-ray spectra emitted from a tube and detected the X-ray spectra using two types of detectors. The simulated spectra were well matched with the reference obtained by calculating the spectral emission with a measurement model. Further study can include the charge collection in the detector.
Acknowledgement
This research was supported by the National Foundation of Korea (NRF) grant, funded by the Ministry of Science and ICT (2017R1C1B5017626).
Reference
[1] M. Endrizzi, P. Delogu, A. Stefanini, “X-ray spectra reconstruction from analysis of attenuation data: A ba ck scattering Thomson source application”, Nuclear In struments & Methods in Physics Research Section A- Accelerators Spectrometers Detectors and Associated Equipment, Vol. 608, No. 1, pp. S78-S82, 2009.
[2] T. Michel, P. T. Talla, M. Firsching, J. Durst, M. B ohnel, G. Anton, “Reconstruction of X-ray spectra wi th the energy sensitive photon counting detector Medi pix2”, Nuclear Instruments & Methods in Physics Re search Section A - Accelerators Spectrometers Detect ors and Associated Equipment, Vol. 598, No. 2, pp.
510-514, 2008.
[3] D. Roet, C. Ceballos, P. Van Espen, “Comparison be tween MCNP and PENELOPE for the simulation of X-ray spectra in electron microscopy in the keV rang e”, Nuclear Instruments & Methods in Physics Resear ch Section B, Vol. 251, No. 2, pp. 317-325, 2006.
[4] A.A. Mowlavi, “X-ray spectra calculation for different target-filter of mammograms using MCNP code”, Inte rnational Journal of Radiation Research, Vol. 3, No.
3, pp. 129-133, 2005.
[5] S. Jan, G. Santin, D. Strul, S. Staelens, K. Assié, D.
Autret, S. Avner, R. Barbier, M. Bardiès, P. M. Bloo mfield, D. Brasse, V. Breton, P. Bruyndonckx, I. Buv at, A. F. Chatziioannou, Y. Choi, Y. H. Chung, C. C omtat, D. Donnarieix, L. Ferrer, S. J. Glick, C. J. Gr oiselle, D. Guez, P. F. Honore, S. Kerhoas-Cavata, A. S. Kirov, V. Kohli, M. Koole, M. Krieguer, D. J.
van der Laan, F. Lamare, G. Largeron, C. Lartizien, D. Lazaro, M. C. Maas, L. Maigne, F. Mayet, F. Me lot, C. Merheb, E. Pennacchio, J. Perez, U. Pietrzyk, F. R. Rannou, M. Rey, D. R. Schaart, C. R. Schmidt lein, L. Simon, T. Y. Song, J. M. Vieira, D. Visviki s, R. Van de Walle , E. Wieërs, C. Morel, “GATE:
a simulation toolkit for PET and SPECT, Physics in Medicine and Biology”, Vol. 49, No. 19, pp. 4543-4 561, 2004.
[6] S. Jan, D. Benoit, E. Becheva, T. Carlier, F. Cassol, P. Descourt, T. Frisson, L. Grevillot, L. Guiques, L.
Maigne, C. Morel, Y. Perrot, N. Rehfeld, D. Sarrut, D. R. Schaart, S. Stute, U. Pietrzyk, D. Visvikis, N.
Zahra, I. Buvat, “GATE V6: a major enhancement of the GATE simulation platform enabling modelling of CT and radiotherapy”, Physics in Medicine and Biolo gy, Vol. 56, No. 4, pp. 881-901, 2011.
[7] J. M. Boone, J. A. Seibert, “An accurate method for computer-generating tungsten anode X-ray spectra fro m 30 to 140 kV”, Medical Physics, Vol. 24, No. 11, pp. 1661-1670, 1997.
[8] X. Duan, J. Wang, L. Yu, S. Leng, C. H. McCollou gh, “CT scanner x-ray spectrum estimation from trans mission measurements”, Medical Physics, Vol. 38, N o. 2, pp. 993-997, 2011.
"J. Korean Soc. Radiol., Vol. 12, No. 3, June 2018"
진단용 X-선 스펙트럼의 몬테칼로 전산모사 측정
백철하,1 이승재,2 김대홍3,*
1강원대학교 보건과학대학 방사선학과
2동서대학교 보건의료계열 방사선학과
3을지대학교 보건과학대학 방사선학과
요 약
대부분의 진단용 방사선 장치는 엑스선을 사용하며, 엑스선은 다양한 에너지를 갖는 스펙트럼을 갖는다.
진단 영상에서 엑스선의 정량적 및 정성적 분석은 선량을 줄이면서 영상 화질을 유지하는데 필수적이다.
본 연구의 목적은 진단 영상에 사용되는 엑스선 스펙트럼을 몬테칼로 시뮬레이션으로 측정하는 것이다. 다 양한 엑스선 에너지 스펙트럼이 몬테칼로 시뮬레이션으로 측정되었다. 이 스펙트럼들은 다항식을 보간 한 양극 텅스텐 모델에 의해 계산된 결과와 비교하였다. 엑스선 관전압은 50, 60, 80, 100, 110 kV 였다. 검출기 로는 카드뮴 텔루라이드와 비정질 셀레늄 물질을 사용하였다. 엑스선 에너지 스펙트럼의 시뮬레이션 결과 는 참조 결과와 일치하였고, NRMSD 값은 최소 1.1%에서 최대 5.7%를 보였다. 시뮬레이션 결과에 의하면 진단 영상을 획득할 때 적절한 관전압의 선택을 가능하게 할 것이다. 또한, 영상 획득 전 환자에 전달되는 선량을 예측하는데 기여할 것이다.
중심단어: 엑스선 스펙트럼, 몬테칼로 전산모사