The seas east of Japan, the region between the Kuroshio Extension (KE) and the Oyashio front are commonly referred to as the Mixed Water Region (MWR) [Kawai, 1972]. The transport of the Oyashio water and the formation process of the North Pacific Intermediate Water (NPIW) are strongly linked with meso-scale hydrographic structures in the MWR, such as the branches of the Oyashio, warm core rings and the KE [Talley et al.,1995; Yasuda et al., 1996; Okuda et al., 2001]. Although our knowledge of the variability of the KE in the northeast regions of Japan has increased over the past decade, understanding of the KE’s variability is still unsatisfactory. This is primarily due to sparsely-
sampled data for the high fluctuations caused by meandering of the boundary current. Because previous studies on the frontal-region flow pattern have relied heavily on time-series data based on satellite imagery and ship observations, it has not adequately considered how mid-depth water mass will adjust to surface dynamic changes [Yang, 2001]. In spring, although the surface expression of the KE starts to move northward with many kinds of forms and locations, we do not understand well how deep the process is [Yang, 2000].
Direct measurement of the circulation at depth by neutrally buoyant floats [e.g. Davis et al, 1992; ArgoScience Team, 2001] will help to clarify this aspect.
As part of the Japan Argo project, the eight Argo floats were deployed in the Kuroshio Extension region
Outbreak of Water Mass into the East Coast of JapanEvident in the Kuroshio Extension in June 2001
Chan-Su Yang* and Toshio Suga**,***
Korea Research Institute of Ships & Ocean Engineering, KORDI, Daejeon, 305-343, South Korea*
Institute of Observational Research for Global Change, JAMSTEC, Yokosuka, Japan**
Department of Geophysics, Tohoku University, Sendai, Japan***
Abstract : The trajectories of 8 autonomous profiling floats deployed in the Kuroshio Extension region in February 2001 are used to depict the circulation pattern at the surface and 2000db. The corresponding sea surface topography maps created from satellite altimeter and dynamic height climatology were compared with the tracks of nearly coincident floats and were found to agree well in most cases except for the period June 5 to 16 2001. It is shown that over the period the conspicuous breakaway of the floats from an expected path is possibly associated with the abnormal path of the Kuroshio Extension such as an outbreak event, as revealed by AVHRR infrared and SeaWiFS chlorophyll-a images and cruise data in cross sections.
Key Words : Argo project, Kuroshio Extension, Outbreak.
Received 11 August 2004; Accepted 16 September 2004.
(2)
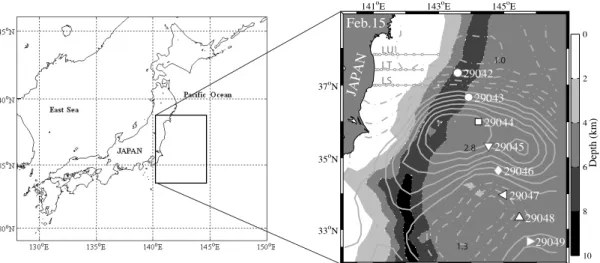
southeast of Japan on February 15 to 16, 2001 (Figure 1:
symbols with white-colored WMO ID 29042 to 29049) in order to understand its meso-scale variability and associated structure of water mass in detail. The floats were ballasted for the parking depth of 2000db and programmed to collect profile data (62 levels) during their ascents at 10-day intervals.
One of the main Argo objectives is to establish the in situ ocean observing system with complementing the satellite remote observing system. In this paper, therefore, the trajectories of the floats and the sea surface height (SSH) field are compared during the period February through June 2001.
Toba et al. [1991] reported that an outbreak of warm water occurred from the large meander part of the Kuroshio in April-May 1988, using NOAA/AVHRR sea surface temperature (SST) data [Kudo, 2001], cruise data and surface mooring buoy data. In the early June 2001, we found that there was this kind of warm water outbreak for the KE. In addition to above data, therefore, we adopted cruise observations and satellite data such as AVHRR infrared and SeaWiFS chlorophyll-a images to verify the validation of the outbreak of the KE that
comes from comparisons between SSH and float trajectories.
2. Comparison between Float
Trajectories and Sea Surface Height
Figure 1 represents the positions of deployed floats and SSH map derived from the two satellite altimeters, TOPEX/POSEIDON (T/P) and ERS-2.
The altimeter-derived data used in this study are the along-track T/P and ERS-2 SSH anomoly data, which were downloaded from Colorado Center for Astrodynamics Research. The data sets were smoothed with 50-km scale Gaussian filter and interpolated onto 0.25。regular grids by using optimal interpolation at ten- day intervals starting on February 15, 2001. For the optimal interpolation the correlation space-scale of 150 km and time-scale of 40 days were chosen following Kuragano and Kamachi [2000].
To convert the SSH anomalies to absolute measures
of SSH, we have created a mean annual 0/1000-dbar
dynamic heights from the HydroBase North Pacific
Fig 1. The region of study, with T/P- and ERS-2-derived sea surface height (in m) on February 15, 2001. The three solid lines (LU,
LP, LS) with open circles represent a ship observation. Bottom topography is shown in kilometers. Eight floats (WMO ID
29042 to 29049) were deployed from February 15 to 16, 2001.
(3)
climatology (Macdonald et al., 2001) and then added surface height anomalies to these dynamic height field.
The resultant time series of absolute SSH maps are presented in Fig.2.
Since the floats surface every 10 days, the surfacing positions (open symbols in Fig.2) of the same data are plotted on the maps of SSH. The float tracks of submerged positions before and after the surfacing are also superimposed on the map with center-dotted (about 9.2 days before surfacing) and closed symbols (about 8
hours after surfacing). The line between these symbols represents the shortest distance that float would take at the sea surface and 2000db. Floats 29042 and 29047 expired soon after transmitting the first profile and after diving on June 7, 2001, respectively. Floats 29043 and 29049 were out of the research region after April 16 and May 16, 2001, respectively.
It is shown that most of the float trajectory coincided with the path expected from the positive/negative anomalies of SSH through a whole period. Geostrophic Fig 2. Time series of sea surface height maps and drifting float trajectories every 10 days from February 25 to June 15, 2001.
Contour interval is 0.2 m. Solid and dash lines represent positive and negative height anomaly fields, respectively. Thick black line: the bathymetric line of 2000m; open symbol: position of surfacing; center-dotted symbol: location about 9.2 days before surfacing; closed symbol: location about 8 hours after surfacing.
o
)
(4)
currents clearly dominated the floats’ movement when the floats moved in an anticyclonic or cyclonic ring. In general, tracks of drifting floats at 2000db have indicated the presence of topographically controlled flow patterns over the slope of the Japan Trench. As shown in Fig.2 (F) to (J), floats tend to follow the depth contour of 2000m. There were also significant meso- scale structures of several day timescales and several tens of kilometers space scales in the Kuroshio-Oyashio Frontal Region.
In the maps (K) and (L) of Fig. 2, float trajectories are unlike a route expected from the SSH and some event must be occurred due to an unsteady structure of the Kuroshio or Oyashio in the MWR. To be more precise, this event will be an abnormal breakout of the KE as tracked from infrared images south of the Kuroshio by Toba et al.[1991].
Float 29045 drifted northward at minimum 1.0 m/s at the sea surface after surfacing in the map (K) of Fig.2 and over the period of June 5-6, the main wind speed was 5.5 to 10.8 m/s with wind direction of southeast at the site according to QuickSCAT wind data. In contrast, on June 15, the wind speed decreased to 4 m/s with wind direction of northeast. It seems that the float was affected by the southward flow in the depth 2000m and by the wind in the surface in the early June, 2001. That
is, it can be said that the trajectory is related with the beginning of the outbreak. However, the other floats mean that the eastern part of the research area is under ordinary flow pattern. After that, the outbreak conveyed the float to the shore region shallower than 2000m (Fig.2 (L)).
3. Satellite and Observation Data
Figure 3 presents the NOAA/AVHRR-2 SST map Fig 3. NOAA/AVHRR-2 infrared image of the sea surface temperature (SST) east of Japan on June 4, 2001.
Arrows on the figure represent ADCP velocity vectors recorded at 100 m depth where the lines LS and LU were cruised on June 4-6 and line LS was on June 11- 13, 2001.
Jun. 42001
Fig 4. SeaWiFS chlorophyll-a maps on June 3-4, 2001. The chlorophyll concentrations are derived from SeaWiFS images and
white colors represent clouds.
(5)
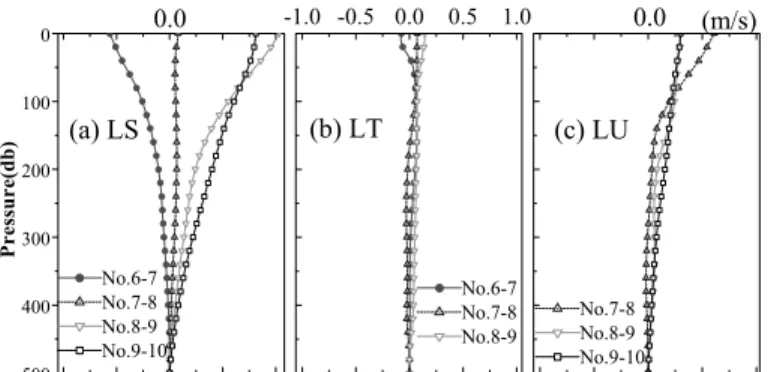
with the overlaid ADCP velocity vectors recorded at 100 m depth. The satellite imagery was taken on June 4, 2001 and the CTD and ADCP surveys were conducted at the lines LS (periods from 4th to 5th), LT (11th to 13th), and LU (5th to 6th) in June 2001 by the IwakiMaru.
In the SST image, the meander of the Kuroshio is evident as warm surface water (above about 20˚C) compared to the Oyashio water characterized by cooler surface waters (below about 11˚C). The highest temperature core part, flowing northward, is separated to the both southeast and southwest sides and the KE forms a mushroom-like structure at the top of the large meander (crest). The narrow band of warm water moved toward the land. We have compared the data from ADCP and SST map. The velocity distribution at the lines LS and LU only is very similar to the flowing pattern in the SST image. However, the ADCP recorders of LT display a disagreement with the SST field because of the difference in the observed time between both measurements. This fact means that the warm water event has finished by around June 11, 2001 and the KE come back to a steady structure.
SeaWiFS chlorophyll-a maps taken on June 3-4, 2001 are represented in Fig. 4. The chlorophyll concentrations are derived from SeaWiFS images and
white colors are due to clouds. The combined ocean color and SST products are of value to many areas of oceanographic research, providing near simultaneous observation of surface biological and physical processes [Lavender and Groom, 1999; Yang, 2001]. The maps here are used as an indicator of the KE location. In fact, the eddy structure derived from chlorophyll-a image is close to the one derived from ADCP and SST image. In Fig. 4 (A), the streamer, moving landwards from the KE crest can be interpreted as the front of the outbreak.
The three data sets, ADCP and satellite images display the presence of the outbreak, which suggests that the event may start in the late May or early June 2001.
In Fig. 5, the best representation of an abnormal event coincident with the hydrographic structure is obtained from the geostrophic computations, to allow examining of the velocity structure along the each cruise lines.
4. Summary and Discussion
During the period from 15 February to 15 June 2001, the trajectories of the Argo floats were sampled at the sea surface and depth of 2000 db in the KE and MWR.
Satellite data sets, CTD casts and ADCP velocity vectors have allowed a characterization of the near-
Fig 5. Profiles of the northward geostrophic velocity computed from CTD data using a reference level of no motion at 500 db for the same stations (Fig.
1) and period as ADCP of Fig.3. From left to right: from No. 1 to No.10.
(6)
surface flow distribution, the velocity field and the hydrographic structure from the surface to the depth of 500 m. At the surface and 2000db, we have reported a similarity between the float trajectory and path expected from SSH field, which suggest that meso-scale variability of the KE and associated structure of water mass reaches a deep depth by 2000db and is linked to the surface circulation features.
When the trajectories at 2000 db are investigated individually, it is seen that the Floats 29044 and 29045 stagnated with nearly spiraling during the period of late May through early June while the other floats revolved clockwise (Fig.2 (K)). In fact, as compared to the SSH map (Fig.2 (K)), the whole floats were being carried by an event of the KE as follows: (1) Floats 29044 and 29048 moved into the low SSH field; (2) Float 29046 turned slightly anti-clockwise; (3) Float 29045 went to the shallower region than 2000 m. Our interpretation on the migration of Float 29045, maybe started in the end of May is that the outbreak of the KE occurred off the Japan coast and its water structure extended to a depth of at least 2000 m. We also have identified the streamer- like outbreak of warm water, comparing the distribution of SST and ocean color data and directly-measured and geostrophic currents. This clearly accounts for the origin and extent of the outbreak from the KE.
Future studies will focus on defining both the period and the formation process of the KE outbreak that occurs among the KE and the Oyashio in the northeast regions of Japan.
Acknowledgements
The authors thank the captain, crew, technical staff and other members of the R/V Mirai MR01-K01 cruise for their support for the float deployments. They also thank their colleagues at the Frontier Observational Research System for Global Change and the Japan
Marine Science and Technology Center for helpful discussions. Satellite infrared images were obtained from JAIDAS, Japan. SeaWiFS products were provided by NASDA/EORC.
References
Argo Science Team, 2001. Argo: The global array ofprofiling floats, in Observing the Oceans in the21st Century, edited by C. J. Koblinsky and N.
R. Smith, GODAE Project Office, pp.248-258.
Bureau of Meteorology, Melbourne. Davis, R. E., D. C.
Webb, L. A. Regier, and J. Dufour, 1992. The Autonomous Lagrangean Circulation Explorer (ALACE), J. Atmos. Ocean Technol., 9: 264- 285.
Kawai, H., 1972. Hydrography of the KuroshioExtension in Kuroshio, It’s Physical Aspects, edited Stommel, H. and K. Yoshida, pp. 235- 352, Univ. of Tokyo Press.
Kudo, H., 2001. Japan Image Database, SENEC, 27: 15- 25.
Kuragano, T. and M. Kamachi, 2000. Global statistical spacetime scales of oceanic variability estimated from the TOPEX/POSEIDON altimeter data, J.
Geophy. Res., 105: 955-974.
Lavender, S. J. and S. B. Groom, 1999. The SeaWiFS automatic data processing system, Int. J.
Remote Sensing, 20: 1051-1056.
Macdonald, A. M., T. Suga, and R. G. Curry, 2001. An isopycnally averaged North Pacific climatology, J. Atmos. Ocean Technol., 18: 394-420.
Okuda, K., I. Yasuda, Y. Hiroe, and Y. Shimizu, 2001.
Structure of subsurface intrusion of the Oyashio water into the Kuroshio Extension and formation process of the North Pacific Intermidiate Water, J. Oceanogr., 57: 121-140.
Toba, Y., H. Kawamura, K. Hanawa, H. Otobe, and K.
(7)
Taira, 1991. Outbreak of warm water from the Kuroshio South of Japan -A combined analysis of satellite and OMLET oceanographic data, J.
Oceanogr. Soc. Japan, 47: 297-303.
Talley, L. D., Y. Nagata, M. Fujimura, T. Kondo, D.
Inagake, M. Hirai, and K. Okuda, 1995. North Pacific Intermediate Water in the Kuroshio/
Oyashio mixed water region, J. Phys. Oceanogr., 25: 475-501.
Yang, C. S. , 2000. Atmospheric and oceanic forcings on the spring coastal thermal environment in the Kuroshio/Oyashio Frontal Region, Coastal Eng.
J., 42: 407-425.
Yasuda, I., K. Okuda, and Y. Shimizu, 1996. Distribution