http://dx.doi.org/10.7840/kics.2014.39B.2.61
QoS Priority Based Femtocell User Power Control for Interference Mitigation in 3GPP LTE-A HetNet
Ishtiaq Ahmad, Zeeshan Kaleem*, KyungHi Chang°
ABSTRACT
In recent years, development of femtocells are receiving considerable attention towards increasing the network coverage, capacity, and improvement in the quality of service for users. In 3GPP LTE-Advanced (LTE-A) system, to efficiently utilize the bandwidth, femtocell and macro cell uses the same frequency band, but this deployment poses a technical challenge of cross-tier interference to macro users. In this paper, the novel quality of service based fractional power control (QoS-FPC) scheme under the heterogeneous networks environment is proposed, which considers the users priority and QoS-requirements during the power allocation. The proposed QoS-FPC scheme has two focal points: firs, it protects the macrocell users uplink communication by limiting the cross-tier interference at eNB below a given threshold, and second, it ensures the optimization of femtocell users power allocation at each power adjustment phase. Performance gain is demonstrated with extensive system-level simulations to show that the proposed QoS-FPC scheme significantly decreases the cross-tier intereference and improves the overall users throughput.
Key Words : QoS-FPC, Power Control, Interference Mitigation, HetNet, 3GPP LTE-A
※ This work was supported by the Industrial Strategic Technology Development Program (10041734, Development of feature-dispersive base station technology supporting multiRAT/multi-tier for next-generation integrated access system), and was also supported by (10044540, Development of small cell base station supporting IMT-Advanced TDD radio technology for evolution of TDD network) funded by the Ministry of Science, ICT and Future Planning (MSIP), Korea.
First Author : Department of Electronic Engineering, Inha University, [email protected], 학생회원 ° Corresponding Author : Department of Electronic Engineering, Inha University, [email protected], 종신회원 * Department of Electronic Engineering, Inha University
논문번호:KICS2013-12-529, 접수일자:2013년 12월 10일, 심사일자:2014년 1월 3일, 최종논문접수일자:2014년 2월 21일
Ⅰ. Introduction
The future traffic growth is so tremendous that there is a vastly increased need for further network densification using small cells to handle the capacity requirements and improve the quality of service (QoS) of users. In recent years, the development of small cells, i.e., specifically femtocells has provided cost-effective solutions to improve capacity and QoS requirements of users
[1]. In LTE-A system, femtocells can be deployed either indoor or outdoor, while the indoor femtocells are commonly referred as home evolved NodeBs (HeNBs). The proposed scheme in this paper works for HeNBs and outdoor
femtocells, but we consider only HeNBs under close access scheme which means only licensed home users can communicate with their own HeNBs.
However, a large number of HeNBs deployment poses a technical challenges like the cross-tier interference
[1,2]. There are several reasons contributing to the difficult management of the cross-tier interference such as co-channel deployment of the HeNBs, close access scheme, limited availability of bandwidth and the unplanned deployment of HeNBs
[3,4]. Hence the posed problems require the self configuring and self optimal interference management schemes.
In conventional heterogeneous networks
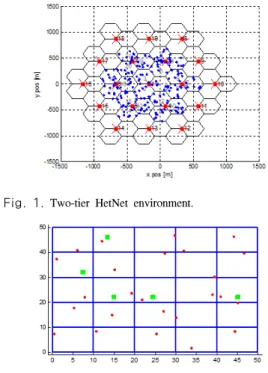
Fig. 1. Two-tier HetNet environment.
Fig. 2. × grid HeNB model.
(HetNets), well known power control schemes like
[3,4]
are proposed for effectively managing the cross-tier interference. In [5-6], uplink open loop power control optimization for co-channel HetNet deployment scenario is proposed. These schemes adjust the power control parameters for maximizing the system throughput without considering the users service priority and QoS requirements. In [7], a generic game theory based power control scheme is proposed, to efficiently assign users power level. It focuses on maximizing the efficiency of system throughput without considering the users QoS requirements, and also neglects the protection of macrocell users uplink (UL) communications. To solve the issues of users QoS requirements and the protection of UL communications by macro user equipments (MUEs), we propose a quality of service based fractional power control (QoS-FPC) scheme for interference mitigation in two-tier HetNets. In this scheme, we control and optimize the femtocell user equipment (FUE) transmit (Tx) power based on the QoS priority of FUEs and MUEs to mitigate the UL interference. As a result, our scheme has two main advantages; it always fulfills the demand of high priority UEs (MUEs or FUEs), but simultaneously it maintains the threshold demand of the low priority UEs. Therefore, on the basis of two main advantages discussed above, the proposed QoS-FPC scheme behaves better than the previous power control schemes.
Thus, the proposed scheme increases the overall system throughput by limiting the cross-tier interference at eNB below a pre-defined threshold level, i.e., maximum cross-tier interference that eNB can tolerate, by ensuring the optimization of FUEs power allocation at each power adjustment phase.
The simulation results are provided to prove the advantages of our proposed QoS-FPC scheme compared to the conventional fractional power control scheme.
The rest of the paper is organized as follows:
sectionⅡ discusses the QoS based system model in 3GPP LTE-A HetNet. In section III, the proposed QoS-FPC scheme is described in detail, and the performance of the proposed QoS-FPC scheme has
been evaluated by system-level simulations in section IV. Finally, section V concludes the paper.
Ⅱ. QoS-based System Model in 3GPP LTE-A HetNet
In this paper, the uplink of a 3GPP LTE-A
system is considered, where both the eNB and
HeNBs utilize the entire system bandwidth. The sets
of eNBs and HeNBs are denoted by M and F,
respectively, while
is the set of PRBs used in
eNB
∈and HeNB
∈. In the two-tier
HetNet environment of Fig. 1, center cell and the
1st tier cells are the area of interest, while the 2nd
tier cells consists of only eNBs to generate the
interference to users. The area of interest consists of
eNBs, HeNBs, MUEs and FUEs. The set of users
which communicate with eNB
and HeNB
are
represented by
and
respectively. In the
deployed scenario, we have 19 eNB sites, and each
site comprises of three hexagonal sectors. In each
hexagonal sector, we consider
×grid model
because it’s a standard model for dense HeNB
deployment modeling
[8]. Fig. 2 shows the
×grid
HeNB model, which is considered as a single floor building with 25 apartments. Each apartment is
×
and placed next to each other. The number of HeNBs per grid depends upon the deployment ratio while the percentage of an active HeNBs in a single apartment is decided by an activation ratio
[9], whereas in this paper we set all the HeNBs as active. It is assumed that at least one FUE is connected per HeNB.
Under the above mentioned deployment scenario, the target
and
observed on PRBs
∈
by MUE
and FUE
respectively, are described as;
(1)
where
and
are the transmit power from MUE
and FUE
to eNB
and HeNB
on PRBs
, respectively.
is the channel gain between MUE
and eNB
on PRB
, while the channel gain between FUE
and the HeNB
on PRB
is denoted by
. The thermal noise including UE noise figure per PRB is represented by
, and the aggregate interferences
and
received by MUE
and FUE
respectively, are given as;
≠
≠
(2)
2.1 Channel Model
The main components to model the channel gain
G are; path loss, shadowing, and fast fading. Asrecommended by the 3GPP specification
[8], for outdoor interfering and non-interfering links between MUE and eNB, the path loss is calculated as;
(3)
where R is the distance in meters between the
transmitter and receiver.
The path loss for interfering links and desired links for MUEs located indoors is calculated by using equation (4), while in this case extra wall loss
of 20 dB is considered;
(4)
The path loss for interfering and non-interfering links between FUEs and HeNBs is calculated as in the 3GPP LTE-A evaluation methodology
[9];
(5)
Shadowing is modeled to represent the deviations from the average path loss values due to geographical features such as terrain changes or buildings. It is generally modeled as a log-normal distribution with mean of 0 dB and standard deviation of 4 dB for the link between HeNB and UE
[10]. For all other links, including interference links, the standard deviation and inter-site correlation is 10 dB and 0.5, respectively. In order to reduce complexity, the concept of correlated shadow fading map proposed by Claussen for 8 neighbors
[10]is employed in this paper.
Fast fading refers to rapid variation of the signal levels due to the constructive and destructive interference of multiple signal paths, when the UEs move short distances. The fast fading component of the signal is generated according to PedB channel model
[11]. In this paper, pathloss, shadowing, and fast fading are considered for center cell and 1st tier, while 2nd tier only experiences pathloss and shadowing.
2.2 Bearer Model for Traffic Flows
One of the biggest challenges for the current IP
based service is QoS. In 3GPP LTE-A system QoS
support is provided through evolved packet system
(EPS) bearer. To simulate under typical traffic and
network loading conditions, the realistic traffic
models
[12]are used to evaluate the performance of
the proposed QoS-FPC scheme. To fully utilize the
traffic models at a user level, the complete LTE
QCI Resource
Type Priority Packet Delay Budget (ms)
Packet Error
Loss Rate Example Services
1 GBR 2 100 10-2 Conversational Voice
2 GBR 4 150 10-3 Conversational Video (Live Streaming)
3 GBR 5 300 10-6 Non-conversational Video (Buffered Streaming)
4 GBR 3 50 10-3 Real Time Gaming
5 Non-GBR 1 100 10-6 IMS Signaling
6 Non-GBR 7 100 10-3 Voice, Video (Live Streaming), Interactive Gaming
7 Non-GBR 6 300 10-6 Video (Buffered Streaming)
8 Non-GBR 8
300 10-6 TCP-based (for example, www, e-mail), Chat, FTP, p2p File Sharing, Progressive Video and Others
9 Non-GBR 9
Table. 1. Standardized QCIs for LTE.
protocol stack and bearer models are considered in this paper referring
[13]. Several classes of QoS services have been identified through QoS class identifiers (QCIs) shown in Table 1
[14]. The users are categorized in terms of applications they use, for example, users using the applications like VoIP, video and gaming are categorized under the real time (RT) flows, while the users using the HTTP and web browsing applications lies in non-real time (NRT) flows, and the FTP users are considered in the best effort (BE) flows category
[12].
For VoIP application, we use “on” and “off”
Markov model
[12]. The probabilities of being in state 0 and state 1 is denoted by following
and
, respectively;
(6)
In video traffic model, source rate of 64 kbps is assumed. The size of these packets/slices is modeled as a truncated Pareto distribution
[12].
The initial packet arrival of the game is described by the uniform distribution
as;
≤ ≤
(7)
Web-browsing and database information retrieval are examples of interactive services in which a web-page consists of a main object and embedded
objects. The main object size and the embedded object size are generated by using truncated log-normal distribution
in (8), with the specific minimum, maximum, mean, and standard deviation values in [12]. The reading time and parsing time is calculated by using exponential distribution
in (9);
(8)
≥
(9)
The FTP session is a sequence of file transfers separated by reading times. The file of size is generated by using (8) while the reading time is calculated by using (9), with specific minimum, maximum, mean,
and standard deviation given in
[12]
.
2.3 QoS-aware Uplink Packet Scheduling in 3GPP LTE-A System
The scheduling in 3GPP LTE-A system is performed for each sub-frame, i.e., for each transmission time interval (TTI). To satisfy the QoS requirements of the users in each TTI, the frequency band should be allocated efficiently between the users. For efficient allocation of resources among the RT, NRT, and BE users, we use the exponential proportional fair (EXP/PF) scheduling algorithm
[15]which is the usual way of allocating the resources to
the users while considering the QoS. The novelty of
our work is related to the power control issues, that is, we controled the power of the users by considering the users service priority. EXP/PF algorithm distinguishes among RT, NRT and BE flows by giving the priority to the RT packets with respect to NRT flows. For RT flows, the metric is calculated as:
(10)
where
where
is instantaneous available data rate,
is available past data rate,
is the HOL packet delay,
is the packet delay threshold,
is the maximum probability that the packet delay increases the
, and
is the number of active RT flows.
EXP/PF algorithm handles NRT and BE flows, and the metric is expressed as;
(11)
Ⅲ. Uplink Power Control Schemes in 3GPP LTE-A System
The conventional and the proposed QoS aware power control schemes are based on fractional power control scheme. The major difference between the two schemes is the way they allocate the power to the users. In conventional FPC scheme, the power is allocated to users without considering their service priority. On the other hand, the proposed QoS-FPC scheme takes care of the users QoS requirements while allocating the power to the users. In this section, we first discuss the conventional fractional power control (C-FPC) scheme, and then the proposed QoS-FPC scheme is explained.
3.1 Fractional Power Control Scheme The C-FPC scheme allows the FUEs to transmit with power spectral density depending on their path
loss as in (12). The fractional path loss compensation is controlled with a factor
by the network
[16].
(12)
is the user transmit power spectral density.
is a parameter used to control the SINR target, i.e., user specific parameter related to target received SINR (see [17] for this relationship).
(13)
where,
-
is the target SINR.
-
is the noise power per PRB.
-
is the maximum power of user.
-
defines the number of PRBs for which theSINR target is reached with full power.
is pathloss compensation factor. This value controls the variance of the received SINR.
is the estimated pathloss.
All the compensation factors
(0.4, 0.5, 0.6, 0.7, 0.8, & 0.9) in the LTE standard have been simulated in combination with
between 0 and 30 dB. By simulations, is found to give an optimum users capacity
[18]. Based on these simulation results
[18], we used in our simulation environment to validate the proposed QoS-FPC scheme.
The C-FPC scheme allows the FUEs to transmit with PSD depending on their path loss, that is the FUEs with good channel condition will transmit with high PSD. However, there is no protection for the UL communication of MUEs and also no consideration on the QoS requirement of users (FUE and MUE). On the other hand, the proposed QoS-FPC scheme has the capability of limiting the cross-tier interference, and also control and optimize the FUE Tx power based on the QoS priority of FUEs and MUEs to mitigate the UL interference.
3.2 Proposed QoS-FPC Scheme
In this section, we propose a QoS-FPC scheme to
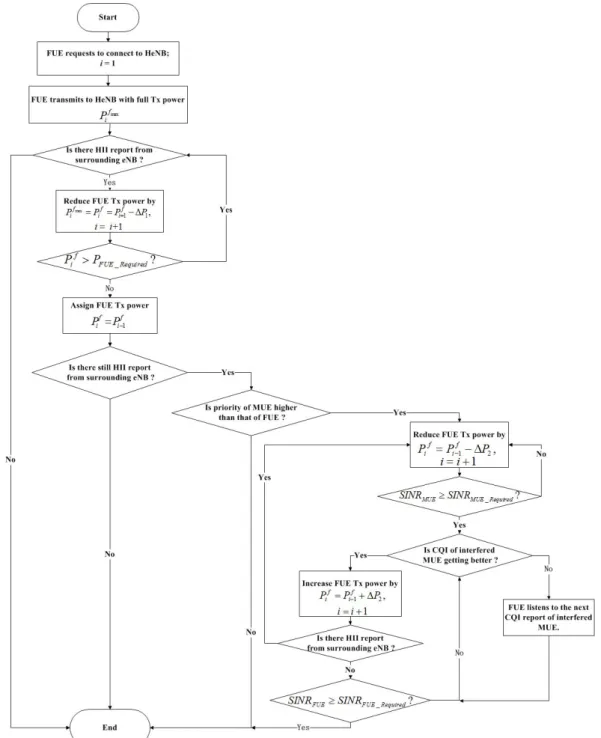
control and optimize the FUE Tx power and also to mitigate the cross-tier interference based on the QoS priority of users. The procedure of the QoS-FPC scheme consists of the following steps.
Step 1] Initialization
In this stage, we set interference increment threshold
which is pre-specified maximum cross-tier interference that eNB can tolerate.
Mathematically, this can be expressed as:
≥
(14)
where
is the interference from FUE to
eNB, and
is UE noise figure.
Step 2] Interference estimation and power allocation
Before the power control based on the QoS priority on users (FUE and MUE) begins, the eNB estimates the interference based on (14) and sets the initial maximum Tx power
for FUE by (15).
(15)
When eNB gets the interference from the FUE greater than the threshold level given by (14), then it broadcasts the high interference indicator (HII).
The HII report is generated by the eNB, while the HeNB receives this report from eNB via X2 interface between the eNB and HeNB
[19]. Hence, FUE can utilize the same HII information from HeNB. On the basis of HII report, FUE reduces its transmit power in a pre-specified
by (16) to maintain the users QoS requirement.
(16)
where
is the amount of power to be reduced at each iteration, and
is the
FUE Tx power out of total FUEs.
Step 3] QoS priority comparison among UEs
If the eNB is still reporting the HII when the
FUE Tx power is lower than its required power, then the power control of FUE will be based on the QoS priority of UEs at this step.
The UEs priority is defined by eNB by using
‘bearer models’ and the priority Table 1 as given in section 2.2. Based on the users QoS priority, the FUE power is further controlled. At this stage, UEs priorities are compared, i.e., whether MUE or FUE has higher priority. If MUE has higher priority, then the FUE Tx power is reduced by (17).
(17)
The reason behind choosing the
≥ is that when we have to sacrifice FUE in the extreme case i.e., there is no chance to save the user with low priority. Even in the extreme case, we still try the best to maintain the FUE link. So, the FUE Tx power is reduced till the SINR constraint in (18) is satisfied.
≥
(18) where
is MUE received SINR and
is the required SINR of MUE.
If interfered MUE is getting better CQI report because of moving away from the femtocell area, then the FUE Tx power is increased based on (19);
(19)
After increasing the FUE Tx power, it ensures whether there is a HII report from the eNB. If there is a HII report from that interfered MUE then FUE Tx power is reduced by (17). If there is no HII report then FUE Tx power is increased by (19) when the CQI of the interfered MUE is better;
otherwise, FUE Tx power remains same and make a decision based on the next CQI report of MUE.
The FUE Tx power adjustment will stop if the condition (20) is satisfied.
≥
(20)
Fig. 3. Proposed UL power control scheme based on QoS priority.
where
is FUE received SINR and
is the required SINR of FUE.
The complete procedure of the proposed QoS-FPC scheme is explained in the flow chart given in the Fig. 3.
Ⅳ. Performance Evaluation
4.1 Simulation Environment
In this section, we evaluate the performance of
the proposed QoS-FPC scheme by system-level
simulations. The simulation parameters are given in
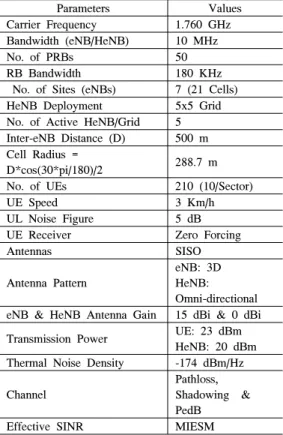
Parameters Values Carrier Frequency 1.760 GHz Bandwidth (eNB/HeNB) 10 MHz
No. of PRBs 50
RB Bandwidth 180 KHz
No. of Sites (eNBs) 7 (21 Cells) HeNB Deployment 5x5 Grid No. of Active HeNB/Grid 5 Inter-eNB Distance (D) 500 m Cell Radius =
D*cos(30*pi/180)/2 288.7 m
No. of UEs 210 (10/Sector)
UE Speed 3 Km/h
UL Noise Figure 5 dB
UE Receiver Zero Forcing
Antennas SISO
Antenna Pattern
eNB: 3D HeNB:
Omni-directional eNB & HeNB Antenna Gain 15 dBi & 0 dBi Transmission Power UE: 23 dBm
HeNB: 20 dBm Thermal Noise Density -174 dBm/Hz Channel
Pathloss, Shadowing &
PedB
Effective SINR MIESM
Table 2. System-level simulation parameters.
Application Traffic Category Percentage of Users Mixed Flows
FTP Best Effort 10 %
Web
Browsing/HTTP Non-real Time 20 %
Video Real Time 20 %
VoIP Real Time 30 %
Gaming Real Time 20 %
Individual Flows (Real Time)
Video Real Time 30 %
VoIP Real Time 50 %
Gaming Real Time 20 %
Individual Flows (Non-real Time & Best Effort)
FTP Best Effort 50 %
Web
Browsing/HTTP Non-real Time 50 %
Table 3. Percentage of users distribution for different traffic flows.
Table 2. To verify the proposed scheme, the system- level simulations are performed under the two-tier HetNet environment as shown in Fig. 1.
The performance is evaluated under the SISO antenna configurations. In addition, instead of full queue case simulations, the realistic traffic models are considered to assess the performance under typical traffic and load conditions. We simulate two cases of traffic flows, i.e., mixed flows and individual flows. In mixed flows, users’ applications are RT, NRT, and BE traffics, while in individual flows, it is either the RT traffic or simultaneous (NRT plus BE) traffic. The percentages of users distribution for dipfferent traffic flows are described in Table 3
[12]. The MUEs are dropped uniformly and randomly throughout the macro coverage area of indoors and outdoors. It’s possible that some MUE will be dropped into the HeNB area, and it is assumed that there is at least one FUE attached per HeNB. Total number of 5 HeNBs are placed randomly in the 5x5 Grid. Close access mode of
HeNBs are considered, i.e., a set of registered UEs belonging to closed subscriber group are only allowed to access a HeNB.
4.2 Simulation Results & Discussion
In this subsection, we compare the performance of C-FPC scheme and the proposed QoS-FPC scheme under the HetNet environment. The performance is evaluated by using the key performance indicators like per-UE SINR, users average throughput, users outage probability and packet loss rate.
4.2.1 Uplink Performance Evaluation by the Proposed QoS-FPC Scheme under Mixed Flows
Per-UE SINR] We compare the cumulative
distribution function (CDF) of per-UE SINR for the
proposed QoS-FPC scheme and the C-FPC scheme. We evaluate per-UE SINR at two important points, that is, 5 % and 50 % of CDF which represents the cell-edge and average per-UE SINR respectively.
From Fig. 4, it is clearly evident that SINR improves in the QoS-FPC scheme around 1.3 dB at a CDF of 5 % as compared to the C-FPC scheme.
At 50 % of CDF, the comparison clearly
describes the SINR remarkably improves from 3.6
dB to 5.8 dB (i.e., 61 %) by the QoS-FPC scheme.Fig. 4. Per-UE SINR under mixed flows using the C-FPC & the proposed QoS-FPC.
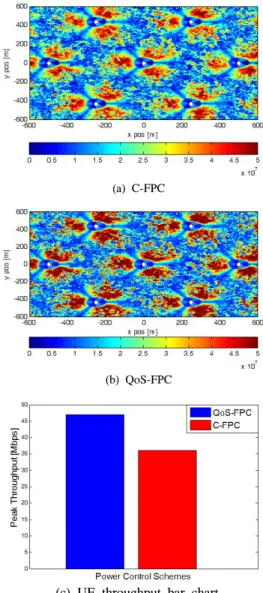
Fig. 5. UE throughput under mixed flows using the C-FPC & the proposed QoS-FPC.
(a) C-FPC
(b) QoS-FPC
(c) UE throughput bar chart.
Fig. 6. UE throughput under mixed traffic (a) C-FPC color map (b) QoS-FPC color map & (c) UE throughput bar chart.
The reason behind the improvement is that the QoS-FPC scheme considers the QoS requirements and priority among the users during the power allocation. As a consequence, the average per-UE SINR increases due to the less number of link failures.
Users Average Throughput] For aforementioned
mixed traffic case, we compare the UE average throughput performance using Fig. 5, at 5 % and 50
% of CDF. At 5 % of CDF, i.e., for cell-edge users,
the throughput is improved from 1.8 Mbps to 2.9
Mbps (i.e., 61 %) by the QoS-FPC scheme ascompared to the C-FPC scheme. At 50 % of CDF, the comparison clearly describes the throughput improvement from 6.2 Mbps to 10.3 Mbps (i.e., 66
%) by the QoS-FPC scheme. This improvement is achieved due to two main reasons, i.e., the proposed scheme always tries to fulfill the minimum data rate requirements, and takes care of the high priority
users, without simply decreasing the aggressor
power to reduce the interference. Therefore, the
per-user average throughput increases, which helps
to elevate the overall system throughput. The Fig. 6
(a) and (b) show the throughput color maps while
the Fig. 6 (c) explains the throughput color maps in
terms of the bar chart, for the conventional and the
proposed schemes. The gain of the QoS-FPC
scheme on overall system can be clearly seen from
the throughput color maps and the bar chart shown
in Fig. 6. The darker red color in Fig. 6 (b) as
compared to Fig. 6 (a) means the higher throughput
Fig. 7. FUE & MUE throughputs under mixed flows using the C-FPC & the proposed QoS-FPC.
Fig. 8. Interference under mixed flows using the C-FPC
& the proposed QoS-FPC.
Fig. 9. Users outage probability under mixed flows using the C-FPC & the proposed QoS-FPC.
of the users by using the proposed QoS-FPC scheme, and similarly the bar chart given in Fig. 6 (c) clearly indicates the superiority of the proposed scheme than the conventional scheme.
FUE & MUE Average Throughput ] In order to
further verify the superiority of the QoS-FPC scheme, we separately check the performance of FUE’s and MUE’s average throughput under mixed traffic case. In Fig. 7, we compare the throughput curves at 50 % of CDF, and find that the average throughput of MUEs and FUEs just reach to its maximum number of 4.9 Mbps and 5.7 Mbps, respectively by using the C-FPC scheme. However, for the proposed QoS-FPC scheme, the throughput further increases to its maximum number of 6.6
Mbps for MUEs, and 9.5 Mbps in the case of FUEs,by considering the QoS priority of the users. From Fig. 7. we can clearly observe that the proposed QoS-FPC scheme effectively improve the MUE’s and FUE’s throughput performance as compared to the C-FPC scheme, but more for FUE.
Users Received Interference ] In order to show
the interference reduction by employing the QoS-FPC scheme, users received interference is compared at very low level interference region, i.e., in the range of -80 dBm to –70 dBm. The results in Fig. 8. clearly demonstrate that, by the QoS-FPC scheme, around 35 % of total users lie in the mentioned low range of interference, while for the C-FPC scheme only 10 % of total users are in the specified low interference range. Hence, more number of users are receiving less interference in the QoS–FPC scheme as compared to the C-FPC
scheme. This ensures that by using the QoS-FPC scheme, the received level of interference at MUE decreases tremendously.
Users Outage Probability ] In this paper, the
users are considered in outage whenever the per-UE SINR falls below a prescribed SINR threshold value.
We can clearly see from the Fig. 9 that the outage probability of the proposed QoS-FPC scheme decreases as compared to C-FPC scheme by considering the users service priorities. Two schemes are specifically compared at the per-UE SINR value of 5 dB, where the QoS-FPC scheme shows around 41 % reduction in outage probability of the users as compared to C-FPC scheme.
4.2.2. Uplink Performance Evaluation by the Proposed QoS-FPC Scheme under Individual Flows
To further validate the proposed QoS-FPC
scheme, all the users are deployed according to the
Fig. 10. UE throughput under individual flows using the C-FPC & the proposed QoS-FPC.
Fig. 11. Interference under individual flows using the C-FPC & the proposed QoS-FPC.
individual flows distribution given in Table 3. The purpose of individual flows distribution is to verify in which matter the QoS-FPC scheme shows the different behavior from the mixed flows, in terms of system throughput performance gain and interference reduction by distributing users with the different percentage of applications.
In this experiment, first of all we distribute only RT users during the whole simulation run, and compare its gain with the C-FPC scheme. Similarly, we distribute (NRT plus BE) users according to the percentage mentioned in Table 3, and check the throughput performance gain under the QoS-FPC scheme. The results show almost similar behaviour as the mixed traffic flows, i.e., in the QoS-FPC scheme, users have high throughput gain, and the most of the users lie in the low level interference region in comparison with the C-FPC scheme.
However, the difference is found in the high throughput region where individual flows show different behavior from the mixed flows. In high throughput region of individual flows, it can be clearly seen that (NRT plus BE) users have high throughput values than RT users in both C-FPC and QoS-FPC schemes. The reason behind higher throughput in the case of (NRT and BE) is that RT users are not always in the active state to send the data.
We compare the throughput curves in Fig. 10, at 50 % of CDF, and find that the average throughput of RT users by using the C-FPC scheme just reach to its maximum number of 3.5 Mbps, and 4.2 Mbps for (NRT plus BE) flows. However, for the proposed QoS-FPC scheme, the throughput further reaches to its maximum number of 6.2 Mbps for RT flows, and 8.7 Mbps in the case of (NRT plus BE) users, due to the consideration on the QoS priority of users. This may attribute to the fact that the QoS-FPC scheme does not blindly increase the throughput by reducing the power of one specific user, i.e., either MUE or FUE, but intelligently reduces the power by fulfilling the QoS requirements of all the users. Hence, this results in the optimization of overall system and per-user throughput performance.
The interference reduction by the QoS-FPC scheme under the individual flows can be seen in Fig. 11. The figure clearly describes that by using the QoS-FPS scheme more number of users lie in the low interference region.
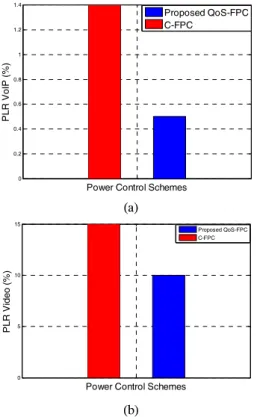
Furthermore, in order to verify the superiority of our proposed scheme, we also check the packet loss rate (PLR) of RT users. In particular, network performance of NRT and BE flows are evaluated by throughput, while for the RT flows, i.e., VoIP and Video, usually the PLR is used as a metric. The PLR for VoIP and video flows is plotted using bar chart for the proposed QoS-FPC and the C-FPC schemes as shown in Fig. 12. The PLR of VoIP and video flows shows that the proposed QoS-FPC scheme is able to provide the better QoS. From Fig.
12, it’s clear that PLR for VoIP and video is
reduced noticeably around 64 % and 33 % by the
proposed QoS-FPC scheme respectively from the
0 0.2 0.4 0.6 0.8 1 1.2 1.4
Power Control Schemes
PLR VoIP (%)
Proposed QoS-FPC C-FPC
(a)
0 5 10 15
Power Control Schemes
PLR Video (%)
Proposed QoS-FPC C-FPC
(b)
Fig. 12. Packet loss rates. (a) VoIP flows, (b) Video flows.
C-FPC scheme.
The PLR for each QCI is given in the Table 1, which varies with the service. In contrast to the non-congested scenario in Table 1
[14], we considered the congested scenario to derive the PLR performance of the proposed QoS-FPC scheme in this paper, which results in more packet delays and then increased PLR.
Ⅴ. Conclusions
In this paper, the QoS-FPC scheme is proposed which has the capability to limit the cross-tier interference below a given threshold at eNB by the optimization of femtocell users’ power allocation at each adjustment phase. Furthermore, the proposed scheme considers the QoS priority among users during the power allocation phase. As a result, it always fulfill the demands of high priority users by maintaining the threshold requirement of the low priority users. The proposed scheme has been
validated by system-level simulations, and the simulation results show remarkable reduction in cross-tier interference. Moreover, the users’ average throughput increases around 66 % as compared to the C-FPC scheme. Therefore the proposed QoS-FPC scheme is suitable for the reduction of cross-tier interference in the 3GPP LTE-A HetNet, by protecting the eNB UL communication and optimization of system throughput performance.
References
[1] J. Zhang and G. Roche, Femtocells:
Technologies and Deployment, New York:
Wiley, 2009.
[2] V. Chandrasekhar, J. Andrews, and A.
Gatherer, “Femtocell networks: A survey,”
IEEE Commun. Mag., vol. 46, no. 9, pp.
59-67, Sept. 2008.
[3] H. Kim, Y. Jo, J. Lim, and D. Hong,
“Interference mitigation by joint employment of power control and almost blank subframes in heterogeneous networks,” J-KICS, vol. 39A, no. 1, pp. 62–64, Jan. 2014.
[4] H. S. Jo, C. Mun, J. Moon, and J. G. Yook,
“Interference mitigation using uplink power control for two-tier femtocell networks,” IEEE
Trans. Wireless Commun., vol. 8, no. 10, pp.4906-4910, Oct. 2009.
[5] K. Safjan and I. Klaus, “Automatic methods for HetNet uplink power control optimization under fractional load,” in Proc. PIMRC, pp.
3056-3060, London, Sept. 2013.
[6] K. Safjan and C. Rosa, “Open loop power control parameter settings impact on LTE HetNet uplink performance,” in
Proc.Commun., pp. 1134-1138, Budapest, Jun. 2013.
[7] T. Kastirinogiannis and S. Papavassiliou,
“Service-oriented utility-based uplink power control in two tier femtocell networks,” in
Proc. Future network & mobile summit, pp.1-9, Warsaw, Jun. 2011.
[8] 3GPP TR 36.814, Further advancements for
E-UTRA physical layer aspects, V9.0, Mar.2010.
[9] 3GPP TSG RAN R4-092042, Simulation
assumptions and parameters for FDD HeNB RF requirements, WG4 Meeting 51, 2009.[10] H. Claussen, “Efficient modeling of channel maps with correlated shadow fading in mobile radio systems,” in Proc. IEEE PIMRC, pp.
512-516, Berlin, Sept. 2005.
[11] Technical clarifications of recommendation
ITU-R M.1225, Guidelines for evaluation of radio transmission technologies for IMT-2000,Tech. Rep., 1997.
[12] 3GPP TSG-RAN, R1-070674, LTE physical
layer framework for performance verification,Meeting 48, 2007.
[13] 3GPP TS 36.300, Evolved universal terrestrial
radio access (E-UTRA) and evolved universal terrestrial radio access network (E-UTRAN),V11.4, 2011.
[14] 3GPP TS 23.203, Group services and system
aspects; policy and charging control architecture, V8.9, 2008.[15] J. Rhee, J. Holtzman, and D. Kim,
“Scheduling of real/non-real time services:
adaptive EXP/PF algorithm,” in Proc. IEEE
VTC, pp. 462-466, Apr. 2003.[16] 3GPP TS 36.213, E-UTRA Physical layer
procedures, V8.1, 2008.[17] 3GPP TSG-RAN, R1-074850, Uplink power
control for E-UTRA– range and representation of P0, WG1 51, Ericsson, 2007.[18] A. Simonsson and A. Furuskar, “Uplink power control in LTE overview and performance,” in
Proc. IEEE VTC, pp. 1-5, Calgary, Sept. 2008.[19] 3GPP TR 36.921, Home eNode B (HeNB)
radio frequency (RF) requirements analysis,V10.0, 2011.
이쉬티아크
(Ishtiaq Ahmad)
2007년 7월 : N.W.F.P UET, Peshawar, Pakistan (공학사) 2007년~2009년 : BSS Engineer
O&M Dept., ZONG, Pakistan
2009년~현재 : Lecturer, IET Dept., Gomal University, Pakistan (On Study Leave)
2012년~현재 : 인하대학교 전자공학과 대학원 (석사 과정)
<관심분야> OFDM/MIMO, 3GPP LTE-A HetNet, Cooperative Communication.
지 산
(Zeeshan Kaleem)
2007년 7월 : N.W.F.P UET, Peshawar, Pakistan (공학사) 2007년~2008년 : Lecturer, IET
Dept., Gomal University, Pakistan
2010년 8월 : 한양대학교 전기 공학 무선 통신 대학원 (공 학석사)
2010년~2011년 : Lecturer, Namal College (Associate College of Bradford University, UK)
2011년~현재 : Lecturer, COMSATS IIT, Pakistan (On Study Leave)
2012년~현재 : 인하대학교 전자 공학과 대학원 (박사 과정)
<관심분야> OFDM/MIMO, 3GPP LTE-A HetNet,
Cooperative Communication.
장 경 희