http://dx.doi.org/10.7848/ksgpc.2015.33.6.485
Estimation of the Crustal Deformation Caused by Earthquake and Its Use in Updating Published Coordinates of Geodetic Control Points - A Case Study of the 2011 Tohoku Earthquake’s Impact in
South Korea
Cho, Jae Myoung
1)Abstract
The Tohoku Earthquake, which hit Japan on March 11, 2011, was a massive magnitude 9.0 earthquake, with the earthquake itself causing damage and the resulting tsunami additionally causing enormous material and human damage. The crustal deformation at that time reached a maximum of 5.24 m in Japan, Neighboring countries South Korea and China as well as the Southeast Asian region also witnessed crustal deformation ranging from a few centimeters to a few meters. The detailed analysis in this study based on data from 72 of the sites in South Korea where GNSS CORS was installed showed that South Korea underwent heterogeneous crustal deformation from the Tohoku earthquake, with a maximum of 55.5 mm, a minimum of 9.2 mm, and an average of 22.42 mm. A crustal deformation model was developed, applied, and evaluated for accuracy in this study for a prompt revision of the survey results of the control points that were changed by the crustal deformation. The survey results were revised by applying a crustal deformation model to the 1,195 unified control points installed in South Korea prior to the Tohoku earthquake. The comparison of these 1,195 points with their new survey results showed that the RMSE decreased from 14.1 to 3.4 mm and that the maximum result difference declined from 39 to 10 mm. Revision of the survey results of the control points using the crustal deformation model is deemed very useful considering that the accuracy of the survey results of the unified control points in South Korea is 3 cm.
Keywords : 2011 Tohoku Earthquake, Crustal Deformation, Unified Control Points
Original article
Received 2015. 11. 24, Revised 2015. 12. 11, Accepted 2015. 12. 24
1) Member, Dept. of Civil Engineering, Songwon University (E-mail: [email protected])
This is an Open Access article distributed under the terms of the Creative Commons Attribution Non-Commercial License (http://
1. Introduction
The 2011 earthquake off the Pacific coast of Tohoku (hereinafter, “Tohoku Earthquake”) was a magnitude 9.0 earthquake that occurred at 70 km off the coast of Sanriku, Japan, at a depth of 30 km, at 14:46 KST (05:46 UTC) on March 11, 2011. It was not only the strongest earthquake that ever occurred in Japan but was also the fourth most powerful earthquake that ever occurred in the world after 1900 (USGS, 2011; NPA, 2015). While massive earthquakes like the Tohoku Earthquake lead to instantaneous and direct damage such as loss of human lives and destruction of houses, they
also cause long-term damage such as ground subsidence, uplift, crustal deformation, and the shifting of the Earth’s rotation axis, which can impact the planet’s environment and ecosystem. Actually, the Tohoku Earthquake moved towards the northeastern area of Japan at a maximum distance of 5.24 m and an average distance of 2.4 m horizontally, and a maximum distance of 0.699 m vertically. As a result, the whole of Japan suffered heterogeneous crustal deformation and ground subsidence, and this subsidence of the eastern coast caused a change in the coastline (ARIA, 2011).
Calculations also show that the Japan quake could have
shifted the position of the Earth’s figure axis (the axis about
486
which the Earth’s mass is balanced) by about 17 cm towards 133 degrees east longitude, causing the Earth’s rotation period to become shorter and the length of a day to be reduced by 0.0000018 seconds (NASA, 2011).
As aforementioned, an earthquake can have a tremendous impact and can cause massive damage in terms of its targets and ranges, and a large-scale earthquake can have a worldwide impact. The crustal deformation caused by the Tohoku Earthquake reached not only Japan but also the Korean Peninsula, China, Russia, and the Southeast Asian region, which were close to its epicenter. South Korea suffered a crustal deformation of about 2 cm (SUWN), China 0.3 cm (WUHN), and Russia 1 cm (IRKT), based on the IGS (International GNSS Service) global stations (Gu and Wang, 2011).
The crustal deformation that occurs due to a massive earthquake like the Tohoku Earthquake is huge and heterogeneous. Basic and public surveying in South Korea determine the coordinates of unknown points by performing network adjustments, with the survey results of the control points being fixed points after the relative distances from the control points, such as the GNSS CORS (Continuously Operation Reference Stations) or the unified control points, to the unknown points are measured. Therefore, the survey results of the control points (i.e., the precision of the baseline distance between the control points) greatly affect the quality of the survey results. When the baseline distance between the control points is changed by heterogeneous crustal deformation, network adjustment after the survey made without considering this change may lead to low-quality survey results because the change in the baseline distance will remain a survey error (Leick, 2004; Cho et al., 2011).
Japan, where a 5m maximum crustal deformation was observed after the Tohoku Earthquake, completely stopped providing the survey results of VLBI, GEONET (GPS observation network), triangulation points, and benchmarks on March 14, 2011, three days after the earthquake. It considered the stabilization time of post-seismic crustal deformation and started providing revisions of the survey results of GEONET on May 31, 2011, and those of the triangulation points and benchmarks on Oct. 31, 2011 (Hiyama et al., 2011).
Japan, which is often hit by earthquakes, conducted
numerous revisions of survey results of the control points associated with crustal deformations before the Tohoku Earthquake. To efficiently revise the survey results of many control points within a short period, a crustal deformation model was applied. PatchJGD, developed by Geospatial Information Authority of Japan, is a program designed for revising the survey results of the control points through a crustal deformation model. It can revise not only the survey control points but also diverse spatial information (Tanaka et al., 2007).
Cho et al. (2011) calculated the crustal deformation of the Korean Peninsula on ordinary days without earthquakes, and the relative baseline distances between the GNSS CORS, through a precise analysis of the 30-month data from the 45 GNSS CORS in and around South Korea. They suggested the use of a crustal deformation model to revise the GNSS CORS survey results every decade, and to improve the DGPS accuracy.
As the survey results of control points are the base data for all national spatial information, any change in locations bigger than the stipulated accuracy must be dealt with by providing new survey results within the shortest time. GNSS CORS can calculate the most recent survey results instantly by using permanent data, but unified control points and triangulation points cannot allow instant calculation, and their calculation entails much time and expense as it requires new surveying.
The crustal deformation in South Korea due to the Tohoku Earthquake was calculated in this study through a precise analysis of the GNSS CORS data. An experiment was conducted using a revision method through crustal deformation modeling as a way of revising the survey results of unified control points within a short time. The revised survey results were compared with the actual survey results to evaluate accuracy and usability.
2. Analysis of Crustal Deformation Using GNSS CORS
2.1 Strategy of GNSS CORS data processing
The precise survey results of the GNSS CORS in South
Korea before and after the Tohoku Earthquake were
compared in this study to analyze the crustal deformation in South Korea caused by the quake. GAMIT/GLOBK, a program developed by MIT for GNSS precise baseline analysis and network adjustment, was used for GNSS CORS data processing. The survey results of the GNSS CORS in South Korea are being calculated using GNSS data precise analysis programs such as GAMIT/GLBOK, GIPSY-OASIS II, and BERNESE. Each of these precise analysis programs,
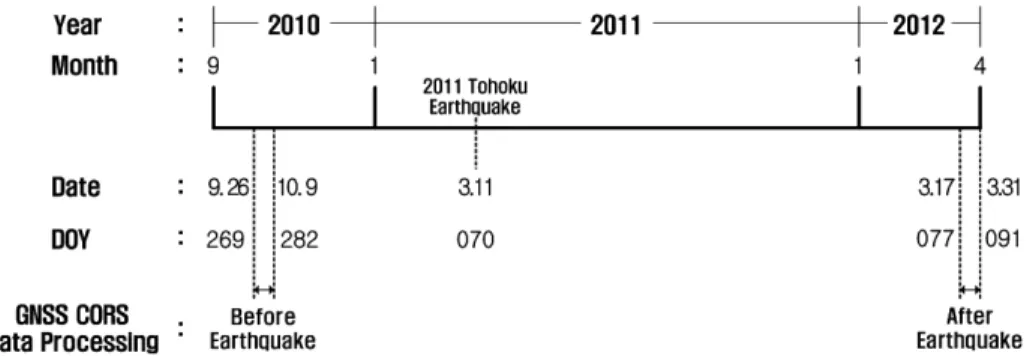
however, can yield different results when a different analysis strategy (IGS global network, reference frame, stabilization site, data acquisition period, etc.) is applied. Therefore, the GNSS CORS locations before the quake were processed by applying the same baseline analysis and network adjustment strategy before and after the quake, without using the survey results announced by the National Geographic Information Institute (NGII), to calculate new locations and to remove the Fig. 1. GNSS CORS data processing period for calculating the crustal deformation caused by the Tohoku Earthquake
Management agency (No. of CORS)
NGII (44) LX
(2) NMPNT
(26)
Station Name
BOEN INJE SEOS ANSG ANHN MOOJ
CHCN JAHG SNJU CHWN CCHJ PALM
CHEN JEJU SONC CCHN PYCH
CHJU JINJ SOUL DANG SEJU
CHLW JUNG SUWN DOKD SEOI
CHNG JUNJ TABK EOCH SOCH
CHSG KANR TEGN GASA SOHE
CHYG KIMC WNJU GEOM SORI
CNJU KUNW WOLS HGDO ULLE
DOND KWNJ WULJ HOMI YNDO
GOCH MUJU YANP JEOJ YNJU
GSAN NAMW YECH JUKB
HADG NONS YONK JUMN
HONC PAJU YOWL MARA
INCH PUSN MLDO
Table 1. Status of the GNSS CORS in South Korea for crustal deformation analysis (as of Mar. 11, 2011)
488
systematic error during the calculation.
The crustal deformation that accompanies an earthquake can be divided into pre-, co-, and post-seismic crustal deformation based on the timing. Most earthquakes cause fine and unstable crustal deformation before and after their occurrence. The crustal deformation generated during an earthquake can be partly recovered over a few days or months (Sato et al., 2011). This is due to the restoring force based on the elastic rebound theory of the ground or the continuous movement of the unstable ground. Therefore, the GNSS CORS locations must be calculated at sufficiently stabilized periods of the crustal deformation both before and after an earthquake. The sufficiently stabilized periods selected in this study were 6 months (2010.740-2010.773) before the Tohoku Earthquake (2011.192) and 12 months (2012.211- 2012.249) after the quake. The data from the IGS stations and GNSS CORS in South Korea for 14 days in each period were processed and averaged to obtain the location survey results before and after the quake.
As of March 11, 2011, when the Tohoku Earthquake occurred, NGII provided the GNSS CORS data of a total of 72 stations. Two of these stations were GNSS CORS managed by Korea Land and Geospatial Informatix Corporation (LX), while 26 stations were managed by the National Maritime PNT Office (NMPNT). A precise analysis of the 72 stations was performed in this study after checking if there was any GNSS CORS that had changed its survey results due to relocation, antenna replacement, etc. during the data processing period (Oct. 2010-Mar. 2012), for crustal deformation calculation.
The GNSS CORS data processing period and locations are shown in Fig. 1 and Table 1, respectively.
2.2 GNSS CORS data processing
GAMIT/GLOBK was used in GNSS CORS data processing, and 「combining the global and local quasi- observation solutions」 (Cho, 2006) was applied as a baseline and network adjustment processing strategy for the analysis of the crustal deformation in South Korea caused by the Tohoku Earthquake. Baseline processing was performed by connecting 72 GNSS CORS in South Korea (including SUWN) and 9 IGS stations around South Korea (including 5 core site stations and DAEJ). Subsequently the global and
local quasi-observation data of 284 global IGS stations were combined. The GNSS CORS in South Korea and the IGS stations around South Korea that were used for the baseline analysis are shown in Fig. 2 and 3, respectively, and in Table 1 and 2.
Fig. 2. GNSS CORS in South Korea used for the analysis of the crustal deformation caused by the Tohoku
Earthquake
Fig. 3. IGS stations in East Asia used for the analysis of the
crustal deformation caused by the Tohoku Earthquake
2.3 Quality of GNSS baselines processing and network adjustment
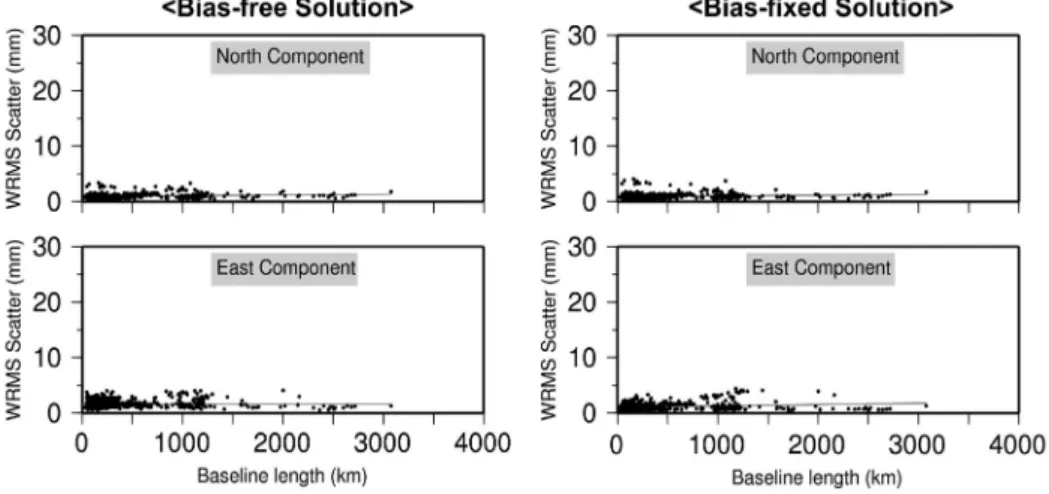
The quality of the GNSS baseline processing can be assessed using repeatability of the independent baseline components (Duong et al., 2005; Herring et al., 2015a).
The mean WRMS (weighted RMS) of the daily baseline processing results by bias-free and bias-fixed solutions in this study is shown in Table 3. The bias-fixed solution that had a small average WRMS between the two solutions was used in this study.
Fig. 4 shows the baseline component repeatabilities vs. the
baseline length. The maximum baseline length was about 3,200 km, the maximum WRMS of the north component in the bias-fixed solution was 4.5 mm, and the maximum WRMS of the east component was 4.6 mm. The average WRMS for the entire baseline was 1.4 mm.
The quality of the global network adjustment of the GNSS CORS in South Korea and the IGS global stations can be evaluated based on the reference variance (
arccos
cos
cos
cos
sin
sin
), with the value of 1 as excellent (Herring et al., 2015b). As the reference variance that was obtained in this study by combining the network adjustment of a local network and that of an IGS network was 0.995, the result of the network adjustment was considered excellent.
2.4 Crustal deformation in South Korea caused by the Tohoku Earthquake
Based on the results of the GNSS data processing, the Nation Station Name IGS Core Site
Korea SUWN
DAEJ
Japan
AIRA USUD
TSKB ○
Chinese
WUHN ○
BJFS ○
SHAO
Russia IRKT ○
YSSK ○
Table 2. IGS stations in East Asia used for the analysis of the crustal deformation caused by the Tohoku Earthquake
Solution type Mean WRMS (mm)
North East
bias-free 0.9 1.6
bias-fixed 0.9 1.1
Table 3. Mean WRMS of the baselines from the daily solution
Fig. 4. Baseline component repeatabilities vs. baseline length (the thin line represents the best-fitting line)
490
horizontal displacements of the IGS stations in East Asia caused by the Tohoku Earthquake are shown in Fig. 5 and Table 4. The horizontal displacements of the GNSS CORS in South Korea are shown in Fig. 6 and Table 5. The displacement of the TSKB station in Japan was the biggest (60.3 cm) among the targeted IGS stations. The displacement of the SUWN station in South Korea was about 2.2 cm, and that of the WUHB station in the southeastern part of China was 0.7 cm (Fig. 5). Among the GNSS CORS in South Korea, the DOKD station, which is closest to the epicenter of the
quake, had the highest displacement (5.6 cm), while the MARA station, which is farthest from the epicenter, had the lowest displacement (0.9 m).
The analysis results of the vectors of the crustal deformation in South Korea and East Asia caused by the Tohoku Earthquake showed that the direction of the crustal deformation was towards the epicenter of the quake located in the coast of Sanriku in eastern Japan, The magnitude of the crustal deformation tended to decrease with the distance from the epicenter.
Station D
N(mm) D
E(mm) D
S(mm)*
AIRA 3.0 17.0 17.3
BJFS 1.0 12.0 12.0
DAEJ 2.0 29.0 29.1
IRKT 5.0 13.0 13.9
SHAO 2.0 12.0 12.2
SUWN 1.0 22.0 22.0
TSKB 34.0 602.0 603.0
USUD 48.0 239.0 243.8
WUHN -1.0 7.0 7.1
YSSK -7.0 7.0 9.9
Table 4. Horizontal displacements of the IGS stations in East Asia caused by the Tohoku Earthquake
*
arccos
cos
cos
cos
sin
sin
Fig. 5. Horizontal displacements of the IGS stations in East
Asia caused by the Tohoku Earthquake Fig. 6. Horizontal displacements of the GNSS CORS in
South Korea caused by the Tohoku Earthquake
3. Update of the Survey Results of the Unified Control Points Using the Crustal
Deformation Model
3.1 Installation status of the unified control points in South Korea
A unified control point is the control point that unifies the triangulation point (the control point of a horizontal survey) and the benchmark (the control point of a vertical survey). It is the name of the control points that are being installed in South Korea. NGII started installing unified control points in 2008, and it targets to have installed about 7,000 by 2018. The installation locations and quantities of unified control points by year are shown in Fig. 7.
Staion D
N(mm) D
E(mm) D
S(mm) Station D
N(mm) D
E(mm) D
S(mm) Station D
N(mm) D
E(mm) D
S(mm)
ANHN 1.2 17.5 17.6 HOMI 5.9 27.9 28.6 PUSN 5.7 22.6 23.3
ANSG 1.6 23.1 23.2 HONC 0.7 27.7 27.7 PYCH 2.1 27.7 27.8
BOEN 2.7 21.9 22.1 INCH 1.5 21.7 21.7 SEJU 4.8 25.6 26.0
CCHJ -1.2 30.9 30.9 INJE 0.2 29.9 29.9 SEOI 5.6 17.8 18.7
CCHN 1.8 26.1 26.2 JAHG 3.9 14.5 15.0 SEOS 1.9 18.9 19.0
CHCN 1.0 26.6 26.7 JEJU 3.7 10.3 11.0 SNJU 3.4 22.9 23.1
CHEN 0.7 21.7 21.7 JEOJ -1.4 32.1 32.1 SOCH 0.0 15.1 15.1
CHJU 3.2 10.3 10.7 JINJ 4.4 18.7 19.2 SOHE 2.4 9.9 10.2
CHLW 0.0 26.0 26.0 JUKB 3.8 33.0 33.2 SONC 3.8 16.4 16.8
CHNG 4.9 21.2 21.8 JUMN 1.1 31.0 31.0 SORI 3.6 14.7 15.1
CHSG 4.2 26.7 27.0 JUNG 2.8 17.0 17.2 SOUL 0.8 22.4 22.4
CHWN 5.9 20.1 20.9 JUNJ 2.7 17.7 17.9 SUWN 0.9 22.4 22.4
CHYG 1.5 19.1 19.1 KANR 1.1 32.9 32.9 TABK 2.9 30.9 31.0
CNJU 2.5 20.9 21.0 KIMC 5.1 21.2 21.8 TEGN 4.8 22.9 23.4
DANG 3.2 11.8 12.2 KUNW 4.2 24.8 25.1 ULLE 4.3 46.2 46.4
DOKD 5.9 55.4 55.7 KWNJ 3.1 15.7 16.0 WNJU 1.5 25.9 25.9
DOND 0.4 23.7 23.7 MARA 2.9 8.7 9.2 WOLS 6.7 24.5 25.4
EOCH 1.9 16.1 16.2 MLDO 2.3 15.7 15.9 WULJ 3.7 32.3 32.5
GASA 2.8 11.4 11.7 MOOJ 3.8 20.5 20.8 YANP 1.7 24.6 24.6
GEOM 4.3 12.8 13.5 MUJU 3.3 20.2 20.4 YECH 3.3 26.1 26.3
GOCH 4.3 20.7 21.1 NAMW 4.0 17.9 18.3 YNDO 6.2 20.0 20.9
GSAN 1.9 23.0 23.1 NONS 2.9 19.9 20.1 YNJU 2.9 25.1 25.2
HADG 4.2 18.3 18.8 PAJU 0.5 22.0 22.0 YONK 3.1 15.4 15.7
HGDO 2.0 10.6 10.7 PALM 0.8 19.9 20.0 YOWL 2.4 28.1 28.2
Table 5. Horizontal displacements of the GNSS CORS in South Korea caused by the Tohoku Earthquake
Fig. 7. Installation locations and quantities of unified
control points in South Korea by year
492
3.2 Update strategy of the survey results of the unified control points
NGII surveyed and completed the public announcement of the results of the 1,195 unified control points installed between 2008 and 2010 in Dec. 2010. No unified control point was installed in 2011, the year the Tohoku Earthquake occurred, and the installation restarted in 2012. The Tohoku Earthquake generated heterogeneous crustal deformation in South Korea, as seen in Fig. 6 and Table 5, and it affected the locations of the points installed before the quake.
As the heterogeneous crustal deformation led to changes in the relative distances between the control points, any survey using these points without considering such changes will obtain erroneous results (Cho et al., 2011). Therefore, if the crustal deformation caused by a quake exceeded the required survey quality, the survey results of the control points must be updated.
In the case of the GNSS CORS, the survey results after a quake can be updated within a comparably short time so stations are constantly acquiring data before and after a quake. In the case of the unified control points, however, update of their survey results after a quake entails much time and expense as new surveys need to be conducted.
Futhermore, unified control points cannot be used before the update of survey results. A crustal deformation model for GNSS CORS data processing was applied in this study as a way of updating the survey results of the unified control points displaced by an earthquake within a short time. Also, the accuracy of the survey results updated using the crustal deformation model was evaluated using the survey data obtained at some of the unified control points after a quake.
The survey results of the 1,195 unified control points installed before the Tohoku Earthquake were updated using the crustal deformation model, and the survey results of the points installed after the quake were updated using the
surveyed data (Fig. 8). NGII performed new GNSS surveys after the Tohoku Earthquake on 119 common points, which were among the unified control points installed before the quake. These data were used to evaluate the accuracy of the survey results update using the crustal deformation model.
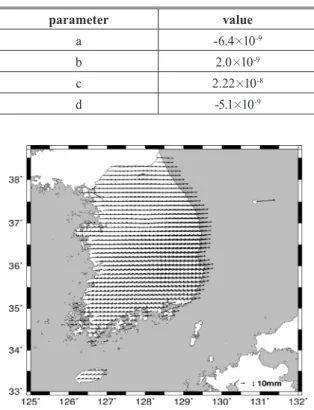
3.3 Crustal deformation model for the Tohoku Earthquake
The crustal deformation model for updating the survey results of the unified control points was used for calculating the GNSS CORS dislocations in South Korea presented in Table 5. As the results of the detailed analysis of the GNSS CORS data show, the direction of the crustal deformation in South Korea caused by the Tohoku Earthquake was towards the epicenter of the quake, and the magnitude of the crustal deformation tended to decrease linearly with the distance from the epicenter. The crustal deformation model was obtained by applying the linear model equation used by Hiyama et al. (2011) for the revision of the survey results of the control points in Japan after the Tohoku Earthquake. The crustal deformation according to the GNSS CORS location can be expressed by the following equation:
arccos
cos
cos
cos
sin
sin
(1)
where
arccos
cos
cos
cos
sin
sin
,
arccos
cos
cos
cos
sin
sin
: latitude and longitude of the GNSS CORS where
arccos
cos
cos
cos
sin
sin
,
arccos
cos
cos
cos
sin
sin
: latitude and longitude displacements of the GNSS CORS
The equation for obtaining the correction parameters a and b is expressed by applying the least square method to equation (1) (Cho et al., 2004) as follows:
arccos
cos
cos
cos
sin
sin
(2)
where
arccos
cos
cos
cos
sin
sin
Correction parameters c and d can be calculated in the same manner using longitudinal displacement.
The crustal deformation that occurred at a certain point Fig. 8. Update strategy of the survey results of the unified
control points
Estimation of the Crustal Deformation Caused by Earthquake and Its Use in Updating Published Coordinates of Geodetic Control Points - A Case Study of the 2011 Tohoku Earthquake’s Impact in South Korea
in South Korea can be expressed as equation (3) by applying the correction parameters obtained in equation (2) and the weighting on the Earth’s spherical distance.
arccos
cos
cos
cos
sin
sin
(3)
where