1. Introduction
Rice (Oryza sativa L.) is one of the most important crops within Asia, grown by almost two billion people and consumed by more than four billion of people (FAO, 2016). Harvesting is considered as one of the important operations in rice production system. Rice with a higher harvest moisture content (HMC) may produce a higher head rice recovery (HRR) but could
incur greater drying costs than rice with a lower HMC, whereas rice with a lesser HMC saves on drying costs but could yield less HRR than rice with a greater HMC.
This balance between high and low HMC claims a problem to rice producers because they can optimize net value (NV) or HRR by choosing an HMC. The time of harvest is very crucial that directly influences the economic return in terms of field yield (FY), milling quality that includes percent milled rice (PMR) and
Artificial Neural Network-based Model for Predicting Moisture Content in Rice Using UAV Remote Sensing Data
Tapash Kumar Sarkar*, Chan-Seok Ryu *
†, Jeong-Gyun Kang*, Ye-Seong Kang*, Sae-Rom Jun*, Si-Hyeong Jang*, Jun-Woo Park* and Hye-Young Song*
*Department of Bio-Systems Engineering, College of Agricultural and Life Science, Gyeongsang National University (Institute of Agriculture and Life Science)
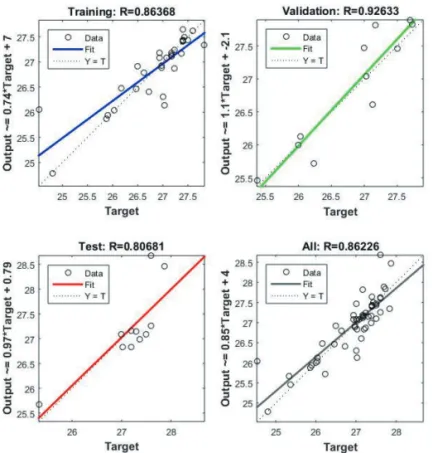
Abstract : The percentage of moisture content in rice before harvest is crucial to reduce the economic loss in terms of yield, quality and drying cost. This paper discusses the application of artificial neural network (ANN) in developing a reliable prediction model using the low altitude fixed-wing unmanned air vehicle (UAV) based reflectance value of green, red, and NIR and statistical moisture content data. A comparison between the actual statistical data and the predicted data was performed to evaluate the performance of the model. The correlation coefficient (R) is 0.862 and the mean absolute percentage error (MAPE) is 0.914% indicate a very good accuracy of the model to predict the moisture content in rice before harvest. The model predicted values are matched well with the measured values (R
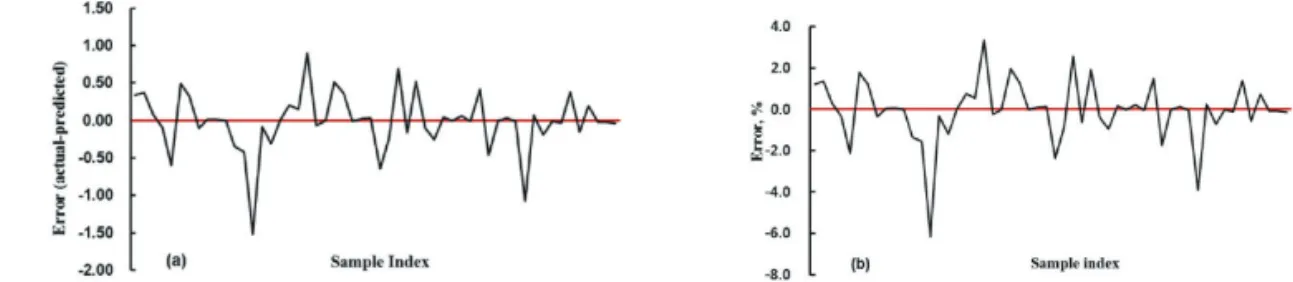
2= 0.743, and Nash-Sutcliffe Efficiency = 0.730). The model results are very promising and show the reliable potential to predict moisture content with the error of prediction less than 7%. This model might be potentially helpful for the rice production system in the field of precision agriculture (PA).
Key Words : ANN, Moisture content, Model simulation, Precision agriculture, UAV remote sensing Korean Journal of Remote Sensing, Vol.34, No.4, 2018, pp.611~624
http://dx.doi.org/10.7780/kjrs.2018.34.4.4 ISSN 1225-6161 ( Print )
ISSN 2287-9307 (Online)
Article
Received June 15, 2018; Revised July 16, 2018; Accepted August 17, 2018; Published online August 24, 2018
† Corresponding Author: Chan-Seok Ryu ([email protected])
This is an Open-Access article distributed under the terms of the Creative Commons Attribution Non-Commercial License
(http://creativecommons. org/licenses/by-nc/3.0) which permits unrestricted non-commercial use, distribution, and reproduction in
any medium, provided the original work is properly cited.
HRR, and drying cost (Lu et al., 1992; Siebenmorgen et al., 1992). Rice after harvesting is usually sent to the rice processing center (RPC) and dried in a mechanical way especially by heated air flows in drying facilities.
Drying fee increases with HMC and it reaches double as $24.50 Mg
-1when the HMC is greater than or equal to 22% compare to HMC at less than or equal to 13%
(Nalley et al., 2016). Rice drying is an energy-intensive process (Verma, 1994; Thakur and Gupta, 2006). More than 90% of total energy required for parboiling and drying operations in a rice milling process (Islam et al., 2004). It is also revealed from the studies that fissures in the kernel will develop when rice at low MC (≤15%) is exposed to environments that cause the dry rice kernels to rapidly absorb moisture (Kunze and Prasad, 1978; Siebenmorgen and Jindal, 1986). Similarly, harvesting rice at a high MC (≥22% for long-grain cultivars) also creates a large share of broken kernels as a result of milling a greater number of undeveloped kernels (Siebenmorgen and Qin, 2005; Siebenmorgen et al., 2006; Bautista et al., 2007). Harvesting rice with a moisture content above 25% is not acceptable because of high drying cost and on an average, head rice recovery drops steadily at the moisture content below 20% (Cnossen and Siebenmorgen, 2000).
Another study shows that the moisture content less than 15% or higher than 22% incur the significant loss to the producer (Lu et al., 1995). Therefore, a need for an active way by which moisture content of paddy can be monitored as well as predicted before harvest with reasonable accuracy, and reliability.
Remote sensing, which is regarded as the science of attaining information from the earth surface without contact, is becoming increasingly important and gaining attention in many fields nowadays. Over the years, remote sensing is getting its way into rice crop management systems and the practices of precision agriculture (PA). Precision agriculture or precision farming implies an information and technology-based farm management system which helps to identify,
analyze and manage variability within fields for optimum profitability, sustainability and protection of the farm field (Banu, 2015). Numerous study on Crop- yield prediction using remotely sensed data has already represented a very active field of research and application (Prasad et al., 2006; Manjunath et al., 2002;
Salazar et al., 2007). There are several studies on rice quality such as prediction of protein content at ripening stage from satellite image (Asaka and Shiga, 2003), prediction of grain protein content using hyperspectral imagery (Ryu et al., 2007), and monitoring the drying facilities using NIR sensors (Kawamura et al., 2003).
Remote sensing has been applied more in the fields for
monitoring the quality such as maize (Volkers et al.,
2003), barley (Pettersson et al., 2006) and wheat
(Hansen et al., 2002) than rice crop. Moreover, remote
sensing techniques are capable of predicting and
monitoring crop growth stages, crop vigor, biomass,
crop classes and crop yield predictions, also making
conclusions about the status of plants as well as their
environmental conditions on a very nearly real-time
basis (Islam et al., 2008). However, the application of
satellite-based images cannot fulfill the specific
requirements of PA technology. The satellite images for
application of PA are inconvenient in terms of spectral
and temporal resolution and can be affected by varying
weather conditions (Stafford, 2000). Owing to achieve
the intra-field crop monitoring system in a reliable
manner, a high spatial and temporal resolution imagery
is prerequisite. Unmanned air vehicles (UAVs) allow
us to perform many attention-grabbing and quantitative
observations at better spatial and temporal resolution
and lower costs compare to airborne platforms or
satellites (Table 1). In terms of remote sensing data
acquisition, the UAV is a reliable platform that can fly
in accordance with the preprogrammed route and
capture the high resolution image, often in order of
centimeters at specific locations, a value that greatly
improves the normal resolution of an aerial or satellite
platform. It has a higher capability in getting the
high-frequency image collection over the satellites.
Moreover, compared to airborne remote sensing, the UAV can easily achieve over 90% overlap image which is advantageous for homogeneous canopy mosaicking in image preprocessing. The UAV can provide real-time results to the users that help to take decision instantly.
With the advancement of the UAV technique in recent years, a good numbers of research on monitoring the crops and prediction of yield and protein content using different sensors attached to an UAV have been conducted (Bendig et al., 2014; Berni et al., 2009; Hunt et al., 2010; Kalisperakis et al., 2015; Zarco-Tejada et al., 2012; Sarkar et al., 2018). In the field of PA, most of the studies focused on crop growth, yield, and protein content monitoring but lack of attention to monitoring moisture content (MC) before harvest which is an important operation in rice production systems.
This article, in principle, is focused on the using of UAV remote sensing in predicting rice moisture content before harvest to minimize the loss, drying cost and ensure its quality.
The performance of a certain model mostly depends on the number of factors such as the data volume, selection of model, the methods applied for validating the results, and the measures employed for comparison.
Traditionally, statistical methods are used for prediction and classification. However, regression models are not impeccable in forecasting or predicting complicated situations such as non-linear and extreme value data because of the linear relationship between the parameters. Hence, artificial neural network (ANN) is greatly applicable to very complex relations and
scenarios where there are strong non-linearity between different variables and parameters. ANN is considered for the researcher as vital tools as these are able to compute data classification, non-linear function approximation, clustering, and simulation. Thus, ANN methods have appeared as a very important tool for a wide range of applications together with forecasting crop yield in areas where traditional statistical techniques have previously been applied (Paswan et al., 2013). A neural network integrated approach is useful for rice field mapping and prediction of crop yield (Chen et al., 2007; Jiang et al., 2010). An artificial neural network- based model has been applied for predicting rice yield using satellite data (Akhand et al., 2018). The capability and the reliability of ANN model for predicting moisture in maize have already been developed using different sensors (Abdulkadir et al., 2012). ANN refers to a mathematical model that process information in such a way that the biological neural system as like the human brain process the information (Saravanan et al., 2012). By virtue of this intellectual features, ANN can be used to build a model to predict moisture content of rice before harvest. Besides, ANN involves self- learning, compatibility and flexibility capabilities. The objective of the study is to develop a prediction model in order to predict moisture content of rice before harvest using UAV remote sensing data.
As problems exist with traditional statistical modeling (especially regression models) of nonlinear functions with multiple factors in the cropland ecosystem, this paper aims to describe as an effective application of an artificial neural network in developing a model for predicting moisture content in rice before harvest.
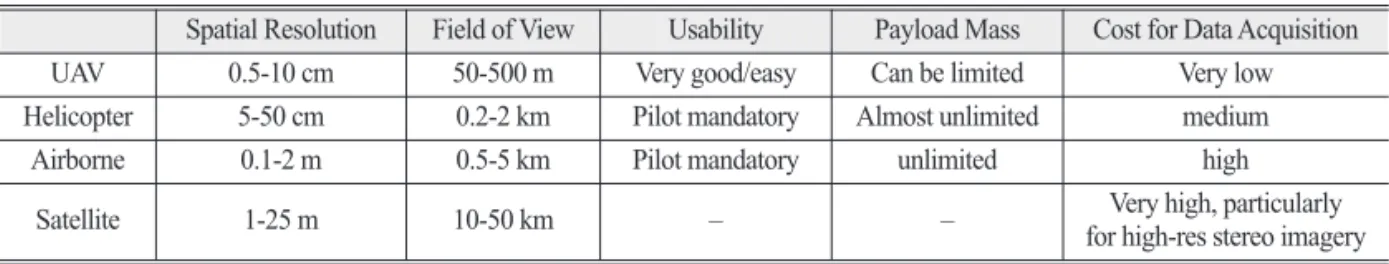
Table 1. Comparison of UAV with other manned and satellite platforms
Spatial Resolution Field of View Usability Payload Mass Cost for Data Acquisition
UAV 0.5-10 cm 50-500 m Very good/easy Can be limited Very low
Helicopter 5-50 cm 0.2-2 km Pilot mandatory Almost unlimited medium
Airborne 0.1-2 m 0.5-5 km Pilot mandatory unlimited high
Satellite 1-25 m 10-50 km – – Very high, particularly
for high-res stereo imagery
2. Materials and Methods 1) Study Site
The study was conducted at Pyeongteak in the southern part of Gyeonggi-do province in South Korea (latitude: 37° 1′ 34.4″ N, longitude: 126° 49′45.2″ E, UTM Zone 52S, Elevation 27 m). Under the study, approximately 240 ha of land comprising 54 rice fields ranged between 0.3 and 0.5 ha was covered (Fig. 1).
Regular farmland management was adopted by the rice processing center (RPC) for each of the field throughout the growing season.
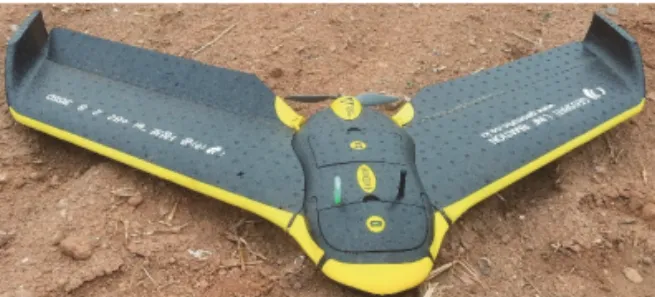
2) Platform and Sensor for Image Acquisition The image acquisition was carried out by NIR imaging sensor in NIR camera (S110, CMOS, Canon, Japan) mounted with fixed-wing UAV (eBee, senseFly, Switzerland) (Fig. 2).
The computer-based flight plan software on the ground (eMotion, senseFly, Switzerland) controlled the flight path to acquire the image of the paddy field. The flight plan, sensor, and image specifications are shown in Table 2. The NIR camera comprises three bands to be exact as green, red, and NIR. The NIR variant provides NIR at 850 nm, red at 625 nm, and green at 550 nm band data. The NIR variant features custom
Fig. 1. Geographic location of the study area. Plus signs (on the right, with green color) represent the region of interest (ROI) at sampling point. Coordinate system is referred to Korea 2000 Korea Central Belt 2010 (Projection: Transverse Mercator, Central Meridian: 127.0, Latitude of Origin: 38.0, Azimuth: 315°).
Fig. 2. Image of UAV used for image acquisition.
Table 2. Flight plan, camera, sensor, and image specifications
Parameters Values
Flying altitude (m) 133
Area covered 2.389 km
2/238.29 ha Flight time
(around 12:00 at local time) 11/09/2016 Camera resolution 4048×3048 (12.1 Mpixel)
Sensor 1/1.7″ back-illuminated CMOS
Maximum f/number f/2.0
Maximum shutter speed 1/2000s Still Image Aspect Ratio 4:3
Camera shooting mode Continuous Spectral bands 3 (green, red, and NIR)
Output formats JPEG and RAW
Weight of the camera Approx. 153 g (5.4 oz) excl. battery Total number of images
of each flight 892
Ground resolution before
mosaic (cm) 4.26
Ground resolution after
mosaic (cm) 4.26
filters, which capture Near Infrared information in the blue channel. The low altitude remote sensing platform UAV was operated by an autopilot associated with autonomous flight (eMotion2, senseFly, Switzerland) comprises differential GPS (DGPS), 3-axis accelerometer, gyros, and a 3-axis magnetometer. Three successive flights were launched on September 11, 2016 to acquire the image of the rice fields. The flight was operated at a height of approximately 133 m from the ground to take the image and the ground resolution was 4.26 cm during the flight. The UAV was connected to the radio link that transmitted the position, altitude, and the status of the flight at 2.4 GHz frequency within 3 km range.
The pursuit of image acquisition was performed at midday to reduce the influence of the incident light angle and dew on the leaf surface (Onoyama et al., 2013).
3) Image Processing
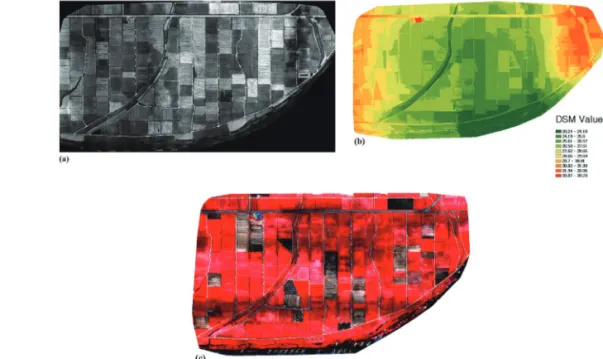
The images acquired from numerous flight were combined through gyro and GPS data using the flight plan software. Hereafter, the image was mosaicked considering each band using UAV mapping software
(Pix4D mapper pro, Pix4D, Switzerland) and finally 8 bit/pixel tagged image file format (TIFF) was produced (Fig. 3).
The UAV mapping software along with GCPs was employed owing to identify the sampling point in the georeferenced image. Hence, Region of interest (ROI) in the image was fixed and finally, the reflectance at each sampling point in the image was calculated by the image processing software (ENVI 4.7, Exeils Visual Information Solution Inc., USA). To compensate for the illumination and atmospheric effect, a reflectance panel was set in the middle of the field. The adjusted reflectance spectrum of the canopy at the sampling points was calculated from the mean spectral value of the canopy (Ref
canopy) dividing by the mean spectral value of the reference board (Ref
board) to minimize solar- induced disturbances (Ryu et al., 2014) as shown in equation (1).
Ref
adj= (1) 4) Sampling and Moisture Content
Measurement
Koshihikari, the most popular rice variety was grown Ref
canopyRef
boardFig. 3. (a) Mosaicked NIR image (b) Digital Surface Model (DSM) and (c) CIR image of the study area.
in each field for the year 2016. Sampling was done on September 11, 2016 at the time of image acquisition at the geo-referenced points. The image acquisition and sampling were performed synchronously one week before harvesting the rice. During sampling, the GPS location in every field was recorded. Ten hills from each of the field were harvested manually and threshed immediately after harvesting in the field. After threshing, the moisture content of rice was measured by Wile 78 Crusher (FARMCOMP OY, Jusslansuora 8, Tuusula, Finland).
5) Artificial Neural Network Fitting Tool (nftool)
ANN fitting tool was applied to develop a model for predicting moisture content for this study using MATLAB R2015a (The Mathworks, Inc., Natick, MA, USA). Typically, ANN refers to the interconnected nodes known as neurons, processing elements or units:
the basic building block to produce a network which acts in the same manner as the human central nervous system does. Basically, ANN states that as a “black box” approach. According to ‘black box’ technology, ANN has the potential to learn input-output correlation by training the input in order to produce an expected output (Ismael et al., 2011). In order to perform a particular task, NN training is accomplished by adjusting the weight and bias values between the elements. As a result of the adjusting or training the network, a particular input (target value) leads to a certain output (Beale et al., 1992). It is very important to select the appropriate training function for NN toolbox software and for building neural network-based model. For this model, ‘trainlim’ train function is employed as is the fastest training function for the back- propagation algorithm, in addition, it is the default training function for the feed-forward network that produces different weight and bias values in accordance with Levenberg-Marquardt optimization. ANN fitting tool is used for static fitting problems with standard
two-layer feed-forward neural network trained with Levenberg-Marquardt (LM) algorithm. Training of data in this tool is done automatically with scaled conjugate gradient and performance is evaluated by using mean square error (MSE) and regression analysis. The range of the presented data to the network is automatically mapped into -1 to 1. In accordance with a pre-defined percent of data division, the input data are divided randomly into training, validation and testing data set.
Hence, the whole data are divided randomly into 60%
training, 20% validation, and 20% for testing.
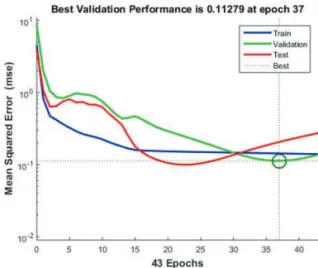
Here, training data are used to adjust the weight of the network as per estimated error between the target (input) and predicted (output) in the network. The validation data are used for generalization of the network and to stop training when generalization stops improving. The testing data have no effect on the training data and it generates an independent measure of the performance of the network during and after the training. In principle, the number of neurons in the hidden layer is increased when the network is not performing well after training. The training stops automatically when generalization stops improving which is indicated by the increase of the MSE of the validation sample. Every attempt of training, the network yields different results owing to different initialization of the connecting weights and different initial condition (Beale et al., 1992).
6) Model Evaluation
Standard regression coefficients and error indices were calculated for evaluating the proposed model.
Pearson’s correlation coefficient (R) and coefficient of
determination (R
2) define the degree of collinearity
between measured and simulated data. The R values
lie between 0 and 1 while R=0 indicates no relationship
exists and R=1 or -1 means a perfect positive or
negative linear relationship exists. Similarly, the
proportion of the variance in measured values is
described by R
2. The ranges of R
2are from 0 to 1, with
higher values indicate less error variance, and typical values greater than 0.5 are considered acceptable (Santhi et al., 2001; Van Liew et al., 2003). The normalized statistic, Nash-Sutcliffe efficiency (NSE) describes the relative degree of the residual variance (“noise”) associated to the measured data variance (“information”) (Nash and Sutcliffe, 1970). NSE indicates how perfect the plot of observed and predicted data fits the 1:1 line. The NSE lies between -∞ and 1 (1 inclusive). The NSE value 1 indicates the optimal value as the best fit. The values between 0 and 1 are generally considered as acceptable levels of performance, while values ≤0 indicates that the mean observed value is the better predictor than the predicted value, that denotes unacceptable performance. The mean absolute error (MAE), mean square error (MSE), root mean square error (RMSE), and mean absolute percentage error (MAPE) are the error indices used for the model evaluation. RMSE, MAE, and MSE values of 0 define a perfect fit of the model. The MSE value zero refers to no error and greater than 0.667 means higher error.
The RMSE and MAE values less than half of the standard deviation of the measured values are considered appropriate for model evaluation and considered as low error. In addition, for model evaluation, if MAPE calculated value is less than 10%, it is interpreted as an excellent accurate prediction, between 10% - 20% good prediction, between 20% - 50% acceptable prediction and over 50% is considered inaccurate prediction (Lewis, 1982). The standard regression and error indices are calculated by the following equations:
Root mean square error
RMSE = (MC
i(actual)– MC
i(pred))
2(2) Mean absolute percentage error
MAPE = | | × 100 (3)
Mean absolute error
MAE = | MC
i(actual)– MC
i(pred)| (4)
Coefficient of determination
R
2= [ ]2 (5)
Nash-Sutcliffe efficiency (NSE)
NSE = 1 – [ ] (6)
where n is the total number of samples, MC
i(actual)is the actual target of the i
thtraining example, and MC
i(pred)is the output predicted by the neural network.
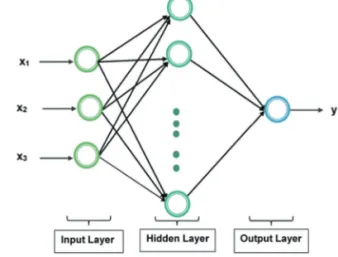
7) Proposed Model Structure
The ANN architecture used for this study is shown in Fig. 4. In this study, input (x
1as green, x
2as red, and x
3as NIR) is a 3×54 matrix, representing static data of 54 samples with 3 elements to present to the network.
And, target (y as MC) is a 1×54 matrix, representing static data: 54 samples of 1 element that defining desired network output which denotes the moisture content of rice. All samples are organized in matrix columns.
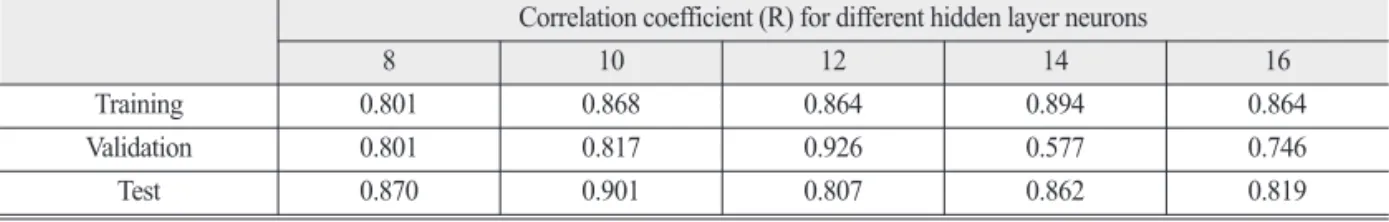
The proposed model has an input layer with three inputs (green, red, and NIR spectral reflectance values), one hidden layer with 12 neuron associated with a sigmoid activation function ø, defined by the logistic function: ø = 1/(1 + exp(-x), where, x is the
1 n
∑
n i=11 n
∑
n i=1(MC
i(actual)– MC
i(pred)) MC
i(actual)1 n
∑
n i=1n(∑MC
acMC
pred) –(∑MC
ac)(∑MC
pred) [n∑(MC
ac)
2–(∑(MC
ac)
2] [n∑(MC
pred)
2–(∑MC
pred)
2]
n
∑(MC
i(actual)– MC
i(pred))
2i=1 n
∑(MC
i(actual)– MC
i(mean))
2i=1