Vol.34, No.4 pp. 293~298, 2010 (ISSN-1598-5725)
A Case Study on the Evacuation Times on a Training ship
Kwang-il Hwang*
* Department of Mechanical and Information Engineering, Professor, Korea Maritime University, Busan, 606-791, Korea
Abstract : The residential comfort and safety on ship are more focused than ever, in accordance with the increase of the crews' onboard time and interest in cruiser sailing. To grasp the safety characteristics on ships against various scenarios of evacuations, this study performed experiments and simulations for the evacuation times on a training ship. Through the experiments, the average walking speed is 3.0m/s on 100% visibility, and 1.2m/s on 8% visibility, but the speeds go down 1.3m/s and 0.7m/s, respectively, when obstacles are happened without any previous notification. From the simulation, it is clearly reconfirmed that the worse visibility and many people make evacuation time comparatively longer. And unlike the common expectation of the effect of emergency announcement, the difference of evacuation times between cases of announcement and non-announcement is negligible on this study. From the survey after experiments, it is known that experiment participants feel unsafe and fear when the evacuation routes are longer in bad visible condition, even if they know the perfect evacuation route. And the survey results also show that the evacuees give more careful consideration to make a evacuation route decision under bad visibility.
Key words : Marine, Safety, Evacuation, Risk Management, Simulation
* Corresponding Author, [email protected] 051)410-4368
1. Introduction
Lately, because of the FTA(Free Trade Agreement) between countries of overseas, the crews' onboard time is increased, and because of the personal economic growth, the cruiser travel is not a leisure of the riches any more, but start to be positioned as a normal leisure in Korea.
These social situation make the ship designers and builders focus on the residential comfort, safety and working conditions on ships. On the safety point of view, because most of the ships are designed by under the regulations of IMO and SOLAS, they are evaluated as comparatively safer than any other vehicles. It means that every ship has her own emergency guidebook at every corner, which includes fire extinguishing, life vest, evacuation route, and all that sort of things.
But contrary to common expectation, various risk management scenarios and those countermeasure manuals for the emergency which can be happened on ships during navigation are not prepared yet for every ship. And more over, even if the countermeasures are ready, the effect of the ready-made risk management manuals are only remained as documents on papers, that means those are not verified in actual fact and/or simulated yet.
As well as the crews, the guests on cruiser and passenger ships, who are not accustomed to life on ship
and structure of ship, should be surely protected from any disasters on ships to minimize the human casualties by the verified risk management manual.
Until now, a few numbers of researches like the spread of fire and/or harmful gases, and functionalities of fire fighting utilities have been performed(Han and Cho, 2005, Choi et al, 2007), but unfortunately, the researches related to the evacuations and human activities under the emergencies on ships are not easy to find(Lee et al, 2003).
Considering the above mentioned situations, this study performed evacuation experiments and computer simulations with various conditions which can be happened on training ship. And I hope that these results can give ship designers basic inspiration how to make scenarios as countermeasures for disasters on ships.
2. The training ship and simulation model
2.1 Outlines of the training ship
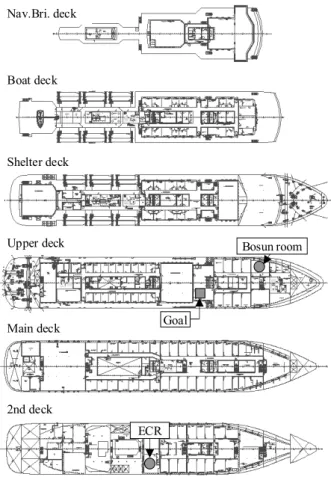
On this study, a training ship, named Hanbada, which was built in December 2005 to educate the students for navigation officers and marine engineers, was used for the experiments and simulations. The specifications of the ship are summarized in Table 1, the external appearance and internal layouts are Fig. 1 and Fig. 2. As shown in Fig. 1 and Fig. 2, this ship consists of 6 decks ; 2nd deck, Main
1) Some contents of this chapter are quoted from reference [7] and modified and supplemented with originality on this study.
deck, Upper deck, Shelter deck, Boat deck, and Navigation and bridge deck (hereafter abbr. as Navi. Bri. deck) from bottom to top.
Table 1 The specifications of the training ship
Length 117.20 m Width 17.80 m
Gross Ton 6,686GT DLWL 5.9 m
People Total 246 (Crew 42, Trainee 204) Speed Max. 19, Av. 17.5 kts
Fig. 1 The external appearance of the training ship
Nav.Bri. deck
Boat deck
Shelter deck
Main deck
2nd deck Upper deck
Goal
Bosun room
ECR
Fig. 2 The internal layouts of the training ship
2.2 Modeling for simulation
Except the cargo and engine room areas, all the other areas on this training ship, like cabin, restaurant, lecture, conference, recreation, health center, corridor, and open spaces et al., are included as modeling zone for simulation.
On the other hand, to simplify the modeling, the watertight door which has a specified function for emergency is neglected and treated as like other normal door.
On this study, EvE version 1.0.2 is used as a modeling tool(Safety at Sea Ltd., 2009), which directly and easily imports CAD data without any transformations. Fig. 3 shows the modeling outputs of the training ship by EvE.
Fig. 3(a) Modelings of the training ship, vertical drawing
Fig. 3(b) Modelings of the training ship, plane drawing
3. Evacuation experiments on the training ship1)
The reference value of average walking speed on flats, upstairs, downstairs for various ages are presented on MSC/Circ.1033(IMO, 2002). But because the interior structure and fitting conditions of ship deeply affect to the walking speed, it’s very careful to use this references directly for this study.
On this study, to specify the walking speed affected by the characteristics of the training ship, totally 80 volunteers are participated in the walking speed experiments on the training ship in fact. Their personal characteristics are as
followings; 22~27 ages, male 80% and female 20%, previously experienced this ship for a 5-days in basic naval architecture class.
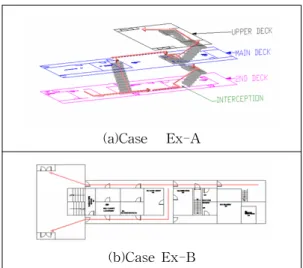
From the fire accident records on ship for years, engine room and chemical room are known as main places where the fire started from. The experimental evacuation routes are determined as Fig. 4 with reference to Fig. 2, which start from ECR(Engine Control Room, located in 2nd deck) and Bosun room(storage room for chemical materials, located in Upper deck) to End position(located in Upper deck). The distances from ECR to Goal and Bosun room to Goal are 41m and 24m, respectively.
(a)Case Ex-A
(b)Case Ex-B
Fig. 4 Evacuation routes for experiments
And to find out the effect by visibility, 100% and 8%
visibilities are given to experiment participants as condition, Fig. 5 shows the differences of visibilities. Under these visible conditions, the experiments are repeatedly performed with following cases.
① Visibility 100% without obstacle
② Visibility 100% with obstacle
③ Visibility 8% without obstacle
④ Visibility 8% with obstacle
With obstacle and without obstacle conditions are given to evaluate the effect of obstructions on evacuation passages which reported many times on fire disaster records. On this study, the obstacle are activated and given as door close without announcement.
As abbreviated nomenclature, Case Ex-A means the evacuation route from ECR to Goal, and Case Ex-B means from Bosun room to Goal. Fig. 6 shows the evacuation experiments scenes on passage way of a experiment participant who wears plastic glasses of visibility 8%.
Visibility Sample A Sample B
100%
8%
Fig. 5 Visibility differences(photos from 50cm)
(a)Start (b)Between stairs (c)Goal Fig. 6 Photos of evacuation experiments on the ship
Fig. 7 and Table 2 show the experiments results. From the results, it is clearly understood that the walking speeds are dependent on the visibility and obstacles.
When the visibility is 100% and without obstacle conditions, the average walking speeds are nearly 3.0m/s, but the speeds go down to one-third if the obstacle happened with the same visibility. Despite the differences of evacuation routes and distances between Case Ex-A and Case Ex-B, the evacuation time differences are negligible for 100% visibility, as listed on Table 2.
When the visibility is worsened to 8%, in contrast to the results from visibility 100%, the average walking speeds of Case Ex-B is one-third of those of Case Ex-A, although the obstacle is not given. From the survey after experiments, it is known that experiment participants feel unsafe and fear when the evacuation routes are long in bad visible condition, even if they know the perfect evacuation route.
And the average walking speeds without obstacle under the 8% visibility are 1.3~1.7 times faster than those of with obstacle condition. Comparing to the 100% visibility results which differ 3 times, these are faster than normal expectation. The survey results explain that the evacuees give careful consideration to evacuation route decision under the 8% visibility comparing to the 100% visibility.
Therefore, ship designers should pay attention to the evacuee's feeling on distances which affect to the walking speeds.
Without obstacles on the way With obstacles on the way
Case Ex-A (starting from
ECR)
0 50 100 150 200
0 1 2 3 4 5 6 7 8 9 10
Nth people
Evacuation time[sec]
Visibility 100%
Visibility 8%
0 50 100 150 200
0 1 2 3 4 5 6 7 8 9 10
Nth people
Evacuation time[sec]
Visibility 100%
Visibility 8%
Case Ex-B (starting from
Bosun room)
0 50 100 150 200
0 1 2 3 4 5 6 7 8 9 10
Nth people
Evacuation time[sec]
Visibility 100%
Visibility 8%
0 50 100 150 200
0 1 2 3 4 5 6 7 8 9 10
Nth people
Evacuation time[sec]
Visibility 100%
Visibility 8%
Fig. 7 Evacuation times : without obstacles on the passageway
Table 2 Average evacuation times in cases Vis.1) AET2)
[sec]
Dist.3) [m]
AES4) [m/s]
Case Ex-A
Without obstacle
100% 13.6
41
3.0
8% 35.1 1.2
With obstacle
100% 32.3 1.3
8% 59.4 0.7
Case Ex-B
Without obstacle
100% 7.8
24
3.1
8% 54.2 0.4
With obstacle
100% 23.7 1.0
8% 71.2 0.3
1)Vis.
2)AET 3)Dist.
4)AES
: Visibility
: Average evacuation time [sec]
: Distances
: Average evacuation speed [m/s]
4. Evacuation simulation
To predict and analyze the characteristics of evacuation on ships under the various conditions, Evi version 3.5.3 is used(Safety at Sea Ltd., 2009). Evi has very special and true-to-life functions, like various different functionalities of passenger and crew, dynamic door, ship motion, fire and smoke effect et al.
To Compare the simulation results with the experimental results of Case Ex-A, the route of evacuation simulation is decide to start from ECR to Goal positions. Namely, the
average walking speeds of 3.0m/s for 100% visibility and 1.2m/s for 8% visibility will be given to the simulation tool as input data. And under the following conditions, simulations are carried out.
① Visibility : 100%, 8%
② The number of people : 1, 5, 10, 20, 30
③ Open and/or close of doors in main stairs
④ All the cases are run 50 times in order to get a reasonable confidence in the results, according to the latest version of the IMO Interim Guideline
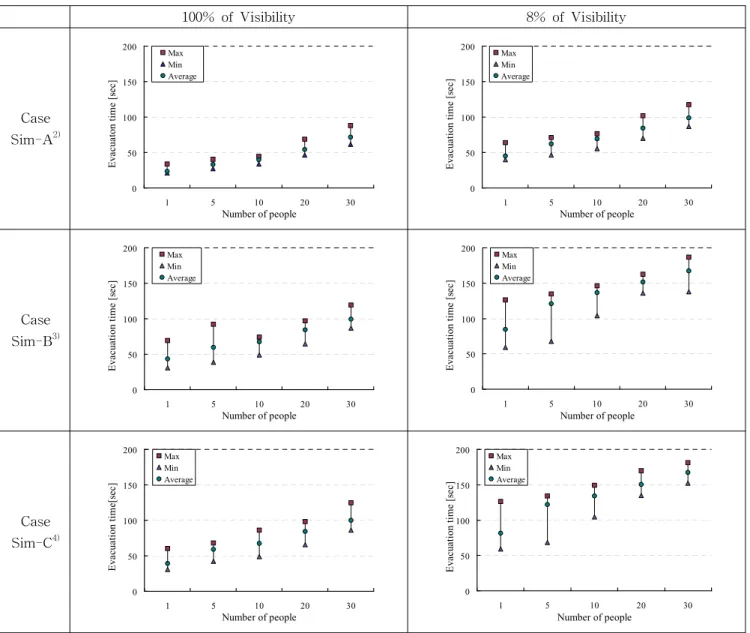
Finally, following 3 cases are established for the simulations, based on the above mentioned conditions.
① Case Sim-A : Non obstacles on passage way
② Case Sim-B : Main stair be closed + Not announced
③ Case Sim-C : Main stair be closed + Announced
The simulation results are shown on Fig. 8. As assumed, the evacuation times are varied and find out that those are depended on the evacuation routes that the agents in simulation tool took.
When the visibility is 100%, the evacuation time of Case Sim-A is 87% faster than Case Sim-B in case of 1 evacuee, and it goes down to 37.8% speed differences in case of 30 evacuees. But when the visibility is 8%, the differences are 86% and 69%, respectively. In other words,
100% of Visibility 8% of Visibility
Case Sim-A2)
0 50 100 150 200
1 5 10 20 30
Number of people
Evacuaton time [sec]
Max Min Average
0 50 100 150 200
1 5 10 20 30
Number of people
Evacuation time [sec]
Max Min Average
Case Sim-B3)
0 50 100 150 200
1 5 10 20 30
Number of people
Evacuation time [sec]
Max Min Average
0 50 100 150 200
1 5 10 20 30
Number of people
Evacuation time [sec]
Max Min Average
Case Sim-C4)
0 50 100 150 200
1 5 10 20 30
Number of people
Evacuation time[sec]
Max Min Average
0 50 100 150 200
1 5 10 20 30
Number of people
Evacuation time [sec]
Max Min Average
2)Case Sim-A : Non obstacles on passage way
3)Case Sim-B : Main stair is closed, but the fact is not announced to agents 4)Case Sim-C : Main stair is closed, and the fact is announced to agents
Fig. 8 Simulated evacuation times
it is clearly reconfirmed that the worse visibility and narrow passage way by many people make evacuation time comparatively longer.
Unlike the common expectation on the effect of emergency announcement, the differences of evacuation times between Case Sim-B and Case Sim-C are negligible in both 100% and 8% visibilities. The short distances of the evacuation routes could be a considerable reason, and alternative routes located near by could be another.
5. Conclusion
To analyze the safety characteristics on ships at various scenarios of evacuations, this study performed experiments
and simulations for the evacuation times on a training ship.
Following results are obtained.
1) Through the experiments done by 80 active participants, it is clearly understood that the walking speeds are dependent on the visibility and obstacles. The average walking speed is 3.0m/s on 100% visibility, and 1.2m/s on 8% visibility, but the speeds go down 1.3m/s and 0.7m/s, respectively, when obstacles are appeared without any previous notification.
2) From the simulation, it is obviously reconfirmed that the evacuation times are varied according to the visibility and the evacuation routes that the evacuees took. And unlike the common expectation of the effect by emergency announcement, the difference of evacuation times between
cases of announcement and non-announcement is negligible on this study.
3) The survey results taken after experiments show that the experiment participants feel unsafe and fear when the evacuation routes are long in bad visible condition, even if they know the perfect evacuation route. And it also show that the evacuees give more careful consideration to make a evacuation route decision under bad visibility.
References
[1] Choi, B. I., Han, Y. S., Oh, C. B., Kim, M. B., Kim, C.
(2007), "The Assessment of Fire Suppression Capability of Water-Mist System for Machinery Engine Room", Journal of Korean Institue of Fire Science &
Engineering, Vol.21, No.2, pp.111~117
[2] Han, W. H. and Cho, D. H. (2005), "Smoke Movement Characteristics in the Ship's Indoor Spaces with Fire Size and Location", Journal of the Korean Society of Marine Environment & Safety, Vol.11, No.1, pp.53~59 [3] Hwang, K. I., Shin, D. K., Kim, Y. J., Uoun, J. H., Lee,
S. I. and Hong, W. H. (2009), "A Case Study on the Passengers’ Evacuation Times according to the Fire Smoke Density on a ship", Journal of Korean Society of Marine Engineering, Vol. 33, No.2, pp.336~343
[4] IMO, MSC/Circ.1033 (2002), "Interim Guidelines for Evacuation Analyses for New and Existing Passenger Ships"
[5] Lee, D. K., Kim, H. T. and Park, J. H. (2003), " Human Behavioral Experiment for Evacuation Analysis", Journal of the Society of Naval Architecture of Korea, Vol.40, No.2, pp.41~48
[6] NIST (2009), Fire Dynamics Simulator (Version 5) User’s Guide
[7] Safety at Sea Ltd. (2009) ; EvE User Manual - Example Evacuation Analysis of IMO Ship
[8] Safety at Sea Ltd. (2009) ; Evi - Guidance for Validating/Verifying Evi to MSCCirc.1033, Annex 3
Received 24 March 2010 Revised 14 April 2010 Accepted 28 April 2010
![Table 2 Average evacuation times in cases Vis. 1) AET 2) [sec] Dist. 3)[m] AES 4)[m/s] Case Ex-A Withoutobstacle 100% 13.6 41 3.08%35.11.2 With obstacle 100% 32.3 1.38%59.40.7 Case Ex-B Withoutobstacle 100% 7.8 24 3.18%54.20.4 With obstacle 100% 23](https://thumb-ap.123doks.com/thumbv2/123dokinfo/5193380.351589/4.892.70.437.617.867/table-average-evacuation-times-withoutobstacle-obstacle-withoutobstacle-obstacle.webp)