INTRODUCTION
Colorectal cancer (CRC) is third most frequently diagnosed ma-
lignancy in both sex groups worldwide. CRC incidence rates per 100,000 cases are 46.5 and 35.2 for males and females, respectively.
For both sex groups, CRC is also the third leading cause of can- cer-related deaths globally. Age-standardized mortality rates per 100,000 CRC-related deaths are 17.3 and 12.2 in males and fe- males, respectively [1].
Inflammation and dysregulation of the coagulation system have been shown to play a role in tumor progression [2-5]. Plate- let-to-lymphocyte ratio (PLR), which takes into account both the inflammatory and coagulation status, has been associated with the progression of CRC [6,7]. Recently, some studies have demonstrat- ed that PLR might be useful for follow-up conversion of colonic and rectal neoplastic polyps to invasive tumors [8]. An elevated PLR was associated with poor prognosis of CRC, and thus PLR could serve as prognostic predictors in CRC patients [9].
Body composition analysis describes the percentages of fat, pro- tein, minerals in human bodies. Bioelectrical impedance analysis (BIA) is a method used to determine body composition; it esti- mates impedance to alternating electrical current as it passes
Original Article
Korean Journal of Clinical Oncology 2019;15:7-14 https://doi.org/10.14216/kjco.19003
pISSN 1738-8082 ∙ eISSN 2288-4084
Association between body composition measured by bioelectrical impedance analysis and platelet-to-
lymphocyte ratio in colorectal cancer
Woo Jin Song
1*, Kyeong Eui Kim
1*, Sung Uk Bae
2,3, Woon Kyung Jeong
2, Seong Kyu Baek
21
Department of Medicine, Keimyung University School of Medicine, Daegu;
2
Department of Surgery and
3Nutrition Support Team, Dongsan Medical Center, Keimyung University School of Medicine, Daegu, Korea
Purpose: This study investigated the relationship between body composition and platelet-to-lymphocyte ratio (PLR) in patients with colorec- tal cancer (CRC).
Methods: This retrospective study included 110 patients who underwent anthropometric measurement by bioelectrical impedance analysis before surgical treatment for CRC between May 2015 and June 2018.
Results: According to PLR, 45 patients (40.9%) had low PLR (PLR<150), and 65 patients (59.1%) had high PLR (PLR≥150). Serum hemoglo- bin (P<0.001) and albumin levels (P=0.021) were significantly lower in high PLR group. Tumor mass diameter was significantly larger in high PLR group (P=0.048) and the proportion of poorly differentiated or mucinous tumors was significantly higher in high PLR group (P=0.037).
All indices related to fat (body fat mass, percent body fat, body fat mass of trunk, visceral fat area, fat mass index, measured fat thickness of abdomen) and two indices related to muscle (arm muscle circumference, measured muscle circumference of abdomen) were significantly lower in high PLR group (P<0.05). According to subgroup analysis based on the sex, all indices significantly differed between PLR groups;
however, in females no index was significantly different between PLR groups.
Conclusion: Body composition indices including fat and muscle indices measured by InBody 770 were related to PLR in CRC, especially in male patients. These results suggest that low muscle and fat indices may be related to poor prognosis of CRC.
Keywords: Colorectal neoplasm, Nutrition assessment, Body composition, Electric impedance, Prognosis
Received: May 4, 2019 Revised: Jun 8, 2019 Accepted: Jun 10, 2019 Correspondence to: Sung Uk Bae
Department of Surgery, Dongsan Medical Center, Keimyung University School of Medicine, 56 Dalseong-ro, Jung-gu, Daegu 41931, Korea Tel: +82-53-250-7322, Fax: +82-53-250-7322
E-mail: [email protected]
ORCID: Woo Jin Song (https://orcid.org/0000-0002-9045-3657), Kyeong Eui Kim (https://orcid.org/0000-0001-9984-9976), Sung Uk Bae (https://orcid.org/0000- 0002-7876-4196), Woon Kyung Jeong (https://orcid.org/0000-0001-8421-218X), Seong Kyu Baek (https://orcid.org/0000-0001-6427-8675)
*Woo Jin Song and Kyeong Eui Kim contributed equally to this work.
* This study was presented at the Annual Congress of KSS 2018, on November 1–3, 2018, in Seoul, Korea.
Copyright © 2019 Korean Society of Surgical Oncology
This is an Open Access article distributed under the terms of the Creative Commons Attri-
bution Non-Commercial License (http://creativecommons.org/licenses/by-nc/4.0) which
permits unrestricted non-commercial use, distribution, and reproduction in any medium,
provided the original work is properly cited.
very few side-effects.
Several studies have established a relationship between body composition and CRC. Fat composition of CRC patients is also known to affect cancer risk, prognosis, recurrence, and treatment toxicity [10]. Body muscle composition is also known to affect postoperative clinical outcomes, prognosis, and chemotoxicity of CRC [11-13]. Therefore, in our study, we aimed to investigate the relationship between body composition and PLR in patients with CRC.
METHODS
Patients
Using the medical records collected between May 2015 and June 2018, we retrospectively reviewed 605 consecutive cases of prima- ry CRC where patients received surgical treatment. A total of 110 patients who underwent anthropometric measurement by InBody 770 (Biospace, Seoul, Korea) were included in our study, and the following exclusion criteria were considered for the selection of participating patients: (1) synchronous or previous malignancies;
(2) malignancies other than adenocarcinoma; (3) refusal to under- go the BIA test; and (4) missing PLR score data. Finally, the selected population of 110 patients included 77 men (70.0%) and 33 wom- en (30.0%). Using a prospectively collected database, information regarding patients’ demographics and hematological parameters (from blood samples) was obtained; this included data regarding age, sex, history of smoking and drinking, American Society of Anesthesiologists grade, height, weight, sidedness and location of the tumor, and preoperative carcinoembryonic antigen (CEA) and carbohydrate antigen 19-9 (CA19-9) levels. This study protocol was approved by the Institutional Review Board of the Dongsan Medical Center (IRB No. 2018-12-024), and informed consent was obtained from all patients.
Preoperative evaluation and surgical treatment
All of the patients underwent a colonoscopy, biopsy, and staging scan (including computed tomography of the chest, abdomen, and pelvis, and magnetic resonance imaging of the pelvis). In addition, positron emission tomography scans and endorectal ultrasounds were carried out in few patients. Following the original description [14], we applied the general principles of complete mesocolic or mesorectal excision and central vascular ligation for CRC. The primary tumor was resected by sharp dissection of the visceral plane from the parietal fascia layer along with the entire regional mesocolon in an intact package. For right-sided colon cancer, radi-
vein. For left-sided colon or rectal cancer, high or selective ligation of the inferior mesenteric artery along with the lymph node dissec- tion was performed based on the tumor location. Tumor stages were classified according to the guidelines of the American Joint Committee on Cancer staging system, 6th edition.
Assessment of hematologic parameters and inflammation- based prognostic scores
During the outpatient visit, patients’ blood samples were collected just before their surgery to investigate the hematologic parameters, including hemoglobin, white blood cell (WBC), platelet, and albu- min. A complete blood cell count was performed on these blood samples to calculate the PLR. The PLR was calculated as the abso- lute count of platelets divided by the absolute count of lympho- cytes. Patients were divided into the low and high PLR groups us- ing a cutoff value of 150 [9]. In addition, other inflammation-based prognostic scores were calculated (prognostic nutritional index [PNI]: 10×serum albumin concentration (g/dL)+0.005×absolute lymphocyte count; neutrophil lymphocyte ratio [NLR]: absolute neutrophil count/absolute lymphocyte count).
Bioelectrical impedance analysis
Using InBody 770 (Biospace), a BIA test was performed at the pa- tient’s first visit to estimate their body composition. Further, we studied the various parameters of BIA and generated the following categories of measured variables: body composition or metabolic index, fat index, and muscle index.
Statistical analysis
All statistical analyses were performed using SPSS statistical soft- ware version 25.0 (IBM Corp., Armonk, NY, USA). The results were presented as means with standard deviations (mean±SD) for continuous outcomes, and as frequencies and percentages for cate- gorical outcomes. Categorical variables were analyzed using the chi-square and Fisher exact tests. Continuous variables were ana- lyzed with independent t-test and Mann-Whitney test. A P-value of < 0.05 was considered to be statistically significant.
RESULTS
Baseline characteristics
This study included 110 CRC patients, and the baseline character- istics of these patients are summarized in Table 1. Their mean age was 68.3 ±9.6 years, and 77 of 110 patients (70.0%) were male.
There were 74 patients (67.3%) with left-sided CRC and 38 (34.5%)
Woo Jin Song et al. • PLR ratio and body composition
Hematological parameters and inflammation-based prognostic scores
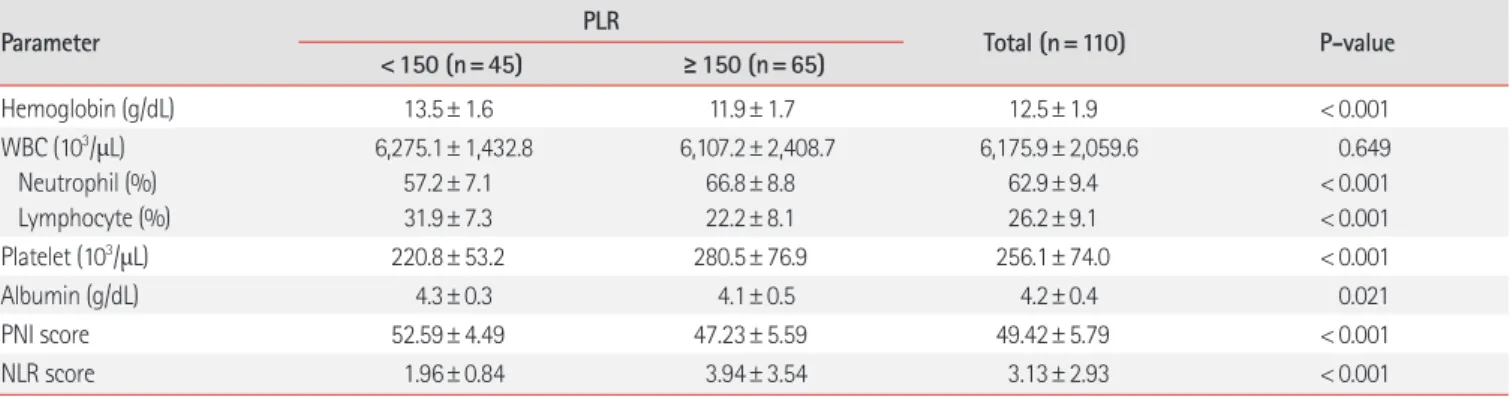
Hematological parameters according to the PLR are presented in Table 2. Relative to the low PLR group, serum hemoglobin (P< 0.001) and albumin (P= 0.021) levels were significantly lower in the high PLR group patients. WBC level was not significantly different between the two groups; however, there were significant differences in the platelet level (P< 0.001), and the proportion of neutrophil (P< 0.001) and lymphocyte (P< 0.001) in WBC. Other with rectal cancer. Patients’ mean CEA and CA19-9 levels were
3.80±4.93 and 13.45±13.27, respectively. According to PLR, 45 patients (40.9%) had a low PLR (PLR < 150), while 65 patients (59.1%) had a high PLR (PLR≥ 150). Patient’s age, sex, smoking status, drinking status, American Society of Anesthesiologists score, tumor’s location, CEA level, and CA19-9 level did not differ significantly between both PLR groups. In contrast, relative to the low PLR group, the high PLR patient group exhibited significantly greater height (P= 0.043) and lower weight (P= 0.014).
Table 1. Baseline characteristics of patients
Characteristic PLR
Total (n=110) P-value
<150 (n=45) ≥150 (n=65)
Age (yr) 67.6± 9.1 68.8± 10.0 68.3± 9.6 0.510
Sex Male Female
33 (73.3) 12 (26.7)
44 (67.7) 21 (32.3)
77 (70.0) 33 (30.0)
0.526
Smoking 19 (42.2) 30 (46.2) 49 (44.5) 0.683
Drinking 24 (53.3) 24 (36.9) 48 (43.6) 0.088
Height (cm) 156.9± 19.4 162.5± 8.2 160.2± 14.1 0.043
Weight (kg) 64.0± 9.3 59.5± 9.3 61.3± 9.5 0.014
ASA score 1 2 3
11 (24.4) 28 (62.2) 6 (13.3)
18 (27.7) 38 (58.5) 9 (13.8)
29 (26.4) 66 (60.0) 15 (13.6)
0.917 Sidedness
Right-sided Left-sided
13 (28.9) 32 (71.1)
23 (35.4) 42 (64.6)
36 (32.7) 74 (67.3)
0.475 Tumor location
Colon Rectum
32 (71.1) 13 (28.9)
40 (61.5) 25 (38.5)
72 (65.5) 38 (34.5)
0.299
CEA (ng/mL) 3.49± 4.04 4.02± 5.49 3.80± 4.93 0.584
CA19-9 (U/mL) 11.98± 9.94 14.50± 15.20 13.45± 13.27 0.333
Values are presented as mean± standard deviation or number (%).
PLR, platelet-to-lymphocyte ratio; ASA, American Society of Anesthesiologists; CEA, carcinoembryonic antigen; CA19-9, carbohydrate antigen 19-9.
Table 2. Hematological parameters of patients
Parameter PLR
Total (n=110) P-value
<150 (n=45) ≥150 (n=65)
Hemoglobin (g/dL) 13.5± 1.6 11.9± 1.7 12.5± 1.9 < 0.001
WBC (10
3/μL) Neutrophil (%) Lymphocyte (%)
6,275.1± 1,432.8 57.2± 7.1 31.9± 7.3
6,107.2± 2,408.7 66.8± 8.8 22.2± 8.1
6,175.9± 2,059.6 62.9± 9.4 26.2± 9.1
0.649
< 0.001
< 0.001
Platelet (10
3/μL) 220.8± 53.2 280.5± 76.9 256.1± 74.0 < 0.001
Albumin (g/dL) 4.3± 0.3 4.1± 0.5 4.2± 0.4 0.021
PNI score 52.59± 4.49 47.23± 5.59 49.42± 5.79 < 0.001
NLR score 1.96± 0.84 3.94± 3.54 3.13± 2.93 < 0.001
Values are presented as mean± standard deviation.
PLR, platelet-to-lymphocyte ratio; WBC, white blood cell; PNI, prognostic nutritional index; NLR, neutrophil lymphocyte ratio.
inflammation-based prognostic scores were also calculated for the PLR groups. The PNI score was significantly lower in the high PLR group (P< 0.001), while the NLR score was significantly higher in the high PLR group (P< 0.001).
Pathological characteristics
Pathological findings of patients according to PLR are provided in Table 3. The largest dimension of the tumor mass was overall great- er in the high PLR group (P=0.048). Well or moderately differenti- ated tumors were the predominant type in both PLR groups; how- ever, the proportion of poorly differentiated or mucinous tumors significantly increased in the high PLR group (P=0.037). The high PLR group appeared to have more advanced T stages, although these differences were not statistically significant (P=0.097). In present study, two patient groups did not exhibit statistically signifi- cant differences in N stage, lymphovascular invasion, tumor bud-
ding, perineural invasion, and extranodal tumor deposit.
Body composition indices according to PLR
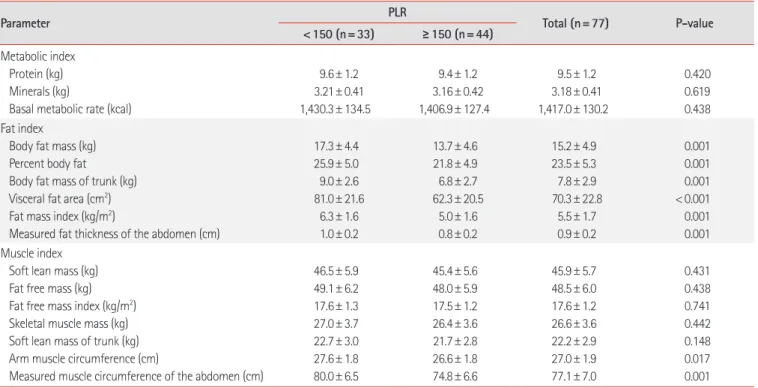
The results of body composition analyses of the patients are sum- marized in Table 4. We classified our results in three categories:
body composition or metabolic, fat, and muscle indices. Body composition or metabolism indices did not significantly differ be- tween both PLR groups. However, all indices related to fat (body fat mass, percent body fat, body fat mass of trunk, visceral fat area, fat mass index, and measured fat thickness of the abdomen) and two indices related to muscle (arm muscle circumference and measured muscle circumference of the abdomen) were signifi- cantly lower in the high PLR group (P< 0.05).
The results of body composition analysis according to sex groups are described in Tables 5 and 6. In male participants, all in- dices which were significantly different in Table 4 remained statis-
Finding Total (n=110) P-value
<150 (n=45) ≥150 (n=65)
Mass size (large diameter, cm) 3.3± 1.8 4.2± 2.4 3.8± 2.2 0.048
T stage
a)T1 T2 T3 T4
14 (31.1) 10 (22.2) 19 (42.2) 2 (4.4)
11 (16.9) 12 (18.5) 29 (44.6) 8 (12.3)
25 (22.7) 22 (20.0) 48 (43.6) 10 (9.1)
0.097 N stage
N0 N1 N2
29 (64.4) 14 (31.1) 2 (4.4)
47 (72.3) 13 (20.0) 5 (7.7)
76 (69.1) 27 (24.5) 7 (6.4)
0.365 M stage
M0 M1
44 (97.8)
1 (2.2)
63 (96.9)
2 (3.1)
107 (97.3)
3 (2.7)
0.787 Stage
b)I II III IV
19 (42.2) 10 (22.2) 15 (33.3) 1 (2.2)
21 (32.3) 21 (32.3) 16 (24.6) 2 (3.1)
40 (36.4) 31 (28.2) 31 (28.2) 3 (2.7)
0.205
Lymph node (total) 18.2± 6.8 19.4± 10.8 18.9± 9.3 0.478
Lymph node (positive) 0.7± 1.1 0.6± 1.6 0.6± 1.4 0.762
Differentiation Well or moderate Poor or mucinous
44 (97.8)
1 (2.2)
56 (86.2)
9 (13.8)
100 (90.9)
10 (9.1)
0.037
Lymphovascular invasion 9 (20.0) 18 (27.7) 27 (24.5) 0.357
Tumor budding 16 (35.6) 23 (35.4) 39 (35.5) 0.985
Perineural invasion 6 (13.3) 14 (21.5) 20 (18.2) 0.273
Extranodal tumor deposit 6 (13.3) 9 (13.8) 15 (13.6) 0.939
Values are presented as mean± standard deviation or number (%).
PLR, platelet-to-lymphocyte ratio.
a)