45
Copyright © 2016 The Korean Society of Fisheries and Aquatic Science pISSN:0374-8111, eISSN:2287-8815
서 론
수중 저산소
(hypoxia)
는 공기에의한수중의 산소포화도가100%
일때의용존산소(DO)
농도에비하여DO
가낮은상태 를말하며(Noga, 1999),
유기호흡을하는수산생물이산소부족 에의해생육하기어려운DO
범위를지칭하는빈산소, DO
가 거의없는무산소환경을포함한다.
저산소환경에서어류는유 영속도,
섭식및성장이저하되고,
저산소가장시간지속되거나 산소부족이극심하면호흡부전에의해질식사하게된다(Miller et al., 2002; Johansen et al., 2006).
어류의 대사율은 생리활성 상태에 따라 표준대사율
(stan- dard metabolic rate, SMR),
활동대사율(active metabolic rate, AMR)
과일상대사율(routine metabolic rate, RMR)
로구분한 다. SMR
은절식,
휴식상태인어류에서보이는최소유지대사율을
, AMR
은어류가최대속도로유영할때의대사율을의미한다
. RMR
은SMR
을능가하는대사율로서어체에random activity
가수반된상태의대사율을칭한다(Randall, 1982).
저 산소에노출된어류의호흡대사율(MO
2)
변동유형에는산소포 화도가낮을수록MO
2가감소하는산소순응자와일정수준까지 는산소포화도가낮아지더라도MO
2를SMR
내지RMR
수준 으로조절하는산소조절자가있다(Steffensen, 2006).
산소조절 자의대사율조절은저산소환경에직면한어류가항상성을유 지하기위해respiratory volume
을증가시킨결과이며(Randall, 1982),
저산소가심화되면대사율은SMR
이하로감소하게되 는데 이때의 산소포화도를 임계산소포화도(critical oxygen saturation, S
crit)
또는 임계산소분압(P
crit)
으로 나타낸다(Fry, 1971; Schurmann and Steffensen, 1997; Richards, 2009). S
crit 이하의저산소에노출된어류는산소요구량의부족에따른생저산소에 노출된 넙치(Paralichthys olivaceus)의 호흡대사와 혈액의 화학적 변화
한지도·김흥윤
1*
단양다누리센터, 1전남대학교 수산생명의학과
Changes in Respiratory Metabolism and Blood Chemistry of Olive Flounder Paralichthys olivaceus Exposed to Hypoxia
Ji-Do Han and Heung-Yun Kim
1
*Danyang Danuri Center, Danyang 27011, Korea
1
Department of Aqualife Medicine, Chonnam National University, Yeosu 59626, Korea
This experiment investigated changes in metabolic rate (MO
2), critical oxygen saturation (S
crit), and blood chemistry of olive flounder Paralichthys olivaceus exposed to progressive hypoxia and returned to normoxic water at 20°C. The normoxic standard metabolic rate (SMR) and routine metabolic rate (RMR) were 69.5-83.9 and 70.2-156.4 mg O
2kg
-1h
-1, respectively based on fish weight. S
critwas 31.0% dissolved oxygen (DO) at 20°C. After returning the fish to 70% DO following exposure to hypoxia (20% DO), MO
2increased two-fold compared to the normoxic SMR and then decreased into the range of the RMR with time. Blood PO
2and plasma lactate decreased significantly after ex- posure to hypoxia (20% DO) and then increased as ambient oxygen saturation decreased. Cortisol levels increased as ambient oxygen saturation decreased, but the levels decreased rapidly in the range of the normoxic control when the fish were returned to ambient water with 70% DO. Plasma glucose levels increased when the fish were returned to normoxic water after exposure to a progressively more hypoxic condition.
Key words: Olive flounder, Paralichthys olivaceus , Hypoxia, Respiratory metabolism, Blood chemistry
This is an Open Access article distributed under the terms of the Creative Commons Attribution Non-Commercial Licens (http://creativecommons.org/licenses/by-nc/3.0/) which permits unrestricted non-commercial use, distribution, and reproduction in any medium, provided the original work is properly cited.
http://dx.doi.org/10.5657/KFAS.2016.0045 Korean J Fish Aquat Sci 49(1) 045-052, February 2016
Received 21 January 2016; Revised 17 February 2016; Accepted 18 February 2016
*Corresponding author: Tel: +82. 61. 659. 7174 Fax: +82. 61. 659. 7179
E-mail address: [email protected]
한지도
ㆍ
김흥윤46
리적변화가초래되며
, S
crit는어종,
수온,
섭식상태등에따라차 이를보이는것으로알려져있다(Jobling, 1982; Priede, 1985;
Schurmann and Steffensen, 1997; Maxime et al., 2000; Thuy et al., 2010).
저산소에노출된어류의생리적반응에는산소부 족에따른체내이온및pH
교란에대한내성기작,
저산소에대 응하여MO
2를줄이는기작,
해수의산소포화도가정상수준으 로회복된조건에서는활성산소에의한위해를줄이는기작과 함께스트레스반응이수반된다(Maxime et al., 2000; Hebert and Steffensen, 2005; Richards, 2009).
양식장 사육수의 산소포화도는 일차적으로 수용밀도와 단 위시간당 사육수조에 유입되는 수량에의존된다
(Maxime et al., 2000).
특히,
수중산소용해도가낮은고수온기에는섭식 한 먹이의 소화·
흡수과정에 나타나는 특이동적작용(specific dynamic action, SDA)
으로어류의산소소비는급격히증가한 다(Peck et al., 2005; Fu et al., 2005).
수온이20℃
이상으로상 승되는고수온기넙치양식장사육수의DO
는먹이공급후점진 적인저산소가일정시간동안지속된후정상산소포화도(nor-
moxia)
로회복되는현상이현장조사에서관찰되었다.
따라서점진적인저산소와저산소에서
normoxia
로복귀되는조건에 서넙치의MO
2와생리상태의변화및S
crit를측정한결과는양 식생리학적기초자료로서의미가있을것으로생각된다.
저산소환경에노출된어류의발생
,
생존,
성장및생리상태 에미치는영향은연어,
송어,
잉어,
대구및메기류등많은어 종을 대상으로 다양한 연구가 수행되었다(Richards, 2009).
해산가자미과어류에관한연구는주로
plaice Pleuronectes platessa (Jobling, 1982; White and Fletcher, 1989), flounder Platichthys flesus (Steffensen et al., 1982; Lennard and Hud- dart, 1992; Soldatov, 1996), sole Solea solea (Van Den Thillart et al., 1994; Dalla Via et al., 1994)
및turbot Scophthalmus maximus (Maxime et al., 2000)
에대해저산소노출에따른대 사율과생리적변화를조사한연구가다수보고되어있다.
하지 만국내육상양식장의주요양식어종인넙치에대하여저산소 농도별노출에따른호흡대사와S
crit및생리상태의변화를조사 한연구는찾아보기어렵다.
본연구는수온
20℃
에서저산소환경에노출된넙치의MO
2 와S
crit를평가하고,
점진적인저산소및저산소에서normoxia
로회복시의생리적반응과혈액화학적변화를파악하기위해 실시하였다.
재료 및 방법
실험어
실험에사용된양식산 넙치
(Paralichthys olivaceus)
는 전장29-34 cm (
체중, 382-478 g)
의외관상건강한개체를선별하여 항온사육실내순환여과식수조에수용하였다.
사육시수온과 염분은20℃, 32-33 psu
로유지하였고,
사료는시판되는넙치부상사료
(Ø 9 mm)
를공급하면서실험실조건에순치·
사육하였다
.
순치사육동안수온, pH, DO
및염분은수질분석기(YSI 6920, U.S.A.)
로2-3
일간격으로수질을측정하였고,
실험어는 실험전에2
일간절식시켰다.
MO
2측정장치
MO
2측정장치는수온과DO
조절장치,
연속자동호흡측정기(AIFR, automatic intermittent-flow respirometer)
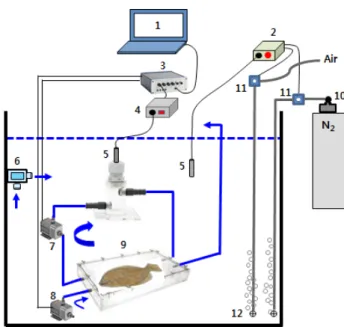
로구성되었 다(Fig. 1). AIFR
은PC
에설정한시간주기에따라실험어가수 용된호흡실에수조속의해수를주기적으로교환하면서MO
2 가반복측정되도록장치되었다.
해수의DO
는수조내산소전 극(Mini Probe, Oxyguard, Denmark)
에서감지된DO
가설정 농도의1%
를초과하면 산소분석기(OXY-REG, Loligo Sys- tems, Denmark)
에장착된relay
가N
2regulator
에연결된sole- noid valve (SV, Burkert 6011, Germany)
를개방하여N
2가,
설 정농도의1%
이하로낮아지면N
2SV
는닫히고relay
가공기공 급을제어하는SV
를열어aeration
되도록하여자동조절되었 다.
수온은온도센스(Pt-100)
와온도조절기로서히터와냉각기 를제어하여실험수온으로조절하였다.
Fig. 1. Schematic (not to scale) of apparatus used to measure oxy- gen consumption and to maintain different oxygen levels in ol- ive flounder Paralichthys olivaceus. Arrows indicate directions of water flow. 1: PC for control and data storage, 2: DO meter and solenoid valve (SV) relay, 3: pump relay, 4: DO meter and A/D convertor, 5: oxygen probe and flow-through probe chamber, 6:
circulation pump of ambient water, 7: recirculation pump, 8: flush pump, 9: respiratory chamber, 10: N2 regulator, 11: SV of air and N2, 12: disperser of air and N2.
MO
2측정
호흡실
(21 cm×35 cm×6.5 cm, 4.78 L)
에해수를약1/2
가 량채운후실험어1
마리를수용해서뚜껑을밀봉하여수조속 에넣었다.
이어서flush pump (FP)
와recirculation pump (RP)
를작동시켜해수를완전히채운뒤호흡실과
tubing
속의기포를모두제거하였다
.
호흡측정은AutoResp software (Loligo Systems, Denmark)
에통제되어10
분을 주기로실시되었다.
즉, 3
분간의호흡측정후FP
에의해6
분간호흡실의해수가충 분히교체되도록하였고,
이어서FP
정지후RP
에의해호흡실 과산소전극을연결하는tubing
내에있는해수의DO
가균일 하도록1
분간내부순환시킨다음실험어의호흡을측정하는 주기가반복되었다. FP
와RP
의pumping rate
는4.5 L/min
이 였고, AIFR
이담긴수조속의수량은200 L
이였다.
호흡측정 시수온은20±0.3℃,
염분32.1-32.6 psu, pH
는7.8-8.1
이었고, MO
2는다음의식으로산출되었다.
MO
2=α·V
RC·βW
-1여기서
MO
2는1
시간당체중kg
당호흡대사율(mg O
2kg
-1h
-1), α
는실험어가3
분간소비한DO (%)
의1
시간환산치, V
RC는호 흡실용적(tubing
포함)
에서실험어의용적(mL/g)
을뺀순환해 수의총량, β
는실험수온과염분에서순환해수의포화산소용해 도(mg O
2L %
-1)
이다. W
는호흡측정이끝난후어체표면의물 기를티슈로닦아내고전자저울(Sartorius BP3100S)
로0.1 g
까 지계측한실험어의체중(kg)
을나타내었다.
표준대사율(SMR) 및 일상대사율(RMR)
본연구에서는 해수의산소포화도가
85% DO
이상인조건(normoxia)
에서최저MO
2가3
회이상반복관측된후6
회의MO
2 측정치(1
시간에 걸친 호흡대사율 측정치)
의 평균값을SMR
로, SMR
을능가하는MO
2범위를RMR
로표현하였다. 점진적인 저산소 노출 시 MO
2와 Scrit
저산소에노출된넙치의
MO
2변동유형을파악하기위하여,
해수의산소포화도를normoxia
에서60%,
이후60% DO
에서10%
씩점진적으로낮춘저산소조건(50, 40
및30% DO)
에각 각1
시간및25-15% DO
에서는30-10
분간MO
2를측정하였 다. S
crit는점진적인저산소에노출된넙치에서측정된MO
2가SMR
이하로감소되는산소포화도별MO
2의회귀직선이SMR
과교차하는지점의산소포화도로평가하였다.
모든실험에서 해수및실험구의DO
가설정농도로조절되는데소요되는시간 은최대5
분이내였다.
급격한 저산소 및 저산소에서 normoxia에 노출 시 MO
2Normoxia
에서해수의DO
를50%,
이후50% DO
에서10%
씩단계적으로낮춘저산소조건
(40
및30% DO)
에각각1
시 간, 30%
에서20% DO
로낮춘조건에서는30
분간MO
2를측정 하였다.
이어서해수의DO
를20%
에서70%
로, 70%
에서nor- moxia
로높여서각각1
시간동안MO
2를측정하였다. 급격한 저산소 및 저산소에서 normoxia에 노출 시 혈 액의 화학적 변화
저산소와저산소에서
normoxia
조건에각각노출된넙치혈 액의화학적변화를조사하기위해,
노출시험에사용된수조(
수 량, 150 L)
는대조구를포함하여총8
개로구성되었다.
각실험 구에는평균체중395±43 g
의넙치를5
마리씩수용하여2
일간 절식상태로유지하였다.
노출실험은7
개실험구의DO
를nor- moxia
에서50%,
이후50% DO
에서10%
씩점진적으로낮춘 저산소조건(40
및30% DO)
에서각각1
시간, 30%
에서20%
로낮춘조건에서는
30
분간노출시킨후혈액을채취하였다. 7
개실험구중2
개는normoxia
에서20% DO
까지는위와동일 한절차로저산소에노출시킨후DO
를70%
및70%
에서nor- moxia
로높여서1
시간노출후실험구별로채혈하였다.
대조구 는aeration
에의해DO
가85%
이상유지되도록하였다.
실험 구의DO
조절은전술한방법의DO
조절시스템이적용되었다. 채혈 및 혈액분석
실험농도의산소포화도에노출시킨후실험어포획시에는내 부구획이쉽고물흐름이원활하도록만든아크릴칸막이로
1
마 리를격리한뒤뜰망으로신속히채집하여,
포획에따른동일실 험구의다른어체에교란이없도록하였다.
포획어체는lithium heparinized syringe
를사용하여미부혈관에서혈액을채혈한 즉시각분석에사용하였다.
채혈주사기의바늘을제거한뒤 혈액가스분석기(IDEXX VetStat, U.S.A.)
주입구에꽂아125 µL
을자동흡입되게한뒤혈액의pH,
산소분압(PO
2)
및전해 질(Na
+, K
+, Cl
-)
을분석하였다.
여분의혈액은Eppendorf tube
에주입한다음5,000 rpm
에서5
분간원심분리하여혈장을수 거하였다. Plasma glucose
는혈액생화학분석기(Fuji Dri-chem 3500s, Japan)
로측정하였다. Plasma lactate
는enzymatic kit (Sigma L3916 & Sigma diagnostics procedure)
로 발색시킨뒤시료의흡광도를
340 nm
에서측정하여검량선과비색정량하였다
. Plasma cortisol
은cortisol ELISA kit (IBL RE52061, Germany)
로서분석하였다.
통계처리
저산소및
normoxia
에반복노출시MO
2와혈액화학적측정결과는
one-way ANOVA
를실시하여평균간의차이를검정하였다
.
이로부터95%
유의수준에서차이가인정된측정치간의다중비교는
Zar (1984)
가제시한방법에준해SPSS (ver-
sion 19.0)
통계패키지를이용하여Turkey test
를실시하였다(P<0.05).
한지도
ㆍ
김흥윤48
결 과
표준대사율(SMR) 및 일상대사율(RMR)
수온
20℃
에서체중386-450 g
의 넙치5
개체에대해 각각normoxia
에서MO
2를측정한결과는Fig. 2
와같다.
호흡측정 개시후실험어별로3
시간에서12
시간동안의MO
2는호흡측 정과정에수반된실험어포획과호흡실투입등의취급에따른 스트레스로인하여높고불안정한MO
2가,
이후에는초기에비 해낮고안정된MO
2가반복적으로관측되었다.
수온20℃
에서넙치의
normoxic SMR
은개체크기에따른대사강도의차이가나타나
69.5-83.9 mg O
2kg
-1h
-1이었고, RMR
은70.2-156.4 mL
O
2kg
-1h
-1의범위를보여주었다(Table 1).
점진적인 저산소 노출 시 MO
2와 Scrit
Normoxia
에서해수의DO
가40%
로낮아진저산소조건에 노출되면초기에는normoxic SMR
에근접하는MO
2를보이다Table 1. Normoxic SMR, RMR and critical oxygen saturation (Scrit) of olive flounder Paralichthys olivaceus exposed to normoxic and hypoxic water at 20℃
Body weight
(g) Normoxic SMR Normoxic RMR Scrit (DO, %) (mg O2 kg-1h-1)
450 69.5 (±2.0) 70.2-139.9 32.4
424 71.4 (±2.3) 73.6-128.7 31.2
420 73.2 (±2.2) 75.3-133.6 29.3
403 74.1 (±1.2) 75.2-138.7 30.4
386 83.9 (±0.9) 84.8-156.4 31.7
Mean 74.4 - 31.0
Fig. 2. Metabolic rate (MO2) data collected during 16-18 h pe- riod and used to estimate the standard metabolic rate (SMR) and routine metabolic rate (RMR) of the olive flounder Paralichthys olivaceus at normoxic water and 20℃. The horizontal dotted lines indicate SMR calculated as the mean of the six (equals 1 h) low- est measurements following the elevated MO2 by initial handling stress. The arrows represent the point in time which MO2 of the fish were stabilized after the initial stress, and numeric values are the flounder's body weight.
40 80 120 160 40 80 120 160
Metabolic rate (mg O
2kg
-1h
-1)
40 80 120 160 200450 g
40 80 120 160
Time (h)
0 2 4 6 8 10 12 14 16 18
40 80 120
160 386 g
420 g 424 g
403 g
Oxygen saturation (%)
0 10 20 30 40 50 60 70 80 90 100
0 20 40 60 80 100 120 140 160 180
Normoxic SMR
0 10 20 30 40 50 60 70 80 90 100
Metabolic rate (mg O
2kg
-1h
-1)
0 20 40 60 80 100 120 140 160 180Scrit
Normoxic SMR RMR
Scrit
RMR
Y=2.374X - 7.702 (r2=0.842)
Y=2.336X + 1.426(r2=0.871)
450 g
420 g
Oxygen saturation (%)
10 20 30 40 50 60 70 80 90 100
Metabolic rate (mg O
2kg
-1h
-1)
0 20 40 60 80 100 120 140 160 180
Graduated hypoxia Return to normoxia Normoxic SMR a
ad
a b
a
c cd
d
Normoxic SMR
Blood pH
7.40 7.45 7.50 7.55
7.60 Graduated hypoxia
Return to normoxia Normoxic control
Oxygen saturation (%)
10 20 30 40 50 60 70 80 90 100
Blood PO2 (mmHg) 20 40 60 80 100
120 aa
ab b
c
b c
Oxygen saturation (%)
10 20 30 40 50 60 70 80 90 100
130 135 140 145 150 155 160 165 170 175 180
Plasma electrolyte (mM)
2.0 2.5 3.0 3.5 4.0 4.5
Graduated hypoxia Return to normoxia Normoxic control
Potassium
Chloride Sodium
a a a a
a a
b
Lactate (mM)
0 1 2 3 4 5 6
Glucose (mg/100 mL)
0 10 20 30 40
Graduated hypoxia Return to normoxia Normoxic control
Oxygen saturation (%)
10 20 30 40 50 60 70 80 90 100
Cortisol (ng/mL)
0 20 40 60 80
aa
b bc
a c
a
a a a a
b b
bc b
a a cd
d
ab
a
Fig. 3. Examples of critical oxygen saturation (Scrit) of the olive flounder Paralichthys olivaceus exposed to stepwise hypoxic wa- ter at 20℃. The total period taken for one determination of MO2 was 10 min. Data include SMR and RMR measurements in Fig. 3.
Numeric values are the flounder's body weight.
40 80 120 160 40 80 120 160
Metabolic rate (mg O
2kg
-1h
-1)
40 80 120 160200 450 g
40 80 120 160
Time (h)
0 2 4 6 8 10 12 14 16 18
40 80 120
160 386 g
420 g 424 g
403 g
Oxygen saturation (%)
0 10 20 30 40 50 60 70 80 90 100
0 20 40 60 80 100 120 140 160 180
Normoxic SMR
0 10 20 30 40 50 60 70 80 90 100
Metabolic rate (mg O
2kg
-1h
-1)
0 20 40 60 80 100 120 140 160 180Scrit
Normoxic SMR RMR
Scrit
RMR
Y=2.374X - 7.702 (r2=0.842)
Y=2.336X + 1.426(r2=0.871)
450 g
420 g
Oxygen saturation (%)
10 20 30 40 50 60 70 80 90 100
Metabolic rate (mg O
2kg
-1h
-1)
0 20 40 60 80 100 120 140 160 180
Graduated hypoxia Return to normoxia Normoxic SMR a
ad
a b
a
c cd
d Normoxic SMR
Blood pH
7.40 7.45 7.50 7.55
7.60 Graduated hypoxia
Return to normoxia Normoxic control
Oxygen saturation (%)
10 20 30 40 50 60 70 80 90 100
Blood PO2 (mmHg) 20 40 60 80 100
120 aa
ab b
c
b c
Oxygen saturation (%)
10 20 30 40 50 60 70 80 90 100
130 135 140 145 150 155 160 165 170 175 180
Plasma electrolyte (mM)
2.0 2.5 3.0 3.5 4.0 4.5
Graduated hypoxia Return to normoxia Normoxic control
Potassium
Chloride Sodium
a a a a
a
a
b
Lactate (mM)
0 1 2 3 4 5 6
Glucose (mg/100 mL)
0 10 20 30 40
Graduated hypoxia Return to normoxia Normoxic control
Oxygen saturation (%)
10 20 30 40 50 60 70 80 90 100
Cortisol (ng/mL)
0 20 40 60 80
aa
b bc
a c
a
a a
a a
b b
bc b
a a cd
d
ab
a
넙치의 호흡대사와 혈액의 화학적 변화
49
가시간이경과할수록
SMR
을초과하는값이관측되었다. 30%
DO
에서는normoxic SMR
이하이거나비슷한대사율이유지 되었고, 30%
이하에서는DO
가낮아질수록MO
2는현저하게 감소하였다.
수온20℃
에서생체중량400 g
전후의넙치는해 수의DO
가감소함에따라normoxic SMR
이하로MO
2가감소 되는산소포화도(S
crit)
는평균31.0% (29.3-32.4%)
로평가되었 다(Fig. 3
과Table 1).
급격한 저산소 및 저산소에서 normoxia에 노출 시 MO
2Normoxia
에서50, 40, 30
및20% DO
에노출시킨후저산소(20% DO)
에서70% DO
와normoxia
로복귀시켜MO
2를측정 한결과는Fig. 4
와같다.
해수의DO
가30%
로낮아지면MO
2는 감소하기시작하였고, 20%
에서는normoxic SMR (74.5±2.7 mg O
2kg
-1h
-1)
에비해유의하게낮았다(P<0.05).
해수의DO
가20%
에서70%
로높아지면normoxic SMR
의2
배에달하는높 은MO
2가관찰되었고,
이후normoxia
로회복된조건에서는시 간이경과함에따라MO
2는점차감소되는경향을보여주었다. 급격한 저산소 및 저산소에서 normoxia에 노출 시 혈 액의 화학적 변화
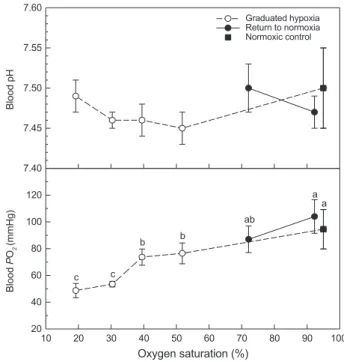
Normoxia
에서50-20% DO
및저산소(20% DO)
에서70%
DO
와normoxia
에노출된넙치혈액의pH
와PO
2는Fig. 5
와 같다. Normoxia
에서50, 40
및30% O
2에노출된후에는혈액pH
가감소하는경향을보였지만normoxic control (
대조구)
과차이는없었다
. PO
2는점진적인저산소상태가심화될수록감 소하였고,
해수의DO
가30%
와20%
인저산소에노출된것은 대조구에비해낮은PO
2가관찰되었다(P<0.05).
저산소에노 출후DO
가70%
와normoxia
로회복된조건에서는대조구와 차이가없었다.
혈장
sodium
과potassium
은저산소및저산소에서normoxia
에노출된조건에서도대조구와차이는없었다(Fig. 6). Chlo-
ride
는저산소에노출후에는대조구와차이가없었으나저산소노출후해수의
DO
가normoxia
수준으로회복된조건에서는 혈액chloride
농도가감소하였다(P<0.05).
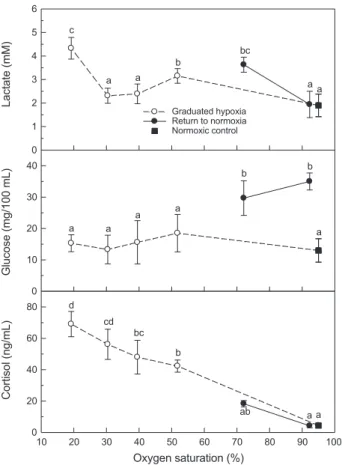
혈장
lactate
는50
및20% DO
의저산소에노출된후에는대 조구에비해높은농도가측정되었고,
저산소(20% DO)
노출 후해수의DO
가70%
로회복된조건에서도높은농도가유지 되었다가normoxia
에서는대조구수준을나타내었다(Fig. 7).
혈장
glucose
는저산소에노출되는동안에는변화가없었으나해수의
DO
가20%
에서70%
와normoxia
로회복된조건에서 는대조구와비교하여유의하게높은농도가관찰되었다.
혈장cortisol
은normoxia
에서저산소조건이심화될수록지속적으 로증가하는현상을나타내었다.
저산소노출후해수의DO
가70%
와normoxia
로회복된뒤에는plasma cortisol
이급격히감 소하여대조구와유사한수준을나타내었다(Fig. 7).
Fig. 4. Variations in metabolic rate (MO2) of the olive flounder Paralichthys olivaceus exposed to stepwise hypoxic and normoxic water at 20℃. The MO2 was measured for 1 h and 30 min in ≥30%
and 20% of oxygen saturation, respectively. The experiments were separately performed with 3 olive flounders (420.3±7.4 g in body weight). Each data point represents the mean±SD of MO2 and oxygen saturation. Different letters indicate significant differences (P<0.05) between oxygen saturation.
40 80 120 160 40 80 120 160
Metabolic rate (mg O
2kg
-1h
-1)
40 80 120 160200 450 g
40 80 120 160
Time (h)
0 2 4 6 8 10 12 14 16 18
40 80 120
160 386 g
420 g 424 g
403 g
Oxygen saturation (%)
0 10 20 30 40 50 60 70 80 90 100
0 20 40 60 80 100 120 140 160 180
Normoxic SMR
0 10 20 30 40 50 60 70 80 90 100
Metabolic rate (mg O
2kg
-1h
-1)
0 20 40 60 80 100 120 140 160 180Scrit
Normoxic SMR RMR
Scrit
RMR
Y=2.374X - 7.702 (r2=0.842)
Y=2.336X + 1.426(r2=0.871)
450 g
420 g
Oxygen saturation (%)
10 20 30 40 50 60 70 80 90 100
Metabolic rate (mg O
2kg
-1h
-1)
0 20 40 60 80 100 120 140 160 180
Graduated hypoxia Return to normoxia Normoxic SMR a
ad
a b
a
c cd
d Normoxic SMR
Blood pH
7.40 7.45 7.50 7.55
7.60 Graduated hypoxia
Return to normoxia Normoxic control
Oxygen saturation (%)
10 20 30 40 50 60 70 80 90 100
Blood PO2 (mmHg) 20 40 60 80 100
120 aa
ab b
c
b c
Oxygen saturation (%)
10 20 30 40 50 60 70 80 90 100
130 135 140 145 150 155 160 165 170 175 180
Plasma electrolyte (mM)
2.0 2.5 3.0 3.5 4.0 4.5
Graduated hypoxia Return to normoxia Normoxic control
Potassium
Chloride Sodium
a a a a
a a
b
Lactate (mM)
0 1 2 3 4 5 6
Glucose (mg/100 mL)
0 10 20 30 40
Graduated hypoxia Return to normoxia Normoxic control
Oxygen saturation (%)
10 20 30 40 50 60 70 80 90 100
Cortisol (ng/mL)
0 20 40 60 80
aa
b bc
a c
a
a a a a
b b
bc b
a a cd
d
ab
a
Fig. 5. Changes in blood pH and partial oxygen pressure (PO2) of the olive flounder Paralichthys olivaceus exposed to stepwise hy- poxic and normoxic water at 20℃. The blood was collected after exposure for 1 h and 30 min in ≥30% and 20% of oxygen satu- ration, respectively. Each data point represents the mean±SD of measurements (n=5). Different letters indicate P<0.05.
40 80 120 160 40 80 120 160
Metabolic rate (mg O
2kg
-1h
-1)
40 80 12040 80 120 160
Time (h)
0 2 4 6 8 10 12 14 16 18
40 80 120
160 386 g
420 g 424 g
403 g
Oxygen saturation (%)
0 10 20 30 40 50 60 70 80 90 100
0 20 40 60 80 100 120 140 160 180
Normoxic SMR
0 10 20 30 40 50 60 70 80 90 100
Metabolic rate (mg O
2kg
-1h
-1)
0 20 40 60 80 100 120 140 160 180Scrit
Normoxic SMR RMR
Scrit
RMR
Y=2.374X - 7.702 (r2=0.842)
Y=2.336X + 1.426(r2=0.871)
450 g
420 g
Oxygen saturation (%)
10 20 30 40 50 60 70 80 90 100
Metabolic rate (mg O
2kg
-1h
-1)
0 20 40 60 80 100 120 140 160 180
Graduated hypoxia Return to normoxia Normoxic SMR a
ad
a b
a
c cd
d Normoxic SMR
Blood pH
7.40 7.45 7.50 7.55
7.60 Graduated hypoxia
Return to normoxia Normoxic control
Oxygen saturation (%)
10 20 30 40 50 60 70 80 90 100
Blood PO2 (mmHg) 20 40 60 80 100
120 aa
ab b
c
b c
Oxygen saturation (%)
10 20 30 40 50 60 70 80 90 100
130 135 140 145 150 155 160 165 170 175 180
Plasma electrolyte (mM)
2.0 2.5 3.0 3.5 4.0 4.5
Graduated hypoxia Return to normoxia Normoxic control
Potassium
Chloride Sodium
a a a a
a
a
b
Lactate (mM)
0 1 2 3 4 5 6
Glucose (mg/100 mL)
0 10 20 30 40
Graduated hypoxia Return to normoxia Normoxic control
Oxygen saturation (%)
10 20 30 40 50 60 70 80 90 100
Cortisol (ng/mL)
0 20 40 60 80
aa
b bc
a c
a
a a
a a
b b
bc b
a a cd
d
ab
a
한지도
ㆍ
김흥윤50
고 찰
수중의
DO
결핍은어체에스트레스로작용하여어류행동과 생리적변화를초래하는요인이될수있으며(Herbert and Stef- fensen, 2005),
어류는저산소영역에서도피하거나유영활동 및섭식활동을억제하여대사에너지소비를감소시키는등다 양한조절작용을보인다(Poon et al., 2001).
저산소환경을접한어류는
MO
2조절유형에따라산소조절 자와산소순응자로구분한다.
산소조절자는일정범위의저산 소수준이내에서는산소요구량에상당하는산소를섭취하기 위하여호흡수와심장박동당혈액박출량을증가시켜대사율 을일정하게 조절하지만, S
crit이하로DO
가 낮아지면MO
2가 감소하면서근육이나혈중에lactate
를축적하는혐기성대사 가수반된다.
이에반하여산소순응자는수중의DO
가낮아질 수록MO
2도지속적으로감소하는형태를보인다(Steffensen, 2006).
수온20℃
에서normoxia
와점진적인저산소에노출된넙치의
MO
2변동유형을조사한바,
넙치는산소포화도가약30%
이상인저산소조건에서는해수의DO
가감소하더라도대사율을조절하여
SMR
범위를유지하였지만30%
이하에서는MO
2가SMR
이하로감소하는현상이뚜렷하여전형적인산소조절자로나타났다
(Fig. 3).
저산소수중에서어류가직면하는일차적인문제는호흡항 상성을유지하는것이다
. Maxime et al. (2000)
은산소조절자 인turbot S. maximus
에서관찰된저산소노출시MO
2조절기 작은호흡수및단위시간당심장박출량의증가를통해아가미 로부터이용가능한산소량을증가시켜서MO
2를일정하게유 지하지만,
저산소노출동안아가미근육운동의증가에도불 구하고turbot
의MO
2는증가하지않는현상을관찰하였다.
저 서어류에서흔히관찰되는이러한조절반응은첫째,
저산소환 경에서는호흡에사용되는에너지비용을낮추고둘째,
호흡에 사용되는에너지가일정하거나증가하는경우에는다른조직 의산소흡수를감소시키거나각기관별임계산소장력이다양 Fig. 6. Changes in blood electrolyte (Na+, K+ and Cl-) of the oliveflounder Paralichthys olivaceus exposed to stepwise hypoxic and normoxic water at 20℃. The blood was collected after exposure for 1 h and 30 min in ≥30% and 20% of oxygen saturation, re- spectively. Each data point represents the mean±SD of electrolytes (n=5). Different letters indicate P<0.05.
40 80 120 160 40 80 120 160
Metabolic rate (mg O
2kg
-1h
-1)
40 80 120 160200 450 g
40 80 120 160
Time (h)
0 2 4 6 8 10 12 14 16 18
40 80 120
160 386 g
420 g 424 g
403 g
Oxygen saturation (%)
0 10 20 30 40 50 60 70 80 90 100
0 20 40 60 80 100 120 140 160 180
Normoxic SMR
0 10 20 30 40 50 60 70 80 90 100
Metabolic rate (mg O
2kg
-1h
-1)
0 20 40 60 80 100 120 140 160 180Scrit
Normoxic SMR RMR
Scrit
RMR
Y=2.374X - 7.702 (r2=0.842)
Y=2.336X + 1.426(r2=0.871)
450 g
420 g
Oxygen saturation (%)
10 20 30 40 50 60 70 80 90 100
Metabolic rate (mg O
2kg
-1h
-1)
0 20 40 60 80 100 120 140 160 180
Graduated hypoxia Return to normoxia Normoxic SMR a
ad
a b
a
c cd
d Normoxic SMR
Blood pH
7.40 7.45 7.50 7.55
7.60 Graduated hypoxia
Return to normoxia Normoxic control
Oxygen saturation (%)
10 20 30 40 50 60 70 80 90 100
Blood PO2 (mmHg) 20 40 60 80 100
120 aa
ab b
c
b c
Oxygen saturation (%)
10 20 30 40 50 60 70 80 90 100
130 135 140 145 150 155 160 165 170 175 180
Plasma electrolyte (mM)
2.0 2.5 3.0 3.5 4.0 4.5
Graduated hypoxia Return to normoxia Normoxic control
Potassium
Chloride Sodium
a a a a
a a
b
Lactate (mM)
0 1 2 3 4 5 6
Glucose (mg/100 mL)
0 10 20 30 40
Graduated hypoxia Return to normoxia Normoxic control
Oxygen saturation (%)
10 20 30 40 50 60 70 80 90 100
Cortisol (ng/mL)
0 20 40 60 80
aa
b bc
a c
a
a a a a
b b
bc b
a a cd
d
ab
a
Fig. 7. Changes in plasma lactate, glucose and cortisol of the olive flounder Paralichthys olivaceus exposed to stepwise hypoxic and normoxic water at 20℃. The blood was collected after exposure for 1 h and 30 min in ≥30% and 20% of oxygen saturation, respec- tively. Each data point represents the mean±SD of measurements (n=5). Different letters indicate P<0.05.
40 80 120 160 40 80 120 160
Metabolic rate (mg O
2kg
-1h
-1)
40 80 120 160200 450 g
40 80 120 160
Time (h)
0 2 4 6 8 10 12 14 16 18
40 80 120
160 386 g
420 g 424 g
403 g
Oxygen saturation (%)
0 10 20 30 40 50 60 70 80 90 100
0 20 40 60 80 100 120 140 160 180
Normoxic SMR
0 10 20 30 40 50 60 70 80 90 100
Metabolic rate (mg O
2kg
-1h
-1)
0 20 40 60 80 100 120 140 160 180Scrit
Normoxic SMR RMR
Scrit
RMR
Y=2.374X - 7.702 (r2=0.842)
Y=2.336X + 1.426(r2=0.871)
450 g
420 g
Oxygen saturation (%)
10 20 30 40 50 60 70 80 90 100
Metabolic rate (mg O
2kg
-1h
-1)
0 20 40 60 80 100 120 140 160 180
Graduated hypoxia Return to normoxia Normoxic SMR a
ad
a b
a
c cd
d Normoxic SMR
Blood pH
7.40 7.45 7.50 7.55
7.60 Graduated hypoxia
Return to normoxia Normoxic control
Oxygen saturation (%)
10 20 30 40 50 60 70 80 90 100
Blood PO2 (mmHg) 20 40 60 80 100
120 aa
ab b
c
b c
Oxygen saturation (%)
10 20 30 40 50 60 70 80 90 100
130 135 140 145 150 155 160 165 170 175 180
Plasma electrolyte (mM)
2.0 2.5 3.0 3.5 4.0 4.5
Graduated hypoxia Return to normoxia Normoxic control
Potassium
Chloride Sodium
a a a a
a
a
b
Lactate (mM)
0 1 2 3 4 5 6
Glucose (mg/100 mL)
0 10 20 30 40
Graduated hypoxia Return to normoxia Normoxic control
Oxygen saturation (%)
10 20 30 40 50 60 70 80 90 100
Cortisol (ng/mL)
0 20 40 60 80
aa
b bc
a c
a
a a
a a
b b
bc b
a a cd
d
ab
a