A Study on the Correlation Analysis of China's IC Industry Profit and R&D Expenditure, New Products Development Costs and
Annual Export Volume
Tian-Jiao Guo1,Jun-Won Yang2, Hyung-Ho Kim2*
1Professor, Faculty of Information Engineering, Jilin Engineering Normal University
2Professor, Dept. of Air Transport & Logistics, Sehan University
중국 IC산업의 산업이익과 R&D 지출, 신제품 개발비 및 연간 수출량의 상관관계 분석
곽천교1, 양준원2, 김형호2*
1길림공정기술사범학원 정보공학부 교수, 2세한대학교 항공교통물류학과 교수
Abstract IC industry is one of the foundation and core industries of modern information industry.
Therefore, the study of this industry has important theoretical and practical significance. The main purpose of this study is to measure the degree of close correlation between the two indexes through correlation analysis of the selected indicators, so as to study the development trend and direction of IC. Based on the theory of induced innovation and the theory of comparative advantage, this paper analyzes the correlation between the profit of the IC industry and the following three indicators by using chart analysis method, covariance analysis method and correlation coefficient analysis method.
These three indicators are R&D expenditure, new product development costs and annual export amount of IC. The selected data are mainly from CHINA STATISTICS YEARBOOK ON HIGH-TECHNOLOGY INDUSTRY. Through the research, it is found that the profit of China’s IC industry is positively correlated with the first two indicators and negatively correlated with the annual export amount.
Key Words : IC industry, Correlation analysis, Chart analysis, Covariance analysis, Theory of induced innovation
요 약 IC 산업은 현대 정보기술 산업의 핵심으로 국가의 경제발전을 지원하고, 국가안보를 보장하는 전략적이며 기본 적인 선도 산업이다. 따라서 이 분야에 대한 연구는 이론적으로나 현실적으로 매우 중요하다 할 수 있다. 본 연구의 주요목적은 선택된 지표에 대한 관련성분석을 통하여 두 지표 사이의 밀접한 관련정도를 가늠하여 집적회로의 발전추 세와 방향을 연구하는 것이다. 본 연구에서는 유도혁신 이론과 비교우위 이론을 바탕으로 차트 분석법, 공분산 분석법, 상관 계수 분석법을 이용하여 중국 IC 산업의 이익과 다음의 3가지 지표 사이의 상관관계를 분석하였다. 분석에 사용 된 세 가지 지표는 중국 IC산업의 R&D 지출, 신제품 개발 비용 및 연간 수출량이다. 분석에 사용된 데이터는 “첨단기 술 산업에 대한 중국 통계연감” 자료를 사용하였다. 본 연구를 통해, 중국 IC산업의 이익은 R&D 지출비용 및 신제품 개발비와 정의 상관관계를 나타내고, 연간 수출량과 부의 상관관계가 있음을 확인하였다.
주제어 : IC산업, 상관관계 분석, 차트 분석, 공분산 분석, 유도혁신 이론
*This Paper was supported by the Sehan University Research Fund in 2019.
*Corresponding Author: Hyung-Ho Kim([email protected])
Received May 21, 2019 Revised June 23, 2019
Accepted August 20, 2019 Published August 28, 2019
1. Introduction
As the core of information technology industry, integrated circuit industry is a strategic, basic and pioneering industry that supports economic and social development and guarantees national security [1]. It is one of the global high-tech industries that have developed rapidly in recent decades. According to the semiconductor association of America's statistics on global semiconductor sales, from 2014 to 2017, China's share of the global semiconductor sales market increased by six percentage points, and China has become the largest market of global semiconductor sales. With the gradual expansion of China's market share, the IC industry has developed rapidly in the past decade. Although the sales volume of the IC industry decreased year on year due to the impact of the Asian financial crisis in 2008 and 2009, the rest of the year witnessed double-digit growth. Overall, China's IC industry growth is optimistic.
This paper mainly studies the correlation between R&D expenditure, new product development expenditure and export amount over the years. The main purpose of the study is to measure the degree of their close correlation through the industry correlation analysis of the selected indicators, so as to study the development trend and direction of the integrated circuit industry. From a theoretical point of view, the IC industry has developed rapidly with the new characteristics emerging every year. Due to the general weak theoretical foundation of the integrated circuit industry, the lack of guidance for correlation research, and based on the new market environment, the development planning needs to be adaptive adjustment. From the perspective of reality, the IC industry will experience many difficulties and opportunities in the process of operation and development.
Facing the increasingly competitive environment, it is necessary to find the right direction and
orientation through correlation analysis. It is necessary to formulate development strategies and set long-term development goals. According to their own advantages and disadvantages of the adjustment to ensure that they can survive in the fierce market competition and healthy development.
2. Theoretical Background and Literature Review
2.1 The research status
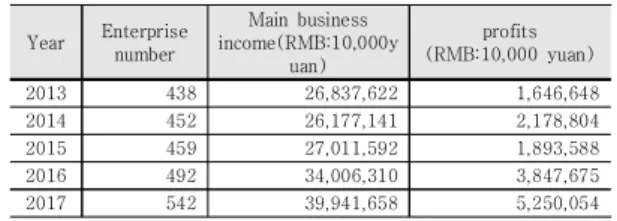
In recent years, the growth of IC field in China is obvious to all.Driven by factors such as rapid industrial development, favorable policies and technological progress, the domestic IC industry has developed rapidly and maintained rapid growth.The following Table 1 shows the revenue of China's IC industry in the past five years. As can be seen from the Table 1, the number of IC enterprises in China has increased steadily in recent years, the main business income has maintained a sustained growth, and the profit has shown a remarkable performance.
At present, the R&D investment intensity of the global semiconductor industry has always been very high. After 2000, the overall R&D investment proportion of the global integrated circuit has been maintained at a high level of 15%-18%, much higher than other industries. As a technology-driven industry, high-tech industry maintains a high R&D input, which is the direct driving force for industrial development [2]. At
Year Enterprise number
Main business income(RMB:10,000y
uan)
profits (RMB:10,000 yuan)
2013 438 26,837,622 1,646,648
2014 452 26,177,141 2,178,804
2015 459 27,011,592 1,893,588
2016 492 34,006,310 3,847,675
2017 542 39,941,658 5,250,054
Table 1. IC enterprise revenue income statement in 2013-2017
the initial stage of development, China's IC industry mainly started from the packaging and testing links with low technology content and suitable capital threshold, and developed rapidly.
Of course, China's IC industry structure is also being constantly optimized, starting to pay attention to the development of IC R&D. In addition, R&D input has the characteristics of time lag. That is to say, it takes time from research and development to acquire new technical knowledge and apply it to production. Only when the commodities developed by the enterprise are commercialized and have a good performance in the market, the performance of the company can reflect the r&d revenue [3].
Therefore, theoretically speaking, the influence of R&D investment on enterprise profit is lagging behind.
Supported by the export-oriented policy, China has been continuously establishing foreign trade relations with other countries, and the trade deficit has gradually expanded [4]. At present, China's IC product structure is mainly concentrated in the middle and low-end products, and the core products of all links of the integrated circuit industry chain are mainly dependent on imports. Therefore, the development of new products has been put on the agenda. The following Table 2 shows the R&D situation and new product development of IC in China in the
past five years. We have noticed that the number of R&D institutions and expenditure increase year by year, while the number of full-time equivalent R&D personnel and the number of R&D projects increase or decrease year by year.
The number of new product development projects is increasing year by year, and the new product development funds and sales revenue are also increasing year by year.
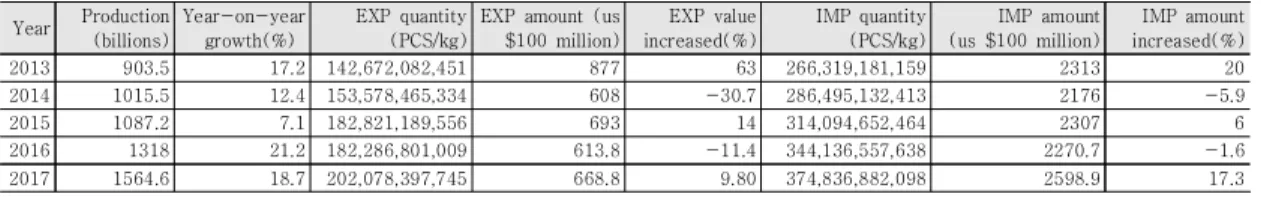
Driven by the strong domestic market demand, China's IC industry as a whole has maintained stable and rapid growth under the environment of a series of policies introduced by the state, and has begun to usher in an accelerated period of development. As can be seen from the following Table 3, the output of IC is increasing year by year, but the import and export amount has increased and decreased. Among them, the import and export situation in 2014 and 2016 was relatively low, and recovered in 2017.
In 2014, due to the decline in the price of global IC, the number of imported and exported products increased and the price fell. However, on March 7, 2016, the us department of commerce held that ZTE violated the export ban imposed by the us government on Iran, so it decided to impose export restrictions on ZTE, not allowing ZTE to purchase key chips, and completely stop technical support to ZTE.
Year Number of R&D institutions
R&D expenditure (RMB: 10,000 yuan)
Expenditure for new product development (RMB:10,000 yuan)
Total revenue from new product sales (RMB: 10,000 yuan)
2013 169 753,810 1,008,634 6,093,248
2014 209 934,343 1,170,316 8,428,940
2015 206 1,043,132 1,173,217 7,386,773
2016 249 1,261,453 1,421,568 7,637,921
2017 285 1,390,589 1,729,735 8,336,144
Table 2. R&D and new product development in 2013-2017
Year Production (billions)
Year-on-year growth(%)
EXP quantity (PCS/kg)
EXP amount (us
$100 million)
EXP value increased(%)
IMP quantity (PCS/kg)
IMP amount (us $100 million)
IMP amount increased(%)
2013 903.5 17.2 142,672,082,451 877 63 266,319,181,159 2313 20
2014 1015.5 12.4 153,578,465,334 608 -30.7 286,495,132,413 2176 -5.9
2015 1087.2 7.1 182,821,189,556 693 14 314,094,652,464 2307 6
2016 1318 21.2 182,286,801,009 613.8 -11.4 344,136,557,638 2270.7 -1.6
2017 1564.6 18.7 202,078,397,745 668.8 9.80 374,836,882,098 2598.9 17.3
Table 3. IC annual production and annual import & export amount in 2013-2017
Although the us government lifted the ban on March 21, half a month after the policy was implemented, the subsequent impact on the industry has not been eliminated. The output increased year by year can be absorbed, thanks to the release of the domestic market. The domestic output value of China's IC industry increases year by year, higher than the growth rate of the whole industry.
2.2 Theoretical background
Theory of induced innovation. Theory of induced innovation discusses the direction of technological progress. According to the theory of induced innovation, the change of resource endowment induces technological change. When one factor (such as capital) becomes richer relative to another (such as labor), specific relative factor prices can induce technological shifts that using more capital and saving labor. This technological shift comes from profit-maximising entrepreneurs' efforts to reduce production costs by substituting relatively abundant (and therefore cheaper) resources for scarcer (and therefore more expensive) resources. However, to realize the potential benefits of technological innovation or technological change, institutional innovation must be carried out. Therefore, the emergence of new knowledge leading to technological change is the result of the institutional development process, and technological change in turn represents a powerful source of demand for institutional change.
Theory of comparative advantage. The theory of comparative advantage also emphasizes the importance of technological progress to economic development. According to this theory, transferring or borrowing technology from developed countries is the main way to achieve rapid economic growth in underdeveloped countries.
However, transferred technology must conform to the country's resource endowment structure, which determines its comparative advantage in the economy. For example, when a country's labor force is
relatively abundant, the country's comparative advantage lies in labor-intensive technology industries.
If the comparative advantage is followed and labor-intensive industries are developed, the cost of products will be relatively low due to the use of more cheap labor and less expensive capital in the production process, so the products will be competitive and the profits will be higher. On the contrary, when capital is relatively abundant and labor is relatively scarce, capital-intensive industries have a comparative advantage. With the improvement of factor endowment structure, industrial structure and technical level will also be correspondingly improved, and the economy will also be developed. As an industry with relatively large trade volume, the theory of comparative advantage provides basic theoretical support for the IC industry. At present, China is relatively backward in the technology level of the IC industry, and the corresponding products are at the "comparative disadvantage" level. This is also the reason why the Chinese government has issued relevant policies to support the innovation of the IC industry in recent years.
2.3 Literature review
According to the current situation of international IC industry, domestic and foreign scholars mainly analyze it from the perspectives of technological innovation, industrial mode and industrial development trend.
First of all, from the perspective of technology R&D and innovation, Michael porter believes in the national competitive advantage that technological progress and independent innovation are the decisive factors for a country (industry or enterprise) to obtain sustainable competitiveness, and R&D is the source and internal power of enterprise growth and the basic investment guarantee for enterprise independent innovation.
Only by constantly increasing R&D investment can enterprises gain long-term advantages in technology and achieve sustainable development
in the fierce market competition. However, due to the huge amount of R&D investment and the uncertainty of the return period and result, R&D investment may affect the increase of the company's value, which is reflected by the expected return of the stock namely the market price of the stock [5]. Michael Fritsch think that a main motive of R&D cooperation could be to increase the degree of specialization by outsourcing parts of the innovation process. In this case the cooperation constitutes a substitute for internal R&D activities and we may expect that the higher level of specialization leads to a lower share of value added to turnover in those firms that maintain R&D cooperations [6].Yin-Hui Cheng (2010) think that, the investment in research and development (R&D) for semiconductor industry is never small as the technology cycle time (TCT) is relatively short comparing to other industries, thus a semiconductor company requires lots of technological innovations and capital offerings to maintain. From the economic point of view, increasing R&D expenditures and patent counts cause constructional and technological changes in the industry and lead to economic development.
[7].Bruce S. Tether think that ,if we consider that R&D is associated with the development of higher-level innovations (i.e. more novel and/or more complex innovations), this suggests co-operations are associated with higher-level innovations [8].
Secondly, some scholars put forward Suggestions from the aspects of industrial profit and industrial mode. Chen ling (2010) analyzed the development status of China's IC industry, pointed out that China's IC industry is still at the lower end of the IC industry chain, and proposed that it should be advanced by "parallel evolution mode" instead of the traditional "east Asian mode" of industrial upgrading. Zhou min (2015) found that Chinese integrated circuit enterprises are at the low level of global value chain through model calculation. By studying the reasons, it is
found that China's domestic demand for electronic information products is insufficient and is export-oriented.
Thirdly, some scholars give Suggestions by studying the development trend of local industries.
Wu dejin (2013) studied the transformation and upgrading path of electronic information industry in FuJian province, and put forward development ideas for industrial transformation from four aspects: overall industrial innovation ability, enterprise core competitiveness, urban brand influence and regional industrial cohesion [9]。
Jiang zhigang (2007) studied the promotion effect of labor cost comparative advantage on advanced factor conditions, delicate demand conditions, industrial cluster development and horizontal competition environment, and believed that labor cost comparative advantage is the basic factor to enhance the competitiveness of electronic information industry [10]. Chen honger (2014) made analysis and evaluation from four dimensions of technological innovation ability, economic development level, financial benefit index and industrial cluster scale by using gray correlation analysis, and the results showed that technological innovation ability and industrial cluster competitiveness contributed the most to China's high-tech industry competitiveness [11]. Sheng peihong and zhang yong (2014) studied and analyzed the development status of suzhou electronic information industry. They believe that suzhou should take advantage of its advantageous location to establish a multi-level and multi-directional cooperation model. In particular, by absorbing advanced technologies from Shanghai, Japan, South Korea, and Europe and the United States, the industrial structure adjustment can be strengthened, meanwhile the product development and technological innovation ability of local enterprises can be enhanced. On the basis of export-oriented economy, the industrial market structure can be adjusted continuously, and the domestic sales of products of local enterprises
can be supported, so as to enhance the development of domestic market [12].
Finally, through literature research, it is found that correlation analysis is widely used in many fields.For example, sang-kook Park et al.
analyzed the correlation between the GDP of South Korea's financial industry and IT budget in 20 years since 1993 [13].Seung-soo Shin et al.
analyzed the correlation between service quality of social commerce and consumer satisfaction [14].Jeong-il Choi et al. drew a conclusion after analysis.Apartment prices in Seoul are highly positively correlated with KOSPI, while apartment prices in Seoul are highly negatively correlated with interest rates [15].
3. Research Method
In this paper, the method of comparative analysis and empirical analysis is adopted. The application of each analysis method in the paper is explained below.
3.1 Method of Comparative Analysis
In this paper, the comparative analysis method is mainly used to analyze the relevance of the IC industry. This paper selects the relevant data that have affected the IC industry in China in different periods, and makes a longitudinal comparison of each index to intuitively analyze the trend of the IC industry in China in the past development process.
3.2 Empirical Analysis
The empirical analysis of this paper mainly adopts the correlation analysis. Correlation Analysis is one of the commonly used methods for web Analysis. Through the analysis of the relationship between different characteristics or data, the key influence and driving factors in business operation are found, and the business development is predicted. There are many methods
of correlation analysis, which can quickly discover the relationship between data, such as positive correlation, negative correlation or non-correlation.
This method can transform the relationship between data into a model and predict the future business development through the model.
This paper collects and sorts out all kinds of relevant data of China's IC industry, such as industrial profit, expenditure on new product development, expenditure on R&D and export amount of IC in recent 5 years, and then further processes the data. By means of chart correlation analysis method, covariance calculation method and correlation coefficient analysis method, new product development expenditure, R&D expenditure and annual export amount are selected to calculate the correlation between them and IC industry profit.
Therefore, the factors affecting the development of IC industry can be understood correspondingly, and the development trend of China's IC industry can be further analyzed, and corresponding Suggestions can be put forward as well.
The originality of this paper lies in that although there are many literatures on correlation analysis, this research on IC industry is rare. In addition, in the study of IC industry, Chinese and foreign scholars mostly focus on the technology, market and resources of the industry, instead of using covariance and other quantitative research methods to study the correlation of IC industry indicators.
4. Research Results
The following is part of the data of China's IC industry in the recent five years. Here we select three indicators to study the correlation between them and the profits of the IC industry. These three indicators are new product development expenditure, R&D expenditure and annual export amount. Each row in the Table 4 below represents the value of each indicator for the year.
Year
Expenditure for new product development (RMB:10,000 yuan)
R&D expenditure(R
MB: 10,000 yuan)
Export amount (us $100 million)
profits(R MB:10,00 0 yuan)
2013 1,008,634 753,810 877 1,646,648
2014 1,170,316 934,343 608 2,178,804
2015 1,173,217 1,043,132 693 1,893,588
2016 1,421,568 1,261,453 613.8 3,847,675
2017 1,729,735 1,390,589 668.8 5,250,054
Table 4. China IC industry data in 2013-2017
Empirically, there should be a link between these three indicators and profits. But these intuitions alone do not prove that the relationship is real or measure its strength. Therefore, we hope to find out the relationship between the three sets of data through correlation analysis and measure the relationship. Here we use the chart correlation analysis method, covariance analysis method and correlation coefficient method.
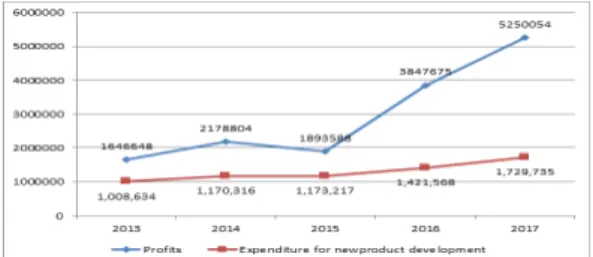
4.1 Correlation Analysis of New Product Development Expenditure and IC Industry Profit
Chart correlation analysis. The graph correlation analysis method is to visualize the data, and it is difficult to find the trend and connection from the perspective of data, while the trend and connection will become clear after the data points are drawn into the graph. In order to compare the changes and trends of the two sets of data more clearly, we use the two-axis broken line graph in Figure 1. The main axis is used to draw the profit data of IC industry, and the secondary axis is used to draw the expenditure of new product development of the data.
Fig. 1. Correlation analysis chart of Expenditure for new product development & IC industry profit
According to the Figure 1, it can be found that the changes and trends of new product development expenditure and IC industry profit are roughly the same. From the overall trend, both new product development expenditure and IC industry profit show a growing trend. From the perspective of regularity, the lowest point of new product development expenditure and IC industry profit data appeared in the same year.
After the above comparisons, we can say that there is some correlation between the expenditure on new product development and the profit of integrated circuit industry. However, this method is too complicated in the whole analysis process and interpretation, and many problems will occur if it is replaced by more complicated data or less relevant data.
Covariance and covariance matrix. The second method of correlation analysis is to calculate the covariance. Covariance is used to measure the overall error of two variables. If the change trend of two variables is consistent, covariance is positive, indicating that the two variables are positively correlated. If the trend of the two variables is opposite, the covariance is negative, indicating that the two variables are negatively correlated. If two variables are independent of each other, then the covariance is 0, indicating that the two variables are not correlated. The following is the covariance calculation formula:
The following is the calculation process and result of the covariance between the expenditure on new product development and the profit of the IC industry. Based on the calculation, we come up with a large positive value of 3.42239E+11, indicating that the two data sets are positively correlated. The profit of IC industry increases with the expenditure of new product development.
Covariance measures the correlation between
variables by number, where positive value means positive correlation and negative value means negative correlation. But the closeness of the correlation cannot be measured. When we are faced with multiple variables, it is impossible to explain which two sets of data have the highest correlation through covariance. To measure and contrast the closeness of the correlation, the next method is needed: the correlation coefficient.
Correlation coefficient method. The Correlation coefficient is a statistical indicator of the close relationship between the reaction variables, and the value range of the Correlation coefficient is between 1 and -1. 1 means two variables are completely linearly correlated, -1 means two variables are completely negatively correlated, and 0 means two variables are not correlated.
The closer the data is to 0, the weaker the correlation. The following is the calculation formula of the correlation coefficient.
Where rxy is the sample correlation coefficient, Sxy is the sample covariance, Sx is the sample standard deviation of X, and Sy is the sample standard deviation of y. The following are the calculation formulas of Sxy covariance, Sx and Sy
standard deviation respectively. Because it's the sample covariance and the sample standard deviation, we're using n minus 1 in the denominator.
The formula for calculating the Sxy sample covariance is as follows:
The formula for calculating the Sx sample standard deviation:
The formula for calculating the Sy sample standard deviation:
The following is the process of calculating the correlation coefficient. In the Table 5, we calculate the covariance and standard deviation of x and y variables respectively, and obtain the correlation value of 0.985465. 0.985465 greater than 0 indicates a positive correlation between the two variables, while 0.985465 is very close to 1, indicating a high correlation between the two variables.
The advantage of the correlation coefficient is that it can measure the relationship between variables through Numbers and has directivity. 1 represents positive correlation and -1 represents negative correlation. It can measure the strength of the relationship between variables. The disadvantage is that this kind of relationship cannot be used to predict the data. In short, the relationship between variables is not refined and solidified to form a model.
IC industry profit (Y)
Expenditure for new product development (X) IC industry profit (Y) 1
Expenditure for new
product development(X) 0.985465 1 Table 5. Correlation coefficient 1
4.2 Correlation Analysis of R&D Expenditure and IC Industry Profit
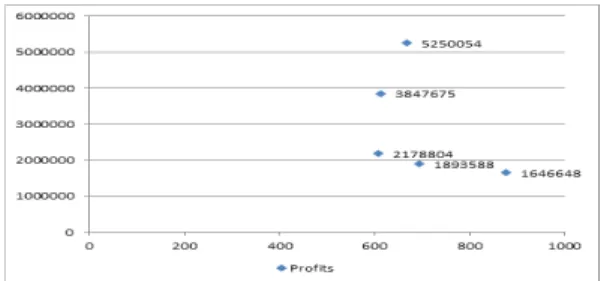
Figure 2 is a more intuitive analysis of the scatter diagram.The scatter plot excludes the time dimension and focuses on the relationship between R&D spending and IC industry profits.
Before drawing Figure 2, we determined that R&D expenditure was the independent variable X and the profit of IC industry was the dependent variable y.Therefore, Figure 2 is a scatter chart drawn based on IC industry profits and R&D expenditure data in recent five years.
Fig. 2. Correlation analysis chart of R&D expenditure and IC industry profit
The X-axis is the independent variable R&D expenditure data, and the Y-axis is the dependent variable IC industry profit data. It can be found from the distribution of data points that the independent variable x and the dependent variable y have the same trend of change. When the R&D expenditure increases, the profit of the IC industry also increases.
Covariance correlation analysis. The calculation process and result of the covariance between the expenditure of R&D funds and the profit of the IC industry show a large positive value of 2.9078E+11, indicating that the two data sets are positively correlated. The profit of IC industry increases along with the growth of expenditure of R&D funds.
Correlation coefficient. In the Table 6, we calculate the covariance and standard deviation of x and y variables respectively, and obtain the correlation value of 0.927886915. 0.927886915 greater than 0 indicates a positive correlation between the two variables, while 0.927886915 is very close to 1, indicating a high correlation between the two variables.
IC industry profit (Y) R&D expenditure (X) IC industry profit(Y) 1
R&D expenditure(X) 0.927886915 1 Table 6. Correlation coefficient 2
4.3 Correlation Analysis of IC Export Amount and IC Profit
Similarly, we only focus on the relationship
between the annual export amount of IC and the profit of the IC industry. Before drawing the scatter plot, we marked the annual export amount of IC as X, namely the independent variable, and the industrial profit of IC as y, namely the dependent variable. Figure 3 is a scatter chart drawn based on IC industry profits and annual export amount data in recent five years.The X-axis is the data of independent variable annual export amount of IC, and the Y-axis is the data of dependent variable IC industry profit. It can be found from the distribution of data points that the independent variable x and the dependent variable y have different changing trends, and the profit of the IC industry does not increase with the increase of the export amount in that year.
Fig. 3. Correlation analysis chart of annual export amount of IC and IC industry profit
Covariance correlation analysis. After calculating the covariance between the annual export amount of integrated circuit and the profit of integrated circuit industry, we get a value of -60329640.22, so it can be shown that the two groups of data are negatively correlated. The value of the phase relationship in the Table 7 is -0.447362229.Less than 0 indicates a negative correlation between the two variables.
IC industry profit (Y) IC export amount (X) IC industry profit(Y) 1
IC export amount(X) -0.447362229 1 Table 7. Correlation coefficient 3
5. Conclusions and Implications
According to the above analysis, it can be concluded that the expenditure on new product development is positively correlated with the profit of IC industry. Similarly, R&D expenditure is positively correlated with the profit of IC industry. Firstly, through the analysis of line chart and scatter chart, the changes and trends of these two indicators and IC industry profits are roughly the same. Secondly, the covariance was calculated separately, and large positive values were obtained. Therefore, it can be indicated that the two groups of data are positively correlated.
Finally, the values of the phase relations obtained are all very close to 1, indicating that the two variables of the two groups of data are highly correlated. However, the export amount of IC is negatively correlated with profit.
According to the above research results, we find that the export amount of integrated circuits is negatively correlated with industrial profits, which seems to be different from our previous cognition. It comes down to the following reasons. Firstly, although China's export of IC has maintained a momentum of nearly steady growth in recent years, the export products mainly come from the manufacturing process of IC, and the value and technical requirements are relatively low, so that the export price continues to decline. Although the output of IC is increasing year by year, a considerable part of the profit is benefited from the release of domestic demand. Secondly, as can be seen from the import and export data sheet of IC, China's import and export trade deficit of IC increases year by year, resulting in the situation of high-priced imports and low-priced exports, which also leads to the increase of production and operation costs. Thirdly, the trade frictions between China and the United States in high-tech industries are constant, and the IC industry, as one of the sensitive industries in the high-tech
industry, leads to the import and export situation being restricted to varying degrees.
Clearly, there are implications. In order to improve the profit level of the IC industry, relevant institutions should treat the IC industry as a key industry and cultivate it carefully. In recent years, China's IC industry has achieved rapid development and made great progress. How to establish an industry chain based on application, focusing on transformation, multi-function and high starting point to integrate domestic advantageous resources and jointly tackle the difficult technologies in the field of IC is a beneficial attempt to pursue independent innovation and break through the technological bottleneck.
Of course, the study has many shortcomings.
This paper only studies the new product development and R&D investment which are positively correlated with the IC industry profit, and the export amount index which is negatively correlated with it. There are many indicators related to the profit of the IC industry, and this study is not comprehensive. Moreover, among the indicators showing a positive correlation, this paper did not further study the feasibility, operability and impact of the implementation of the indicators. For example, in terms of the R&D input expenditure index, the research on the correlation of high-tech industry at the present stage mainly focuses on the R&D input intensity.
China's total R&D input in 2017 has reached the second place in the world, with the input intensity (the ratio of R&D expenditure to GDP) being 2.12%. It can be said that China's scientific research input is not too weak, nor is there a lack of funds, but technological innovation is not balanced, so future research should focus on the allocation of scientific research funds. Only in this way can we break through the existing technological level in technology research and development, develop typical products that can form new economic growth points, accelerate the technological upgrading of existing production
lines, so as to form large-scale production capacity and improve product level in the future.
REFERENCES
[1] MIIT. (2014) Outline of national IC industry development. [Brochure]. Peking.
[2] Y. W. Zhu & K. N. Xu. (2006). The Empirical Research on R&D Efficiency of Chinese High-tech Industries, China Industrial Economics, 20(11), 38-45.
DOI:10.19581/j.cnki.ciejournal.2006.11.005
[3] S. T. LU & M. Fang. (2011). Correlation Analysis of R&D Investment and Enterprise Performance of High-tech and High-growth Enterprises , Finance and Accounting Monthly, 31(36), 12-15.
DOI:10.19641/j.cnki.42-1290/f.2011.36.005
[4] Y. Qu, X. Y. Qin & H. G. Huang. (2018). The Impact of China-US Trade Friction on China's Industry and Economy Based on Section 301 Investigation Report on China in 2018, Forum on Science and Technology in China, 34(5), 128-135.
DOI:10.13580/j.cnki.fstc.2018.05.015
[5] W. Y. Zhou, Z. Y. Wang & L. Su. (2011). Correlation Analysis between R&D Investment and The Value of Medium-sized High-tech Companies, Finance and Accounting Monthly, 31(27), 35-38.
DOI:10.19641/j.cnki.42-1290/f.2011.27.010
[6] M. Fritsch & R. Lukas. (2001). Who co-operates on R&D, Research Policy, 30(2),297-312.
DOI:10.1016/S0048-7333(99)00115-8
[7] Y. H. Cheng, F. Y. Kuan & S. C. Chuang. (2009).
Profitability decided by patent quality? An empirical study of the US semiconductor industry, Scientometrics, 82(1), 175-183.
DOI:10.1007/s11192-009-0080-4
[8] S. Bruce & Tether. (2002). Who co-operates for innovation, and why: An empirical analysis, Research Policy,31(6), 947-967.
DOI:10.1016/S0048-7333(01)00172-X
[9] D. J. Wu. (2013). The Path and Countermeasures of Electronic Information Industry Transformation and Upgrading in FUJIAN Province, Fujian Tribune - Social sciences, 30(1), 137-142.
http://www.cnki.com.cn/Article/CJFDTotal-FJLW2013 01027.html
[10] W. W. Yang & Z. G. Jiang. (2007). Research on the Influencing Factors of the International Competitiveness of China's Electronic Information Industry, Industrial &
Science Tribune, 6(11), 33-35.
http://cdmd.cnki.com.cn/Article/CDMD-10533-20081 65373.htm
[11] H. E. Chen & G. Chen. (2002). An Evaluating model
and Case Study on the Competence of Regional Industry, China Soft Science, 17(1), 99-104.
http://www.cnki.com.cn/Article/CJFDTotal-ZGRK2002 01023.htm
[12] P. H. Sheng & Y. Zhang. (2014). Analysis on SUZHOU’s Electronic Information Industry Competitiveness, Journal of Shangqiu Vocational and Technical College, 13(4), 53-57.
http://www.cnki.com.cn/Article/CJFDTotal-SQZJ20140 4024.htm
[13] S. K. Park & K. S. Han. (2014). A Study on the Prospects of the Financial IT Services Industry using the Correlation Analysis of the IT Budget in the Financial Industry.
Journal of Digital Convergence, 12(3), 55-62.
DOI:10.14400/JDC.2014.12.3.55
[14] S. S. Shin, M. Y. Shin, Y. S. Jeong & J. H. Lee. (2015).
An Investigation of Social Commerce Service Quality on Consumer's Satisfaction. Journal of Convergence for Information Technology, 5(2), 27-32.
http://www.earticle.net/Article/A269193
[15] J. I. Choi & O. D. Lee. (2014). Correlation Analysis Among the Price of Apartments in Seoul, Stock Market and main Economic Indicators. Journal of Digital Convergence, 12(2), 45-58.
DOI:10.14400/JDC.2014.12.2.45
곽 천 교(Tian-Jiao Guo) [정회원]
․ 2001년 7월 : 길림사범대학 컴퓨터학 과(이학사)
․ 2009년 12월 : 길림대학 컴퓨터학과 (공학석사)
․ 2018년 3월 ~ 현재 : 세한대학교 경영 대학원(박사과정)
․ 2001년 8월 ~ 현재 : 길림공정기술사 범학원 정보공학부 교수
․ 관심분야 : 소프트웨어 공학, CAT
․ E-Mail : [email protected]
양 준 원(Jun-Won Yang) [정회원]
․ 1989년 2월 : 영남대학교 전자공학과 (공학사)
․ 1995년 4월 : 일본게이오대학 이공학 연구과(공학석사)
․ 1998년 4월 : 일본게이오대학 이공학 연구과(공학박사수료)
․ 1999년 3월 ~ 현재 : 세한대학교 항공 교통물류학과 교수
․ 관심분야 : 전자파해석, 위성통신, 스마트물류
․ E-Mail : [email protected]
김 형 호(Hyung-Ho Kim) [정회원]
․ 1989년 2월 : 경희대학교 전자계산공 학과(공학사)
․ 1992년 2월 : 경희대학교 전자계산공 학과(공학석사)
․ 2018년 2월 : 인천대학교 동북아물류 대학원(물류학박사)
․ 1998년 3월 ~ 현재 : 세한대학교 항공 교통물류학과 교수
․ 관심분야 : 신경회로망, 항공운송, System Dynamics
․ E-Mail : [email protected]