VOC
와 폼알데히드의 농도 변화에 관한 연구이영섭
†․김인범
*․고원경
**서울과학기술대학교 안전공학과․*서울과학기술대학교 산업대학원 안전공학과
**서울과학기술대학교 에너지환경대학원 안전공학과
(2011. 11. 5. 접수 / 2012. 6. 18. 채택)
A Study on the Concentration Variations of VOCs and Formaldehyde on the Type of Interior Materials of New Vehicles by Simulation Program
Young-Seop Yi
†․In-Bum Kim
*․Won-Kyoung Ko
**Department of Safety Engineering, Seoul National University of Science and Technology
*Department of Safety Engineering, Graduate School of Industry & Engineering, Seoul National University of Science and Technology
**Department of Safety Engineering, Graduate School of Energy and Environment, Seoul National University of Science and Technology
(Received November 5, 2011 / Accepted June 18, 2012)
Abstract : The concentrations of Volatile Organic Compounds(VOCs) and Formaldehyde(HCHO) for interior mate- rials of new vehicles are estimated and recognized by using the simulation program known as IAQx. The concen- trations of contaminants are estimated and evaluated by the ventilation rates of new domestic vehicles and the re- quired ventilation rates for new vehicles are estimated through the given contaminant data. This study is conducted to compare the ventilation rates for the contaminants between the discontinuously ventilated new vehicles and the conti- nuously ventilated new vehicles using the simulation program. The equation of ventilation rate of new vehicles is acquired to be able to lower initial concentrations below the standard level under different conditions for both business and personal commuting.
Key Words : interior materials, ventilation, IAQx , VOCs, HCHO, contamination of new sedans.
1. INTRODUCTION
*In general, most people spend more than 90 per- cent of times in indoors, houses, offices, under- ground stores, restaurants, cars, subways and so on during daily activities1). The indoor facilities are gra- dually focused on interesting in the convenience of human beings. The public awareness for the protec- tion from exposures to all types of environmental contaminants have been increased with the economic growth and advanced living standards. However, human beings are threatened by the contaminated air
†To whom correspondence should be addressed.
which is emitted by the interior materials in the new vehicles. Recently “New Vehicle Syndrome” are made attention to the people by the mass media, which is caused by exposure to interior materials of new vehi- cles such as, PVC and ABS, artificial leather seats, natural leather covers, safety glasses, synthetic rub- bers, adhesives, and so on2).
Stephen K et al. showed high concentration of pollutants3) in case of new cars. California Environ- mental Protection Agency measured the concentration of indoor pollution level in 1998. The indoor air pollution level of volatile organic compounds(VOCs), such as benzene, toluene and formaldehyde, are ap- peared higher than the outdoor's4).
This study is conducted to review the concen-
trations of VOCs and formaldehyde by the types of vehicle interior materials with using the IAQX(indoor air quality) simulation program5) and curve-fitting.
The characteristics of contaminant and the concen- tration changes of contaminants by the ventilation rates(VR) and the required ventilation rates(RVR) are studied through vehicles driving scenarios.
2. SIMULATION
The value using by ‘Chamber Method’ which is studied in a domestic experiment and the value of EPA-accredited the IAQX simulation program, are compared with each other. The results from two studies are almost significant6). Boundary condition is a constant temperature-humidity(25±1oC, 50±5%) on the seven days with measuring on constant time- period(2, 24, 48, 72, 96, 120, 144, 168hr). Emission concentration is measured for a certain time period.
In this simulation, curve-fitting is used in selecting input coefficients with regard to emissions.
A simulation, where collected materials are app- lied to sedans and SUVs, is conducted to identify emis- sion characteristics of individual contaminants in a closed-window condition. At the same time, a test for estimating concentration changes of contaminants de- pending on the absence or presence of continuous ven- tilation is carried out and a new calculation method for RVR is applied and an approximate equation for RVR is obtained. Using this equation, the ventilation rate(VR) which is required to lower the concentra- tion of contaminant below the standard level is calcu- lated and verified with using the IAQX simulation program. It is observed how the concentration of con- taminant could be changed by simulating discontin- uous air supplies that are done with various VR’s in accordance with different actual driving scenarios. The RVR is calculated with reference to the relationship between the concentration of contaminant and VR’s, using an approximate equation drawn by curve- fitting which is verified through the simulation procedures.
2.1. Simulation Modeling and Results
2.1.1. Calculation of Emission Coefficients by Curve-fitting and Comparison between
Previous Test Values and Simulation Results
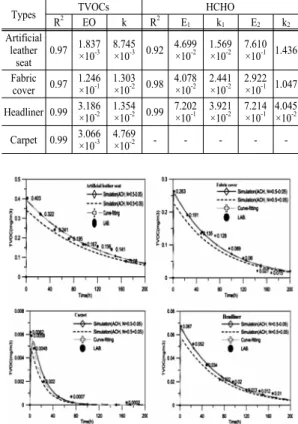
For calculating emission coefficients based on existing data on emission rate for test materials with using the curve-fitting method, the conditioned co- nsistence with the tested values is R2 > 0.9. By using the Win Curve Fit7) program adopting methods such as Newton Method where numerical solutions for non- linear simultaneous equations are programmed, and Quasi-Newton method, values for E and k as emis- sion coefficients in the first-order decay model are drawn as shown in Table 1.
The results of the IAQX simulation program where emission coefficients are obtained by using curve fit- ting, are the emission curve equation from the IAQX simulation program for the small chamber test on the existing test materials, where 0.5 ± 0.05 times/h (up- per limit 0.55 times/h and lower limit 0.45 times/h) representing air changes per unit time, or VR(N, Air Changes per Hour) applied, are shown as Fig. 1. and
Table 1. Emission-related coefficients
Types TVOCs HCHO
R2 EO k R2 E1 k1 E2 k2
Artificial leather
seat 0.97 1.837×10⁻³ 8.745
×10-3 0.92 4.699×10⁻² 1.569
×10-2 7.610
×10-1 1.436 Fabric
cover 0.97 1.246×10⁻¹ 1.303
×10-2 0.98 4.078×10⁻² 2.441
×10-2 2.922
×10-1 1.047 Headliner 0.99 3.186×10⁻² 1.354
×10-2 0.99 7.202×10⁻¹ 3.921
×10-2 7.214
×10-1 4.045
×10-2 Carpet 0.99 3.066×10⁻³
4.769
×10-2 - - - - -
Fig. 1. Comparison with the values between previous test vs.
IAQX models for TVOCs.
Fig. 2. Comparison with the values between previous test vs.
IAQX models for HCHO.
Fig. 2. The purpose of this simulation is to identify if there is consistency between changes of the previous test values and those of the simulation results. With res- pect to the simulation results, the VRs for artificial leather seat, fabric cover, and head liner are within the deviation of 0.5 ± 0.05 times/h, and those for car- pet are slightly out of the deviation. It was suggested that slight difference between the test results and the simulation results should be found.
2.1.2. Estimation of Contaminant Concentra- tions for Sedan Interior Materials in a Closed-window Condition
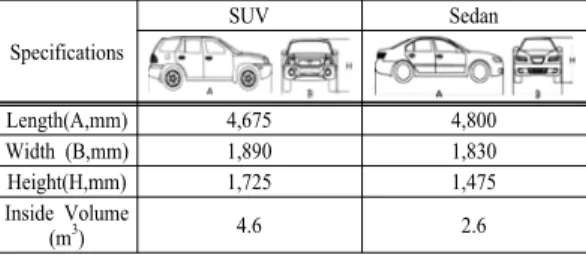
It is made an attempt to measure concentration of contaminants after modeling based on data for domes- tic sedans and SUVs as listed in Table 2.
Standard concentration for TVOCs is set up to be 0.5 mg/m3 according to the MOE's IAQx Manage- ment for Public Facilities Act, while it was 0.25 mg/m3 for HCHO according to MLTM's IAQx Standards for Newly Manufactured Automobiles8-9). (The time taken to lower from the highest concen
Table 2. Specifications of domestic SUV and sedan
Specifications
SUV Sedan
Length(A,mm) 4,675 4,800
Width (B,mm) 1,890 1,830
Height(H,mm) 1,725 1,475
Inside Volume
(m3) 4.6 2.6
Table 3. Estimating peak concentrations of contaminants emitted in sedans in a closed-window condition
Types SUV Sedan
Contaminants TVOCs HCHO TVOCs HCHO standard concen-
tration(mg/m3) 0.5 0.25 0.5 0.25 Interiors LS FS LS FS LS FS LS FS Max. concen-
tration(mg/m3) 43.99 21.85 5.52 3.445 39.43 20.16 5.062 3.255 Sealed hours(hrs) 745 702 586 322 771 599 557 337 Sealed days(days) 31.0 29.3 24.4 13.4 32.1 25.0 23.2 14.0
* LS : Leather seat, FS : Fabric seat
tration to the baseline is assumed to be within 30 minutes with reference to SCANVAC's exposure time standard for TVOC and HCHO.)
The results of the simulation for vehicles in the closed-window condition is shown in Table 3. The emission rates of contaminants in interior materials, such as SUV's artificial fabric and leather seat, are 43.99 mg/m3 at peak concentration for TVOCs, which is 88 times higher than the standard, and 5.52 mg/m3 for HCHO, 22 times higher than the standard, res- pectively. To compare these figures with 64 mg/ m3 (64,000 µg/m3) for TVOCs in 3-week age sedans found in “VOCs in New sedan Interiors” published in Australia3).
2.1.3. Change Estimation of Contaminant Con- centrations by sedan Interior Materials 2.1.3.1. Changes of Contaminant Concen-
trations When Continuously Ventilated for a Certain Period
While the changes of the VRs in Table 4 are shown as Fig. 3 and Fig. 4, the average peak concen- tration of contaminants for both types of sedans are considerably low in comparison with closed-window condition. Even at the ventilation rate of 0.25 times/
h, more than 90% of concentration of contaminants are found to be removed in comparison with a closed condition, regardless of exposed concentrations.
Table 4. VRs and air quantities of SUV and sedan VRs(times/h) Air quantity (㎥/h)
SUV Sedan
0.25 1.15 0.65
0.5 2.30 1.3
0.75 3.45 1.95
1 4.60 2.6
1.25 5.75 3.25
Fig. 3. Emission characteristics of TVOCs, HCHO with con- tinuous ventilation mode for SUVs.
Fig. 4. Emission characteristics of TVOCs, HCHO with conti- nuous ventilation mode for sedans.
2.1.3.2. Determination of RVR Using Appro- ximate Equation and Simulation Verifi- cation Procedure
Since the concentration curve is non-linear in terms of time shown as Fig. 3 and Fig. 4, the appro- ximate equation has to be drawn from curve-fitting using the Win Curve Fit program. The equation is estimated if R2 value is in the range between 0.99 and 1.0 when curve-fitting is conducted. Consequently, the approximate equation is obtained by substituting a relational function approximate equation from F(x)=
ax+b+c/x, which is a general expression for an ap
Table 5. Required ventilation rate of SUV and sedan
Type SUV Sedan
Inside volume
(m3) 4.6 2.6
Contaminants TVOCs HCHO TVOCs HCHO Interiors LS FS LS FS LS FS LS FS Required
ventilation rate
(N, times/h) 0.77 0.53 0.32 0.26 0.70 0.49 0.29 0.23 Required
ventilation
amount (m3/h) 3.6 2.5 1.5 1.2 1.9 1.3 0.8 0.6
proximate equation adopting the Newton method as a numerical solution of the non-linear simultaneous equation. The RVRs are shown in Table 5, which is obtained to apply the actual volume of each type of sedans to be calculated with the chosen approximate equation.
A simulation verification is conducted to obtain RVRs which are shown in Fig. 5 and Fig. 6, where peak concentrations of contaminants of both types are lower than the standard level.
Fig. 5. Simulation verification for TVOCs and HCHO in SUV
Fig. 6. Simulation verification for TVOCs and HCHO in sedan.
2.1.4. Change Estimation of Contaminant Con- centrations In Discontinuous Ventilation mode and Calculation of RVR
2.1.4.1. Change Estimation of Contaminant Con- centrations In Discontinuous Ventilation mode
For business purpose(2-day driving, 1-day rest for
(a) HCHO (b) TVOCs Fig. 7. Emission characteristics of TVOCs and HCHO after parking for 24 hours by ventilation rate
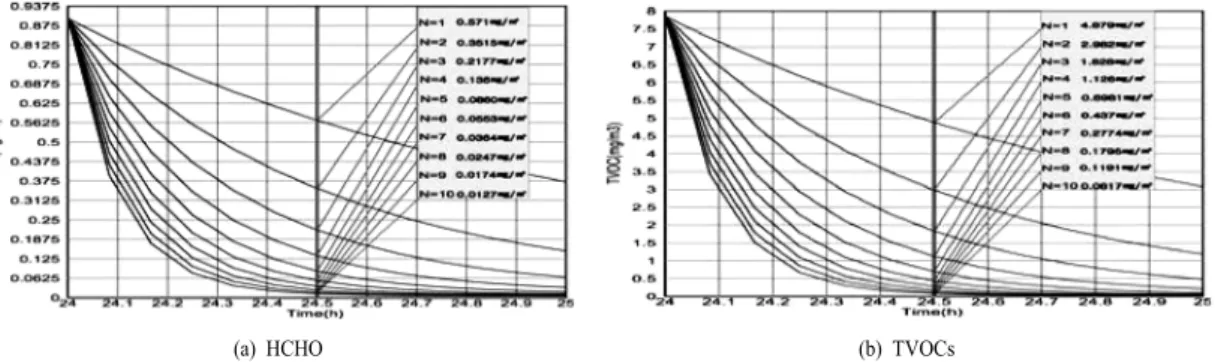
taxi-driving) and the personal commuting purpose(6- day driving, 1-day rest for salaried men) the peak con- centration of contaminants is reached when it is dis- continuously ventilated. The VR was set up to be from 1 time/hour to 10 times/hour for gparking etting an accurate equation. The simulation results for for 24 hours are shown in Fig. 7, with 7.855 mg/m3 as the peak concentration of TVOC in sedans and 0.8976 mg/m3 as that of HCHO.
2.1.4.2. Calculation of RVRs
The used method is the same as that of contin- uous ventilation. For the approximate equation, an equa- tion was derived from F(x)=a* exp(-bx) + c * exp (-dx), the general expression of the Double EXP.
approximate equation, to which the Newton method is applied, as an example shown in Fig. 8.
Fig. 8. Distribution of concentration of TVOCs by VR for sedans.
The equation of the RVR is shown in Table 6 and Table 7, which are acquired by inputting the standard concentration value with reference to the chosen app- roximate equation resulted in the following figures.
Table 6. Calculating RVR(TVOCs) for sedan
Type Sedan
Contaminant TVOCs
Standard concentration 0.5 mg/m3
Actual volume(m3) 2.6
RVR(N, times/h) N = 6.5345(-0.414×0.5)+5.823(-5.91×0.5) = 5.62(times/h),(1≤N≤10) RV air quantity(m3/h) 14.6
Table 7. Calculating RVR(HCHO) for sedan
Type Sedan
Contaminant HCHO
Standard concentration 0.25 mg/m3
Actual volume(m3) 2.6
RVR(N, times/h) N = 6.6534(-3.567×0.25)+6.741(-49.8×0.25)
= 2.73(times/h),(1≤N≤10) RV air quantity(m3/h) 7.1
2.1.4.3. Estimation of Emitted Contaminants by the Sedan Operation Scenario(Ventila- tion Fan On While Driving Only)
The operation scenario of business vehicle(2-day drive, 1-day rest, like taxicabs) for 14 days is shown as Fig. 9. for the operation scenario
The operation scenario of commuting vehicle (6 -day work, 1-day rest) for 14 days is shown as Fig.
10. for the operating day and the rest day, while
Fig. 9. Operation scenario of business vehicle for 14 days.
Fig. 10. Operation scenario of commuting vehicle for 14 days.
the total time taken to commute is assumed to be one hour.
The simulation verification for business vehicles (2-day driving, 1-day rest) is shown as Fig. 11. The peak concentration of TVOCs is 5.029 mg/m3, which is 10 times higher than the standard level and 0.9516 mg/m3 for HCHO with being 3.8 times higher than the standard level, respectively. The simulation veri- fication for commuting vehicles (16-hour driving, 12- hour rest) is shown as Fig. 12. The peak concentra- tion of TVOCs is 3.624 mg/m3, which is 7.2 times higher than the standard level and 0.8433 mg/m3 for HCHO with being 3.4 times higher than the standard level, respectively.
Fig. 11. Emission characteristics of TVOC and HCHO by operation scenario for business vehicles.
Fig. 12. Emission characteristics of TVOC and HCHO by operation scenario for commuting vehicles.
While the determined RVR is calculated, it is taken less than 30 minutes to lower below the stan- dard level for both business and personal commuting shown as Fig. 11. and Fig. 12. The approximate equa- tion to calculate the RVR is considered to be accep- table.
3. CONCLUSION
Recently “New Vehicle Syndrome” which is cau- sed by exposure to interior materials of new vehicles are made attention to the people, so this study is conducted to review the concentrations of VOCs and formaldehyde by the types of vehicles with using the IAQX simulation program and curve-fitting.
The emission rate of interior materials from the simulation of a sedan for closed-window condition are shown 43.99 mg/m3 at peak concentration for TVOCs, which is 88 times higher than the standard, and 5.52 mg/m3 for HCHO, 22 times higher than the standard, respectively.
The contaminants are removed more than 90%, when ventilation rates are continuously changed in the order of 0.25, 0.5, 0.75, 1, and 1.25 times/h, in compari- son with closed-window condition.
The peak concentration of TVOCs is 5.029 mg/m3 (2-day driving, 1-day rest) for business, and 3.624 mg/m3(16-hour driving and 12-hour rest) for commu- ting, respectively. However, it is found that less than 30 minutes are taken to lower below the standard level for both business and commuting.
The peak concentration of TVOCs is 5.029 mg/m3 which is 10 times higher than the standard and 0.9516 mg/m3 for HCHO which is 3.8 times higher than the standard level for business vehicles(14 day driving). The peak concentration of TVOCs is 3.624 mg/m3 which is 7.2 times higher than the standard level and 0.8433 mg/m3 for HCHO which is 3.4 times higher than the standard level for personal commu- ting vehicles(28 hour driving), respectively.
The RVR equation is acquired through the appro- ximate equation and it is taken less than 30 minutes to lower below the standard level for both business and personal commuting.
REFERENCES
1) EPA, “Total Exposure Assessment Methodology (TEAM) Study”, EPA 600/S6-87/002 U.S. 1987.
2) Man-kyu Im, Bong-Jin Kim, Hyo-keun Park, Won- Joon Nam, “Emission, Characteristics of VOCs and HCHO in Car Interior Materials, Using Small Emis- sion Chamber Method”, Korea Environment Enginee- ring Association's Spring Academy Conference, p.
51, 2007.
3) Stephen K. Brown and Min Cheng, “VOLATILE ORGANIC COMPOUNDS(VOCs) IN NEW CAR INTERIORS”, 15th International Clean Air & Envi- ronment Conference, Nov 26-30, 2000.
4) California Environmental Protection Agency, “Measu- ring Concentrations of Selected Air Pollutants Inside California Vehicles”, Contract No, 95-339 FINAL REPORT DECEMBER 1998.
5) United States Environmental Protection Agency (EPA),
“Simulation Tool Kit for Indoor Air Quality and Inhalation Exposure (IAQX) Version 1.0 User’ Guide”, EPA-600/R-00-094,October 2000.
6) Man-Kyu Im, “Emission Characteristics of VOCs and HCHO in Car Interior Materials Using Small Emis- sion Chamber Method”, Paper for Master Degree, Suwon University, Feb. 2007.
7) Australia Kevin Raner Software, WinCurveFit ver- sion 1.1, February. 2001.
8) Ministry of Environment, IAQ Management for Pub- lic Facilities Act, March 2006.
9) Ministry of Construction and Transportation, IAQ Stan- dards for Newly Manufactured Automobiles, June 2007.