DOI 10.17480/psk.2017.61.3.164
Comparison of Laboratory Values and Adverse Effects between Cyclosporine- and Tacrolimus-based Regimens in Renal Transplant Patients:
12-month Follow-up Results at a Tertiary Teaching Hospital
Hae Jeong Kim*
,**, Young-Mo Yang***, In Choe**, and Eun Joo Choi*
,***
,#*Department of Clinical Pharmacy, Graduate School of Clinical Pharmacy, Chosun University, Gwangju, Korea
**Department of Pharmacy, Chosun University Hospital, Gwangju, Korea
***Department of Pharmacy, College of Pharmacy, Chosun University, Gwangju, Korea (Received March 9, 2017; Revised April 21, 2017; Accepted May 10, 2017)
Abstract — Multidrug combination of immunosuppressive agents has been used to achieve an optimal immunosuppression and prevent adverse effects (AEs) of immunosuppressant in kidney transplant patients. Cyclosporine (CsA) and tacrolimus (TAC) are mostly used immunosuppressive drugs out of preferred immunosuppressive regimens for the prevention of rejec- tion after kidney transplantation. Due to variable pharmacokinetic profiles and frequent AEs with immunosuppressants such as CsA, TAC, and mycophenolate mofetil (MMF), the studies related to therapeutic drug monitoring (TDM) of immu- nosuppressive regimen have continuously been researched. The aims of this study were to analyze monitoring and AEs on IMRs in renal transplant patients. The study was conducted at the teaching hospital in Gwangju, Korea. Medical charts of 58 renal transplant patients selected based on inclusion criteria between January 2002 and July 2013 were reviewed ret- rospectively. Among total 58 patients, 38 were included in the analysis. They were divided into two groups:
CsA + MMF + steroid group (CsA group, n=28) and TAC + MMF + steroid (TAC group, n=10) group. As a result, the tri- glyceride level of the CsA group was significantly increased compared with that of the TAC group at 3, 9 and 12 months (p=0.008, p=0.007, p=0.033, respectively). The dyslipidemia complications of CsA group were higher than that of TAC group at 3, 6, and 12 month after transplantation (p=0,044, p=0.043, p=0.048, respectively). The AST level of CsA group was significantly increased compared with that of the TAC group at 3 month (p=0.002). This study also showed that a TAC- based regimen tended to increase a blood glucose level during 12 months. This study determined that patients with a CsA- based regimen should be closely monitored regarding lipid profiles and liver function tests, and those with a TAC-based reg- imen should be cautiously monitored about blood glucose levels to prevent complications by AEs during immunosup- pressive therapy.
Keywords Immunosuppressive Agents, Monitoring Factors, Adverse Effects, Kidney Transplantation
Kidney transplant is one of the most effective methods of renal replacement therapy (RRT) for end-stage renal failure (ESRF) patients, and compared to dialysis, it offers better physical and emotional comfort and better quality of life.
1)According to the study on the survival rate of different RRTs with Korean ESRF patients, compared to hemodialysis and peritoneal dialysis, kidney transplants showed a higher sur-
vival rate with the use of immunosuppressive drugs playing a major role in reducing kidney transplant rejection (KTR).
2)The combination of immunosuppressive drugs after trans- plantation is critical to manage kidney transplant patients since low doses lead to KTR and high doses cause various side effects.
3)According to the kidney disease improving global out- comes (KDIGO) clinical practice guideline for the care of kid- ney transplant recipients, the immunosuppressive multidrug regimen (IMR) including calcineurin inhibitors, anti-prolifera- tive agents, and steroids is recommended after transplanta- tion.
4)Of calcineurin inhibitors, CsA or TAC is recommended with mycophenolate being used as a primary immunosuppres- sant and sirolimus, a mammalian target of rapamycin (mTOR)
#
Corresponding Author Eun Joo Choi
Department of Pharmacy, College of Pharmacy, Chosun Univer- sity, 309 Pilmun-daero, Dong-gu, Gwangju 61452, Korea
Tel.: 062-230-6382 Fax.: 062-222-5414 E-mail: [email protected]
Short Report
종설inhibitor, being used after the kidney function has stabilized.
4)Compared to using a single high-dose immunosuppressant (e.g., calcineurin inhibitor) after transplantation, the IMR can prevent KTR as well as lower the doses of immunosuppres- sive drugs including steroids.
5-7)According to the studies by Hwang et al. and Cho et al., the groups with CsA + mycophenolate and TAC + mycophenolate showed a significantly lower prevalence of KTR and lower maintenance doses of steroids.
8,9)Lee et al.
reported that the group with CsA + Myfortil® (mycophenolic acid) had higher 5- and 10-year survival rates than that with TAC + CellCept® (MMF), and the blood concentration of Myfortil® also remained high.
10)The IMR effectively reduces KTR but increases the effects of the drugs thereby causing AEs such as hypertension, hyper- lipidemia, diabetes, and renal or hepatic toxicity.
11,12)Accord- ing to the study by Pirsch et al., hyperlipidemia, hirsutism, gingivitis and gum hyperplasia occurred frequently in the patients with CsA whereas tremor, paresthesia, and post-trans- plant diabetes in the patients with TAC.
13)In the six-month observational study with kidney transplant patients, blood pressure, total cholesterol (TC), low density lipoprotein (LDL) cholesterol, and triglyceride (TG) levels had kept higher for 6 months in patients with CsA than with TAC.
14)To date, some studies regarding a single-drug regimen of a calcineurin inhibitor or mycophenolate have been performed with Korean transplant patients
8,9,15); however, studies regard- ing monitoring and AEs of IMRs have been rarely imple- mented in Korea.
Eexperimental Methods
This study was retrospectively conducted with kidney trans- plant patients who received IMRs between January 2002 and June 2013 in Chosun University Hospital, Gwangju, Korea. Ethi- cal approval for this study was received from the Chosun Uni- versity Hospital Institutional Review Board (2013-10-007-001).
The following patients were excluded from the study:
patients who were younger than 18 years old, had received renal transplants within 12 months, had changed immunosup- pressants during the treatment, or did not have monitoring parameter data. The patients were divided into two groups based on the frequency of immunosuppressant drug prescription: cyclo- sporine (CsA) + mycophenolate mofetil (MMF) + steroid group (CsA group) and tacrolimus (TAC) + MMF + steroid group (TAC
group).
Data were obtained by reviewing patients’ medical charts for 12 months from the day of renal transplant. The following data were collected: demographic characteristics (e.g., age, gender, height, weight, BMI), comorbid conditions, systolic and dia- stolic blood pressure measurements, blood urea nitrogen (BUN) and serum creatinine (SCr) levels as kidney function predictors, TC and TG levels as hyperlipidemic predictors, aspartate amino- transferase (AST) and alanine aminotransferase (ALT) levels as liver function predictors, and others (e.g., blood glucose (BG), white blood cell (WBC), hemoglobin (Hb)).
The following criteria were used to determine whether adverse effects had occurred in kidney transplant patients.
Hypertension was defined as systolic blood pressure (SBP) ≥ 140 mmHg or diastolic blood pressure (DBP) ≥ 90 mmHg in the resting state or taking anti-hypertensive drugs, hypergly- cemia as taking insulin or oral anti-hyperglycemic drugs in patients who had not been diagnosed with diabetes mellitus before transplantation and hyperlipidemia as TC ≥ 200 mg/dL or taking anti-hyperlipidemic drugs.
4)Renal impairment was defined as SCr ≥ 2.0 mg/dL, and hepatic impairment as AST or ALT ≥ 40 IU/L.
4)SPSS 21.0 for Windows (Chicago, IL, USA) was utilized for statistical analysis. Continuous variables were presented as mean ±SD, and categorical variables as frequency (%). Chi- square test or Fisher’s exact test was used to determine sig- nificant differences in proportions between CsA and TAC groups, and independent T-test or repeated measure ANOVA to measure significant differences in means between the groups. Statistical significance was assumed for p < 0.05.
Results
Among total 58 patients, 38 patients who met inclusion and exclusion criteria were included in the analysis. Twenty-eight patients belonged to CsA group, and 10 patients to TAC group.
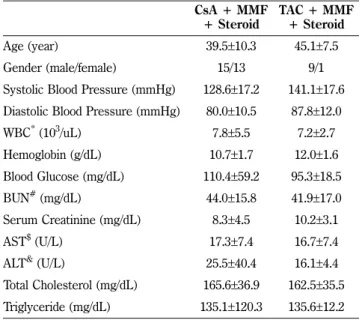
The mean age ( ±SD) of CsA group was 39.5 (±10.3) years old, and that of TAC group was 45.1 ( ±7.5) years old. Fifteen were male in CsA group, and 9 male in TAC group. The mean hemoglobin levels were 10.7 ±1.7 g/dL in CsA group and 12.0 ±1.6 g/dL in TAC group. Other demographic and clinical characteristics were described in Table I.
The results from analyzing patients’ underlying diseases and
types of renal transplants were reported in Table II. Hyperten-
sive nephropathy (n=13, 46.4%) and chronic glomerulonephri- tis (n=13, 46.4%) were the most common diseases in CsA group, and hypertensive nephropathy (n=7, 70.0%) in TAC
group. Twenty-five patients (89.2%) in CsA group received kid- neys from other persons whereas 10 patients (100.0%) in TAC group from brain-dead persons.
As shown in Table III, the change in SBP over time was sta- tistically significant between two groups (p=0.031). However, there was no significant difference in DBP over time between two groups (p=0.159). The decreases in SBP (p=0.008) and DBP (p=0.038) of TAC group were statistically significant during 12 months, but those of CsA group were not decreased with statistical significance over 12 months. The SBP and DBP of CsA group had been relatively increased for 7 days after transplantation compared with baselines measured before transplantation; however, those of TAC group had been rela- tively decreased compared with baselines.
As described in Table IV, the changes in Hb (p<0.001) and BG (p=0.002) levels over 12 months were statistically signifi- cant between two groups whereas that in WBC (p=0.116) level over 12 months was not. The WBC and BG levels of both groups had been relatively increased for 7 days after transplantation compared to baselines, but the Hb levels of both groups had been relatively decreased compared with baselines.
The changes in BUN and SCr levels were presented in Table V. The levels of BUN (p<0.001) and SCr (p<0.001) over 12 months after transplantation had been changed with statisti- cally significant difference between two groups. The BUN lev- els of both groups had been decreased for the first 3 months after transplantation, but those of both groups remained rela- tively constant after 3 months. The SCr levels of both groups had been rapidly decreased for the first 7 days after transplan- tation, but after 7 days, those of both groups kept relatively constant.
As shown in Table VI, there were no statistical significant changes in the AST and ALT levels over 12 months between two groups. The AST and ALT levels of CsA group had remained relatively constant for 12 months. However, those of Table I − Demographic and clinical characteristics of patients
CsA + MMF
+ Steroid TAC + MMF + Steroid
Age (year) 39.5±10.3 45.1±7.5
Gender (male/female) 15/13 9/1
Systolic Blood Pressure (mmHg) 128.6±17.2 141.1±17.6 Diastolic Blood Pressure (mmHg) 80.0±10.5 87.8±12.0
WBC
*(10
3/uL) 7.8±5.5 7.2±2.7
Hemoglobin (g/dL) 10.7 ±1.7 12.0 ±1.6
Blood Glucose (mg/dL) 110.4±59.2 95.3±18.5
BUN
#(mg/dL) 44.0±15.8 41.9±17.0
Serum Creatinine (mg/dL) 8.3±4.5 10.2±3.1
AST
$(U/L) 17.3±7.4 16.7±7.4
ALT
&(U/L) 25.5±40.4 16.1±4.4
Total Cholesterol (mg/dL) 165.6±36.9 162.5±35.5 Triglyceride (mg/dL) 135.1±120.3 135.6±12.2
*
WBC, white blood cell
#
BUN, blood urea nitrogen
$
AST, aspartate aminotransferase
&
ALT, alanine aminotransferase
Table II − The summary of patients’ underlying diseases and types of renal transplants
CsA + MMF + Steroid
(n=28)
TAC + MMF + Steroid
(n=10) Underlying Disease, n (%)
Diabetic nephropathy 1 (3.6) 1 (10.0) Hypertensive nephropathy 13 (46.4) 7 (70.0) Chronic glomerulonephritis 13 (46.4) 2 (20.0) Obstructive Kidney Disease 0 (0.0) 0 (0.0)
Unexplained disease 1 (3.6) 0 (0.0)
Type of renal Transplant, n (%)
Kidney from another person 25 (89.2) 0 (0.0) Kidney from a brain-dead person 3 (10.8) 10 (100.0)
Table III − The comparison of blood pressure measurements in renal transplant patients
Group Baseline 7 days 3 months 6 months 9 months 12 months p-value
SBP
*(mmHg) CsA 128.6±17.2 132.5±12.9 129.5±11.2 126.4±11.3 131.6±12.4 127.1±10.3 0.280
0.031 TAC 141.1 ±17.6 127.6 ±11.6 121.9 ±9.4 124.2 ±10.2 126.7 ±7.5 122.6 ±9.4 0.008
DBP
#(mmHg) CsA 80.0±10.5 83.5±9.7 81.6±9.0 79.1±7.8 80.6±8.9 77.8±8.2 0.125
0.159
TAC 87.8±12.0 80.1±5.3 79.7±6.6 79.4±6.4 80.0±4.6 80.0±5.8 0.038
*
SBP, systolic blood pressure
#
DBP, diastolic blood pressure
TAC group had been rapidly increased for the first 7 days after transplantation and had been gradually decreased for about 3 months. Especially, the AST level (20.9 ±5.9 U/L) of CsA group was significantly higher than that (13.1 ±2.76 U/L) of TAC
group 3 months after transplantation (p=0.002).
The change of dyslipidemia in kidney transplant patients was presented in Table VII. There was statistically significant dif- ference in the change of TC level between two groups over 12 Table IV − The comparison of white blood cell, hemoglobin, and blood glucose levels in renal transplant patients
Group Baseline 7 days 3 months 6 months 9 months 12 months p-value
WBC
*(10
3/uL) CsA 7.8±5.5 9.6±3.8 7.4±2.7 7.5±2.1 7.9±1.5 7.8±2.3 0.305
0.116 TAC 7.2 ±2.7 8.4 ±2.7 6.5 ±1.9 6.5 ±1.8 6.8 ±2.7 7.4 ±2.7 0.109
Hb
#(g/dL) CsA 10.7±1.7 9.9±1.0 11.9±1.4 13.0±2.2 12.6±2.7 13.0±1.9 0.000
<0.001 TAC 12.0±1.6 9.8±0.6 11.4±1.4 12.2±3.5 13.4±1.6 13.7±1.5 0.036
BG
$(mg/dL) CsA 110.4±59.2 135.4±69.1 111.1±28.2 99.3±35.0 101.9±20.5 99.4±16.8 0.036
0.002 TAC 95.3 ±18.5 149.3 ±24.6 117.3 ±22.1 109.7 ±18.6 105.1 ±24.8 105.8 ±14.1 0.000
*
WBC, white blood cell
#
Hb, hemoglobin
$
BG, blood glucose
Table V − The comparison of renal functions in renal transplant patients
Group Baseline 7 days 3 months 6 months 9 months 12 months p-value
BUN
*(mg/dL) CsA 44.0 ±15.8 26.5 ±15.9 22.6 ±8.9 19.8 ±5.9 20.8 ±6.8 20.2 ±6.6 <0.001
<0.001 TAC 41.9±17.0 37.0±24.1 20.9±8.3 19.6± 5.9 17.9±3.4 20.2±6.4 0.005
SCr
#(mg/dL) CsA 8.3±4.5 1.6±1.2 1.4±0.3 1.4±0.4 1.3±0.3 1.4±0.3 <0.001
<0.001
TAC 10.2±3.1 2.2±1.3 1.4±0.3 1.4±0.3 1.4±0.3 1.3±0.3 <0.001
*
BUN, blood urea nitrogen
#
SCr, serum creatinine
Table VI − The comparison of liver functions in renal transplant patients
Group Baseline 7 days 3 months 6 months 9 months 12 months p-value
AST
*(U/L) CsA 17.3±7.4 21.3±7.2 20.9±5.9 19.9±4.3 19.9±6.7 23.6±20.9 0.297
0.150
TAC 16.7±7.4 24.8±15.4 13.1±2.7 17.5±6.1 16.3±3.9 17.9±6.8 0.204
p-value 0.550 0.726 0.002 0.205 0.094 0.488
ALT
#(U/L) CsA 25.5 ±40.4 26.0 ±17.9 25.6 ±18.7 19.4 ±7.8 20.6 ±14.0 28.3 ±35.1 0.678
0.400 TAC 16.1±4.4 34.9±33.2 13.0±5.9 23.3±17.2 15.7±5.3 16.9±5.2 0.158
p-value 0.517 0.815 0.098 0.281 0.328 0.414
*
AST, aspartate aminotransferase
#
ALT, alanine aminotransferase
Table VII − The comparison of dyslipidemia in renal transplant patients
Group Baseline 7 days 3 months 6 months 9 months 12 months p-value
TC
*(mg/dL) CsA 165.6±36.9 173.7±41.1 199.4±41.3 187.7±33.2 187.7±33.2 195.9±42.1 0.000
0.001 TAC 162.0±35.5 184.6±34.6 199.3±53.7 187.8±34.9 184.8±32.1 178.9±35.1 0.119
p-value 0.920 0.438 0.749 0.829 0.645 0.310
TG
#(mg/dL) CsA 135.1±120.3 157.8±100.1 201.7±86.5 149.9±89.5 165.2±94.4 186.6±128.6 0.055
0.403 TAC 135.6 ±112.2 125.3 ±35.9 138.2 ±39.7 134.4 ±55.3 116.8 ±29.9 120.7 ±36.1 0.592
p-value 0.957 0.092 0.008 0.268 0.007 0.033
*
TC, total cholesterol
#
TG, triglyceride
months after transplantation (p=0.001). In particular, the TG levels of CsA group were significantly higher than those of TAC group after 3 months (201.7 ±86.8 mg/dL vs. 138.2±39.7 mg/dL, p=0.008), 9 months (165.2 ±94.4 mg/dL vs. 116.8±29.9 mg/dL, p=0.007), and 12 months (186.6 ±128.6 mg/dL vs. 120.7±36.1 mg/
dL, p=0.033).
The incidence rates of adverse effects in CsA and TAC groups were compared (Table VIII). The incidence rate of hyperglycemia over 12 months after transplantation was higher in TAC group than in CsA group. However, the opposite result was obtained in case of dyslipidemia. Especially, the incidence rates of dyslipidemia in CsA group were significantly higher than those of dyslipidemia in TAC group after 3 months (67.9% vs. 30.0%, p=0.044), 6 months (46.4% vs. 10.0%, p=0.043), and 12 months (60.7% vs. 30.0%, p=0.048).
Discussion
The appropriate use of immunosuppressive drugs in kidney transplant patients plays an important role in reducing the transplant rejection rate in the transplanted kidney and improving the survival rate of the patient.
2)It has been reported that CsA and TAC commonly used after transplanta- tion increase the risks for hypertension, hyperlipidemia, and cardiovascular diseases.
13)In particular, even small changes in clinical parameters, such as BP, BG and cholesterol levels, may negatively affect recovery following kidney transplantation in patients who have already underlying diseases. Therefore, this study has significance in that clinical parameters were fol- lowed up until 12 months after administering CsA and TAC.
In this study, the kidney transplant patients with IMRs were divided into CsA group and TAC group, and their monitoring
data and AEs had been retrospectively followed up for 12 months. The average age of TAC group (45.1 years) was higher than that of CsA group (39.5 years), which seems to be due to the fact that although kidney transplants were not con- sidered for patients over 50 years old in the past, there is no set age limit these days unless the patients have comorbid dis- eases, thereby leading to older patients undergoing kidney transplants. Additionally, as TAC is often used as the initial immunosuppressive drug, the average age of the TAC group seems to have gone up.
According to this study, during 7 days after transplantation, SBP and DBP had increased from the baseline in CsA group, but they had decreased from the baseline in TAC group. The analysis of SBP and DBP over 12 months showed that CsA group patients had consistently higher levels than TAC group patients. The prevalence rate for AEs of BP increase was also higher in CsA group. Such results are in line with preceding studies. Xue et al. reported that compared with TAC treat- ment, CsA treatment was related with a higher incidence rate of hypertension after transplantation with no significant differ- ence between two treatments (p=0.06).
16)Chapman et al.
showed that BP decreased significantly when the immunosup- pressant was converted from CsA to azathioprine.
17)Accord- ing to the study by Kremer et al., CsA and TAC increased BP, but the proportion of patients with anti-hypertensive drugs was 81.1% for CsA group and 73.6% for TAC group (p=0.058).
18)Therefore, in case that CsA-based immunosuppressive drugs are used, kidney transplant patients’ BPs and treatments should be thoroughly managed early on post-transplant.
Post-renal transplant diabetes can be the causes for loss of function in the transplanted kidney, cardiovascular diseases, microvascular complications and infections.
19)The BG levels in Table VIII − The frequency of adverse effects on IMRs in renal transplant patients
Group 7 days 3 months 6 months 9 months 12 months p-value
Increase in BP
*, n (%) CsA 4 (14.3) 4 (14.3) 1 (3.6) 2 (7.1) 5 (17.9) 0.150
TAC 0 (0.0) 1 (10.0) 0 (0.0) 1 (10.0) 0 (0.0) 0.558
Hyperglycemia, n (%) CsA 8 (28.6) 5 (17.9) 2 (7.1) 3 (10.7) 2 (7.1) 0.062
TAC 5 (50.0) 3 (30.0) 2 (20.0) 2 (20.0) 2 (20.0) 0.051
Dyslipidemia, n (%) CsA 2 (7.1) 19 (67.9) 13 (46.4) 15 (53.6) 17 (60.7) 0.000
TAC 1 (10.0) 3 (30.0) 1 (10.0) 3 (30.0) 3 (30.0) 0.545
Hepatic impairment, n (%) CsA 1 (3.6) 4 (14.3) 0 (0.0) 3 (10.7) 4 (14.3) 0.224
TAC 0 (0.0) 0 (0.0) 1 (10.0) 0 (0.0) 0 (0.0) 0.255
*