Print ISSN: 2288-4637 / Online ISSN 2288-4645 doi:10.13106/jafeb.2020.vol7.no5.073
1
First Author and Corresponding Author. Graduate School, Ho Chi Minh City Open University, Vietnam [Postal Address: No. 97, Vo Van Tan Street, Ward 6, District 3, Ho Chi Minh City, 724000, Vietnam] Email: [email protected]
© Copyright: The Author(s)
This is an Open Access article distributed under the terms of the Creative Commons Attribution Non-Commercial License (http://Creativecommons.org/licenses/by-nc/4.0/) which permits unrestricted noncommercial use, distribution, and reproduction in any medium, provided the original work is properly cited.
Effects of Foreign Direct Investment and Quality of Informal Institution on the Size of the Shadow Economy: Application to Vietnam
Bui Hoang NGOC
1Received: February 21, 2020 Revised: March 01, 2020 Accepted: March 31, 2020
Abstract
Tax is the main revenue of Government, so fighting tax evasion and sustainable growth have been the primary macroeconomic goals being pursued by every developing country, Vietnam included. The existence and development of the shadow economic sector are synonymous with the national budget losing out. In Vietnam, foreign direct investment projects do not promote economic growth and is also a sector that gives way to tax evasion.The purpose of this study is to investigate the impact of foreign direct investment, the quality of the informal institution on the size of the shadow economy in Vietnam, during the period 1991-2015. By applying the Autoregressive Distributed Lag approach and Toda and Yamamoto test, we found evidence to conclude that the quality of the informal institution harms the size of the shadow economy. The results of the causality test show that there is a unidirectional causality running from the shadow economy and the quality of the informal institution to foreign direct investment attraction in Vietnam. Political solutions need to be implemented carefully to counter the harmful effects of the shadow economy. Policymakers should adopt several economic policies to improve the ‘human capital’
and drive the shadow economy into the formal economy.
Keyword: Shadow Economy, Quality of Institution, ARDL, Vietnam JEL Classification Code: O31, O32, D78, Q47, Q53.
1. Introduction
The quality of the institution plays an essential role in development and economic growth (North, 1990). The difference in the institutional quality is the fundamental cause of economic growth, to form the developed, developing, and less-developed countries in the long-run (Acemoglu
& Robinson, 2010). Compared to developed countries, the quality of institutions in developing countries has many defects and limitations. It is the cause of the shadow economy sector in developing countries that have always existed. The development of the shadow economy indicates that the formal economy was improving slowly, and the national budget lose out. Besides, it distorts the allocation of
resources, alters income distribution, and reduces revenues through the Government’s tax (Alm & Embaye, 2013). If we ignore this sector, to evaluate the consequences of various economic policies is a futile exercise. The IMF report shows that the size of the Vietnamese shadow economy sector is still equal to 11.18% of the GDP in 2015.
The relationship between institutional quality, foreign direct investment and the size of the shadow economy sector is an attractive topic (Larrain & Tavares, 2004; Kwok
& Tadesse, 2006; Dang, 2013; Dreher & Schneider, 2010;
Razmi, Falahi, & Montazeri, 2013), but there is a dearth
of studies in Vietnam. According to North (1990), the
institution is divided into two types: (1) the formal institution
(representing the Government effectiveness, regulatory
quality, the rule of law, and control of corruption), and (2)
the informal institution (culture, religion, the consciousness
of ethics, ‘human capital’ per person). Previous studies often
emphasize the role of formal institution quality to reduce the
shadow economy. However, Johnson, Kaufmann, and Zoido-
Lobaton (1998) suggest that the restrictions of the shadow
economy by the formal institution will not be valid. The weak
skill worker must usually participate in the shadow economy
sector due to the fact that the opportunity to participate in
the formal economy is rstricted . Even if the skill/education of workers is improved, there is still the likelihood that they enter the shadow economy due to fast and straightforward procedures (Schneider, 2012). The purpose of this study is to investigate the effects of FDI and the informal institution quality (measured by the index of the ‘human capital’ per person) on the size of the shadow economy in Vietnam.
Because of the curtailment of the shadow economy by the formal institution as well as the informal institution is the right choice and effectiveness in the long run (Acemoglu &
Robinson, 2013).
2. Theoretical Background and Literature Review
The ‘shadow economy’ labeled by Frey, Weck, and Pommerehne (1982) and Schneider and Dominik (2000) is an associated part of the official economy. It is also known as the irregular economy (Ferman & Ferman, 1973; Feige, 1979), the parallel economy (Contini, 1981), the black economy (Dilnot & Morris, 1981), the underground economy (Simon & Witte, 1982; Feige, 1989), the informal economy (Smith, 1985), and the unofficial economy (Johnson et al., 1998). There is not an adequate and coherent definition of the shadow economy in the literature. Smith (1985) defines the shadow economy as “market-based production of goods and services, whether legal or illegal, that escapes detection in the official estimates of gross domestic products (GDP)”. In other words, the shadow economy includes those economic activities and incomes derived from them that avoid Government regulations, taxation, or observation (Feige, 1989; Dell’Anno & Schneider, 2003). Dell’Anno (2007) regards the shadow economy as a “non-observed economy” which comprises all product activities that can be categorized into three areas: underground production, informal production, and illegal production.
Despite adopting inconsistent definitions of the shadow economy, researchers have generally concurred on a typical aspect of the shadow economy: the area covering economic activities that are not recorded in the national accounts.
Schneider (2010) defines the shadow economy to include all production activities of goods and services based on market, but deliberately hidden from public authorities for avoiding income payment, tax payment, payment for social security contributions; they also avoid “having to meet legal labor market standards”, such as maximum working hours, minimum wages, safety standards, etc.; they avoid as well
“complying with certain administrative procedures” such as completing administrative forms or statistical questionnaires.
According to Hirschman (1970), the proliferation of shadow economic activities is considered the response of people to the overload of the tax burden, social security, and
the lack of flexibility of the institution. Instead of voicing their demand for changes to Government and policymakers, people have often chosen a ‘safer’ way to participate in the shadow economy. It implies that the size of the shadow economy is one of the measurement criteria. It reflects the national institution’s quality. Empirical studies show that there are six leading causes to the existence and development of the shadow economic activities: (1) Burdens of taxes and social security contributions (Loayza, 1997; Torgler & Schneider, 2009; Schneider, 2010); (2) Intensity of Regulations (Loayza, 1997; Johnson et al. 1998; Friedman, Johnson, Kaufmann,
& Zoido-Labton, 2000; Schneider, Buehn, & Montenegro, 2010); (3) Corruption (Hindriks, Muthoo, & Keen, 1999;
Dreher & Schneider, 2010); (4) Changes from the labor market (Boeri & Garibaldi, 2002; Dell‘Anno, 2007); (5) Institutional quality/public sector services (Johnson et al., 1998; Friedman et al., 2000; Fugazza & Jacques, 2003; Torgler & Schneider, 2009; Dreher, Kotsogiannis, & McCorriston, 2009; Dreher &
Schneider, 2010; Razmi et al., 2013); and (6) Development of the formal economy (La Porta & Shleifer, 2014; Williams, 2008; Elgin & Oztunali, 2014).
2.1. The Effect of Institutional Quality on the Shadow Economy
According to Tanzi (1982), Schneider (1997), and Maloney (2004), the existence of the shadow economic activities is the result of low institutional quality. Most of the studies conclude that there is a negative effect of institutional quality on the shadow economy. For example, based on data collected from OECD, Latin America, and transition countries, Johnson et al.
(1998) reveal that more corruption and the weak rule of law are causes for a broader shadow economy. The lax regulations without adequate supervision will encourage corruption, leading to more enterprises operating in the shadow economy.
Similarly, Friedman et al. (2000), and Torgler and Schneider (2009) also find that improving institutional quality (especially the security of property rights) and higher tax morale can lessen the incentive to ‘go underground’ and reduce the size of the shadow economy. A higher institution quality leads to a smaller shadow economy and reduces corruption (Dreher et al., 2009). For their part, Fugazza and Jacques (2003) conclude that labor market regulations and tax burden are the reasons for informal economic activities. They support the view that policies should aim at promoting the individual benefits of participating in the formal sector rather than conducting a deterrence policy, because the intervention of Government to labor market will affect both the formal economy and the shadow economy.
Elgin and Oztunali (2014) found that institutional quality
drastically interacts with the relationship between economic
growth and the shadow economy for 141 countries over the
period from 1984 to 2009. Notably, a higher level of GDP per capita is related to a larger shadow economy size in the case of low institutional quality, and a smaller shadow economy size in the case of high institutional quality. This result emphasized the critical role of institutional quality in determining whether the shadow economy and the formal economy are substitutes or complement. Furthermore, without the improvement in institutional quality, the growth of the formal economy can reduce the shadow economy, and vice versa
2.2. The Relationship between FDI and the Shad- ow Economy
Hypothetically, FDI can help reduce the size of shadow economies through three channels. First, FDI helps improve institutional quality (Larrain & Tavares, 2004; Kwok &
Tadesse, 2006; Dang, 2013; Long, Ngoc, & My, 2018), and better institutional quality, in turn, reduces shadow economy (Johnson et al., 1998; Friedman et al., 2000; Fugazza &
Jacques, 2003; Torgler & Schneider, 2009; Dreher et al., 2009; Dreher & Schneider, 2010; Razmi et al., 2013).
Second, FDI has a positive effect on the growth of the formal economy (Romer, 1994; Choe, 2003; Li & Liu, 2005; Long et al., 2018; Mustafa, 2019; Nantharath & Kang, 2019), so that it reduces the size of the shadow economy (La Porta
& Shleifer, 2014; Williams, 2008). Third, FDI creates employment (Lall, 1995; Blomström, Fors, & Lipsey, 1997), raises wages (Heyman, Sjholm, & Tingvall, 2007), and improves labor productivity (Le, Duy, & Ngoc, 2019), thus reducing the size of the shadow economy (Boeri & Garibaldi, 2002; Dell’Anno & Solomon, 2008).
Nikopour, Habibullah, Schneider, and Law (2009) used the data of 145 countries from 2000-2005; by applying the Generalized Method of Moments (GMM) approach, they conclude that there is bi-directional causality between FDI and the shadow economy. Accordingly, the increase in FDI will boost the shadow economic activities, and the size of the shadow economy sector increased to attract better FDI. Similarly, Ali and Bohara (2017) confirm that a higher shadow economy increases FDI inflows since multi- enterprises take advantage of tax evasion in host countries with the larger size of the shadow economy. However, Davidescu and Strat (2015) find a negative impact of FDI on the shadow economy in the short run in the case of Romania.
3. Data and Methodology 3.1. Research Model
In literature, shadow economic activity also created material wealth for society, but for various reasons are not counted in formal GDP. The size of the shadow economy
sector is calculated based on formal GDP. This study is based on the previous research of Dell’Anno and Schneider (2003), Nikopour et al. (2009), to determine the relationship between foreign direct investment, informal institutional quality and the size of the shadow economy sector in Vietna. we suggest the following research model:
0 1
. ( D )
2.
t t t t
SE = β + β Ln F I + β HC u + (Eq.1) The annual data are collected from 1991 to 2015. Where the ‘SE’ variable is the percentage of the shadow economy as compared to GDP (source: IMF). ‘LnFDI’ variable is the logarithm of total FDI (source: UNCTAD) and the ‘HC’
variable is the informal institution quality (measured by the index of human capital per person) (source: FRED).
3.2. Method
According to Nelson and Plosser (1982), Omri, Nguyen, and Rault (2014), GDP or FDI is a persistent time series data. It implies that there is a relationship between the current GDP/FDI with the previous GDP/FDI. To solve this problem, we employed the Autoregressive Distributed Lags (ARDL) approach proposed by Pesaran, Shin, and Smith (2001). Eq.1 are illustrated in the following ARDL model:
0 1 1 2 1 3 1
1 2 3
4 5 6
1 0 0
. . D .
. . D .
t t t t
m m m
i t i i t i i t i t
i i i
SE SE LnF I HC
SE LnF I HC
β β β β
β β β µ
− − −
− − −
= = =
∆ = + + +
+ ∑ ∆ + ∑ ∆ + ∑ ∆ +
(Eq.2) Note: Δ denotes the first difference
β
1, β
2, β
3are regression coefficients that present long-term effects
β
4, β
5, β
6are regression coefficients that present short-term effects
μ
tis error
According to Pesaran et al. (2001), the variables in the ARDL model must satisfy two conditions: (1) The variables are stationary; (2) There is cointegration among variables.
If there is a cointegration relationship in the long-run, Eq.2 was estimated based on the Error Correction Model (ECM), as follows:
0 1
1 2 3
1 2 3
1 0 0
.
. . D .
t t
m m m
i t i i t i i t i t
i i i
SE ECM
SE LnF I HC
β α
λ λ λ τ
−
− − −
= = =
∆ = +
+ ∑ ∆ + ∑ ∆ + ∑ +
(Eq.3)
Where: m
1, m
2, m
3is the lag of each variable is calculated according to AIC, SC, HQ critical information value, and R-square. To determine the causality between SE, LnFDI and HC variable we employed the modified Wald test, proposed by Toda and Yamamoto (1995). The Toda and Yamamoto procedure examines the levels of the variables based on the Vector Autoregressive model (VAR). For the three variables SE, LnFDI and HC, the VAR model is given as:
0 1 21 1
1 1 1
2 1 2 1
1 1 1
D
D
k h k
t i t i t j i t i
i j k i
h k h
i t j i t i i t j t
j k i j k
SE SE SE LnF I
LnF I HC HC
α α α δ
δ θ θ µ
− − −
= = + =
− − −
= + = = +
= + + +
+ + + +
∑ ∑ ∑
∑ ∑ ∑
(Eq. 4)
0 1 2
1 1
1 2 1 2
1 1 1 1
2
D
t k iD
t i h iD
t ji j k
k h k h
i t i i t j i t i i t j
i j k i j k
t
LnF I LnF I LnF I
HC HC SE SE
β β β
θ θ α α
µ
− −
= = +
− − − −
= = + = = +
= + +
+ + + +
+
∑ ∑
∑ ∑ ∑ ∑
(Eq. 5)
0 1 2 1
1 1 1
2 1 2 3
1 1 1
D D
k h k
t i t i i t j i t i
i j k i
h k h
i t j i t i i t j t
j k i j k
HC HC HC SE
SE LnF I LnF I
γ γ γ α
α δ δ µ
− − −
= = + =
− − −
= + = = +
= + + + +
+ + +
∑ ∑ ∑
∑ ∑ ∑
(Eq. 6)
where: k is the lag length of the VAR model, which is chosen following AIC, SC, HQ criteria information value, and h = (k+d
max), with d
maxis the maximum lag length, obtained from the results of stationarity test. According to Toda and Yamamoto (1995), the maximum of d
maxis 2, because if d
max>
2 the tests based on F-statistic are not reliable (Nkoro & Uko, 2006). In Eq.4, Eq.5, Eq.6, LnFDI has a causal effect on SE if
∃ δ
1i≠ 0 ∀ i; HC has a causal effect on LnFDI if ∃ θ
1i≠ 0 ∀ i;
and SE has a causal effect on HC if ∃ α
1i≠ 0 ∀ i. The Granger classical causality test is based on variables with stationary at I(1). Toda and Yamamoto (1995) test can be applied whether the variable is stationary at I(0) or I(1), and there exists cointegration or no-cointegration (Mavrotas & Kelly, 2001).
4. Empirical Results and Discussion 4.1. Descriptive Statistics
The IMF report shows that the size of the shadow economy in Vietnam has continually decreased from 1991 to the present. In 2015, the size of the shadow economic activities in Vietnam was 14.78%, lower than the 27.78% on average
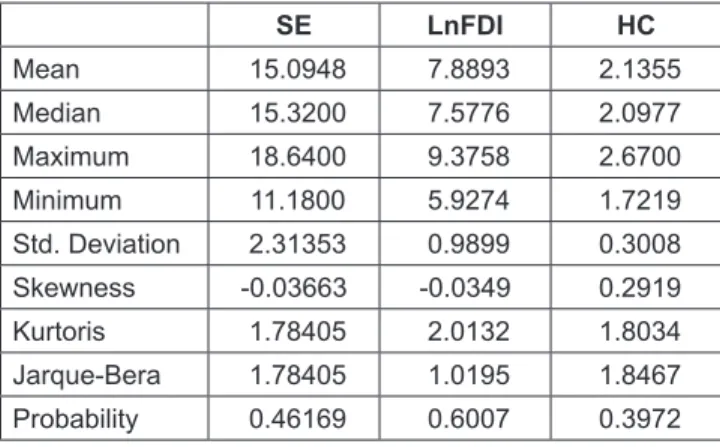
of 158 countries. In 2015, the size of the shadow economy sector of Thailand was 43.12%, Singapore 9.2%, Philippines 28.04%, Myanmar 50.99%, Malaysia 26.07%, Laos 25%, Indonesia 21.76%, and Cambodia 33.85%. That means the current size of the shadow economy of Vietnam is only higher than that of Singapore and is lower than that of most other Asian countries. Meanwhile, attracting FDI and the ‘human capital’ of Vietnam keeps improving. In 2015, Vietnam attracted 11.8 billion in FDI coming from 126 countries and territories with investment activities in Vietnam. Descriptive statistics of the variables are shown in Table 1.
Table 1: Descriptive statistics of the variables
SE LnFDI HC
Mean 15.0948 7.8893 2.1355
Median 15.3200 7.5776 2.0977
Maximum 18.6400 9.3758 2.6700
Minimum 11.1800 5.9274 1.7219
Std. Deviation 2.31353 0.9899 0.3008
Skewness -0.03663 -0.0349 0.2919
Kurtoris 1.78405 2.0132 1.8034
Jarque-Bera 1.78405 1.0195 1.8467
Probability 0.46169 0.6007 0.3972
4.2. Empirical Results 4.2.1. Unit-root Test
While using time series data, the first step is to examine the stationarity of all the variables. We use both the Augmented Dickey-Fuller (1981) (ADF test) and Phillips and Perron (1988) (PP test) to test the tendency of a unit-root test over a time series. With the null hypothesis (H
0: Data is not stationary) against the alternative hypothesis (H
1: Data is stationary). The results of the unit-root test of variables are shown in Table 2. Results in Table 2 shown SE, HC variables were stationary at I(0), LnFDI variable was stationary at I(1). So, the conditions to apply the ARDL model, Toda and Yamamoto test (dmax < 2) are satisfied.
Table 2: Results of the stationary test
Variable Level First difference
ADF test PP test ADF test PP test SE -4.555*** -4.556*** -7.551*** -11.073***
LnFDI -1.402 -1.450 -3.278** -3.236**
HC -3.106 -3.601* -3.368 -3.867*
***, ** and * respectively denote significance levels of 1%; 5% and
10%.
4.2.2. Determination of Optimal Lag Length
In the ARDL model, identification of optimal lag length is important. The optimal lag length indicates the volatility of the variables in the current period is in correlation with how many the previous period. Based on AIC, SC, HQ critical information, the length of optimal lags of Vietnam’s data is 2 and the optimal model for Eq.2 is ARDL(1,1,0). Then, in Eq.2, m
1= m
2= 1, and m
3= 0.
4.2.3. Cointegration Test
This study employed Bounds testing to check the cointegration among variables. The Bounds testing is based on the F-statistics. The null hypothesis in Eq.2 is (H
0:
1 2 3
0
β = β = β = ) against the alternative hypothesis (H
1:
1 2 3