〈학술논문〉
DOI: https://doi.org/10.15231/jksc.2017.22.3.023
ISSN 1226-0959 eISSN 2466-2089† Corresponding Author, [email protected]
This is an Open-Access article distributed under the terms of the Creative Commons Attribution Non-Commercial License (http://creativecommons.org/licences/by-nc/4.0) which permits unrestricted non-commercial use, distribution, and reproduction in any medium, provided the original work is properly cited.
충격파관 저압실내 가스 혼합시간 예측에 관한 수치해석
왕위엔강*․조천현*․손채훈* †․윤영빈**
*
세종대학교 기계공학과 ․
**서울대학교 기계항공공학부
A Numerical Study on Gas Mixing Time in a Low-Pressure (Driven) Section of a Shock Tube
YuanGang Wang*, Cheon Hyeon Cho*, Chae Hoon Sohn* † and Youngbin Yoon**
*Department of Mechanical Engineering, Sejong University, Korea
**School of Mechanical and Aerospace Engineering, Seoul National University, Korea
(Received 12 June 2017, Received in revised form 18 June 2017, Accepted 20 June 2017)ABSTRACT
The fuel and oxidizer mixing process in the shock tube driven section is simulated numerically. The boundary condition is set based on an shock tube experimental condition. The objective is to predict the gas mixing time for experiments. In the experiment, the amount of fuel to be injected is determined in advance. Then, according to duration of fuel injection, 5 cases with the same fuel mass but different fuel mass flow rate are simulated. After fuel is injected into the driven section, the fuel and air will be mixed with each other through convection and diffusion processes. The mixing time is predicted numerically for experiments.
Key Words : Shock tube, Driven part, Mixing time, Fuel injection duration
Nomenclature
c
: Concentrationt
: Timen
: Dimension numberx
: DistanceD
: Diffusion coefficientD
p : Averaged percentage differenceL
p : Left side percentage differenceR
p : Right side percentage difference1. Introduction
A shock tube is the experimental device that adopts the principle of gas compression to achieve very high stagnation temperatures. Temperature, pressure, and shock speed can be easily adjusted over a wide range by using the incident and reflected shocks in the tube.
Therefore, the shock tube is a useful device to study the ignition delay time and chemical kinetics. And, it has been widely used in the research areas [1-3].
Ignition delay time and chemical kinetics have been studied for a long time by using shock tube and the approaches are well known [4,5]. A shock tube is composed of a high pressure or driver section and a low pressure or driven section which are separated by an insert section which plays the role of diaphragm.
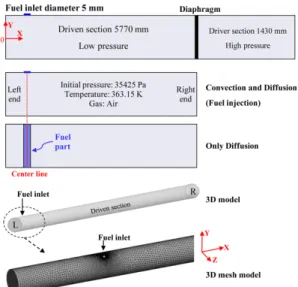
The geometry of a sample shock tube, which is modeled based on a actual experimental equipment, is illustrated in Fig. 1 [6,7]. In the shock tube driver section, the inert gas such as Helium is used as a driver gas. In order to study ignition delay time of a mixture, the mixture of fuel and oxidizer will be injected into the driven section. Many previous studies showed that ignition delay time depends on pressure, temperature, and equivalence ratio [7-9]. In experiments, fuel and oxidizer need to be mixed at a specified equivalence
Fig. 1. The schematic diagram of the shock tube and the 3D model of driven section.
ratio. If the fuel is in a gas phase at normal tem- perature, it can be mixed with oxidizer in a mixing chamber in advance. Then, the mixture can be injected into the driven section. But, if the fuel is in a fluid phase, it needs to be pre-evaporated first. Because there is danger of explosion if the liquid fuel is heated and mixed with air in a relative small volume mixing chamber. Accordingly, after evaporation, the fuel will be injected directly into the shock tube driven section and mixed with oxidizer. In the meantime, one problem arises, that is, how long it takes to achieve the final equilibrium state in such a long driven section with its length of 5.77 m. If the fuel and air can not be mixed well, the equivalence ratio will be varied locally. This may cause wrong ignition delay time at a specified equivalence ratio. In order to reduce this uncertainty in ignition delay time, the fuel-oxidizer mixing time in the driven section should be evaluated accurately.
And, it can be applied to experiments.
In this regard, the present numerical work evaluates the homogeneous mixing time of fuel and oxidizer in a shock tube driven section.
2. Numerical Methods
2.1. Geometry and Mesh
Fig. 1 shows the cross section(XY plane) of the shock tube. The driver and the driven sections have lengths of 1430 mm and 5770 mm, respectively. The
diameter of the fuel inlet is 5 mm. The distance between the fuel inlet and the left end is 250 mm, which is the same as that in experiments.
Because the objective of this work is to measure the mixing time of fuel and oxidizer in the driven section. Then, only 5770 mm driven section with a fuel inlet will be simulated numerically here. In the numerical simulations, a 3-dimensional geometry is modelled with unstructured grids. To check the grid- independency, 5 cases are simulated with mesh grids ranging from 130,000 to 470,000. Results show that the case with 215,000 mesh grids provides accurate and cost-effective. Accordingly, the number of meshes is adopted in all the numerical following simulations.
2.2. Governing Equations
For the numerical analysis of the gaseous mixing in the driven section of a shock tube, the continuity, momentum, energy equations, and the equation of state are solved simultaneously [6].
Because the fuel inlet velocity is about 0.5 m/s and its Reynolds number is about 1800, the fuel flow can be considered as a laminar flow. Then, the laminar flow model is adopted with the aid of appropriate numerical schemes and all simulations are calculated by using the general purpose CFD code, FLUENT [10]. The transient flow is solved with the pressure-based scheme and time integration.
Attention is paid to the setting of the time step for transient solution. If a transient simulation is started from an approximate initial guess, the initial transient results will not be accurate [11]. To avoid the in- accurate initialization, the time step is set to 0.005 s first. After about 3000 iterations in calculation when a relative well converged result is received by checking the residual of the simulation, the time step will be set as 30 s. It is predicted that the diffusion process will takes dozens of hours. And, a relatively large time step will be taken to reduce the computational time without losing accuracy.
2.3. Boundary Conditions
One set of boundary conditions from experiments is selected here for numerical simulation. In experiments, pressure and temperature of air injected into the driven section are 35,425 Pa and 363.15 K, respectively. Then, fuel, n-octane, is injected until pressure reaches 36,125 Pa, which is the target pressure of the driven section.
Fuel duration time [s]
Fuel mass flow rate [kg/s]
Total fuel mass [kg]
1 5.020×10
-45.020×10-4
20 2.510×10
-540 1.255×10
-550 1.004×10
-5100 0.502×10
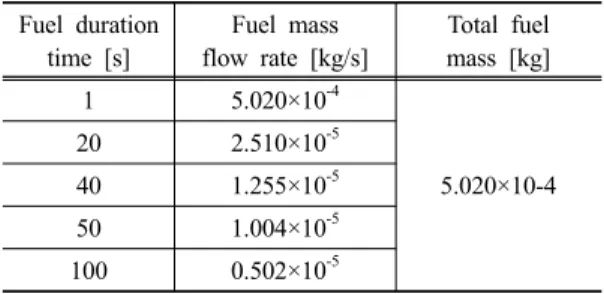
-5Table 1. Fuel injection duration and mass flow rates with a fixed total flow rate.
Equivalence ratio of the mixture of fuel and air is unity. Increased fuel mass can be calculated by using the ideal gas law based on the pressure difference. In the experiment, the air and fuel will be injected into the driven section successively. However, in the numerical simulation, air with pressure of 35,425 Pa is stored initially in the driven section. And, only fuel is injected into driven section to get the target pressure of 36,125 Pa.
In experiments, the partial pressure of the injected fuel can be monitored by a static pressure sensor. But, the fuel injection duration and fuel mass flow rate can not be specified. Accordingly, by changing the fuel injection duration, five cases with different duration of 1 s, 20 s, 40 s, 50 s and 100 s are simulated here.
Because the injected fuel mass should be same, thus the fuel mass flow rates of five cases depend on duration time, which are listed in Table 1. The simula- tion consists of two parts. The first part is for fuel injection into the driven section with different duration time. The second part is for the diffusion process of fuel in the driven section after its injection. After the specified mass of fuel is injected completely into the driven section, the fuel inlet is closed. That is, it is changed to a wall boundary. It means that the driven section becomes a closed tube. The injected fuel and the stored air in the driven section are mixed by means of convection and diffusion processed.
The mixing time of fuel and air is defined as the time which is taken until homogeneous mixing is attained. That is, the time from the end of fuel injection duration till the time when fuel and air is mixed homogeneously.
For comparative study, another case, in which only diffusion process is considered, is simulated as shown in Fig. 1. Both of fuel and air are stored initially in the driven section. The centerline of fuel part and the fuel inlet are located at the same position. Then, the
transport distance of 5.464 m is the length from the fuel part to the right end of the driven section. In this case, the fuel and air will be mixed only by diffusion.
And, the mixing time corresponds to the diffusion time for homogeneous mixing. In all of cases, the gravitational acceleration is set to 9.81 m/s2 in the negative Y axis direction.
2.4. Gas Diffusion
Generally, the mixing time of fuel and oxidizer is determined by convection and diffusion processes of fuel. Before numerical simulation, the time is estimated approximately from an analytic solution, where only gas diffusion is considered.
The diffusion coefficient of n-octane vapor into air can be found from the literature [12]. By taking initial pressure of 36,125 Pa and temperature of 363.15 K into consideration, the diffusion coefficient, D, is eva- luated 2.49×10⁻⁵ m2/s.
The Fick’s second law with a constant diffusion coefficient, D is expressed by the equation [13],
, (1)
where c denotes concentration and x distance. In general, for n dimensional isotropic diffusion, the diffusion time can be estimated approximately by the equation [14,15]:
. (2)
3. Results and Discussions
3.1. Mixing Time by Diffusion onlyIn this work, the length for mixing is 5.464 m as mentioned in section 2.3. From Eq. (2), the diffusion time, t in this case is estimated 83 hours. From num- erical results, where only diffusion is considered, the mixing time to reach the final equilibrium state is calculated to be 75 hours. The discrepancy is around 9.6% compared with the theoretical prediction. And, detailed numerical results including this case are de- scribed in the following section.
3.2. Mixing Time by Convection and Diffusion By controlling the duration time of fuel injection,
Fig. 3. Fuel mole fraction increases as fuel injection with different duration.
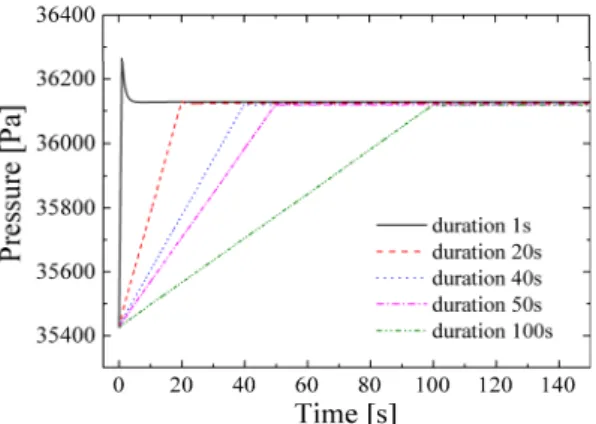
Fig. 2. Pressure increases as fuel injection with diffe- rent duration.
Fig. 4. Pressure and fuel mole fraction in the 5 cases with different duration times at the equilibrium state compared with the baseline values (equili- brium values).
Fig. 5. The fuel mole fraction contour change as time of duration time 1 s case.
five cases are simulated numerically and temporal profiles of pressure and fuel mole fraction are shown in Figs. 2 and 3, respectively. In Fig. 2, pressure is monitored on the XY plane (Z=0 mm) and the area- averaged value on the plane is plotted as a function of time. Pressure rises from the same initial value of 35,425 Pa to the final or target value of 361,25 Pa at different rate with different duration time. It is note- worthy that with the duration time of 1 s, pressure increases instantaneously to a higher value than 36,125 Pa at the end time of fuel injection and then decreases to the target value. This is because the fuel injection velocity with short duration time is relatively high. In other words, it can be considered as a local pressure fluctuation. In Fig. 3, similarly, temporal profile of fuel mole fraction is plotted. Fuel mole fraction continues to increase with different rate and then, it reaches the same value in all the cases. As described previously, the simulation can be divided into two parts:
fuel injection part and mixing part. From the Figs. 2
and 3, two parts are clearly distinctive in terms of transient behavior. The fuel injection part can be iden- tified by increase in pressure and fuel mole fraction, which are indicated by slant lines. After that, they levels off in the second mixing part. The mixing time can be estimated from the temporal profiles of pressure and fuel mole fraction in Figs. 2 and 3.
Fig. 4 illustrates the final pressure and fuel mole fraction in the 5 cases. The final values of pressure and fuel mole fraction agree well with theoretical values of 36,125 Pa and 0.0194, respectively.
The transient mixing process is visualized in Fig. 5.
It shows that fuel mole fraction changes with time for duration time of 1 s as one example. During fuel in-
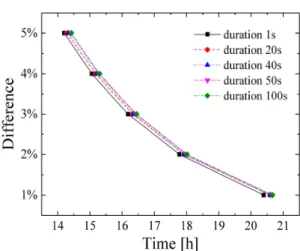
Fig. 8. The required time comparison as difference de- creases between fuel injection cases and only diffusion case.
Fig. 6. Transient fuel mole fraction profiles along X axis from the left end side(X=0 mm) to the right end side(X=5770 mm) with duration time of 1 s.
Fig. 7. The required time comparison as difference de- creases of 5 cases.
jection, fuel flows into the driven section and starts to mix with air. After 1 s, gas mixing goes on through convection and diffusion. From the figures, it is found that fuel diffuses from the left end to the right end.
When the fuel arrives at the right end, it is reflected back to the left side and this process is repeated. Finally, fuel and air are mixed homogeneously and reach an equilibrium state after a long time. With the duration time of 1 s, the final equilibrium state is reached after about 28 hours.
Transient fuel mole fraction profiles are shown in Fig. 6 (Duration time is 1 s). At the beginning of the gas mixing, fuel is concentrated in the left side of the driven section because fuel is injected in the left side.
As time goes on, fuel mole fraction decreases in the left because fuel diffuses to the right side. And thereby, fuel mole fraction increases in the right. Finally, after about 28 hours, fuel mole fraction becomes almost flat. Actually, the difference between the left and the right sides is nearly zero. The final or equilibrium value of fuel mole fraction is shown by a black solid line in Fig. 6.
In order to calculate the time when the equilibrium state is reached, the averaged percentage difference Dp
between both sides is defined as
, (3)
where Lp and
R
p are the percentage difference value between the equilibrium value and the left and betweenthe equilibrium and the right end value, respectively.
The parameter, Dp with duration of 1 s is shown in Fig. 7. The time when Dp value reaches 5%, 3%, and 1% can be seen. From Fig. 7, it is seen that Dp
decreases from 5% to 1% takes about 6 hours. It takes
D
p 8 hours to decrease from 1% to 0%. It means that the mixing process goes on with time and gradually slows down. However, in experiments, there is no need to wait such a long time for only 1% difference.Fig. 7 illustrates the gas mixing time which is taken when the Dp decreases from 5% to 1% in all the 5 cases. Certainly, the mixing time becomes longer to get lower Dp. As the duration time increases, the mixing time becomes a little longer, but it does not affect the mixing time significantly. When duration time increases from 1 s to 100 s, the fuel injection
velocity will decrease. And, the initial process in the driven section at the beginning of gas mixing will be closer to the mixing process of the diffusion only. The gas mixing time difference between all the cases is small and only about 1.5%. Then, in experiments, the 14 and 15 hours mixing time for Dp of 5% and 4%
is practically acceptable.
The diffusion only case is compared with the other 5 cases in Fig. 8. Its gas mixing time is almost twice as long as the other five cases because gas transport is made by only gas diffusion.
4. Conclusion
In this work, a numerical study on gas mixing time in a shock tube driven section has been conducted.
When duration time for fuel supply increases, the gas mixing time until the equilibrium state increases.
Cases which consider both convection and diffusion shortens the gas mixing time by a factor of two com- pared with the only diffusion case. A predicted gas mixing time is around 14 or 15 hours, which will be applied for experiments.
In future works, the predicted gas mixing time will be tested in the shock tube experiments. Effect of gas mixing time on the ignition delay time will be studied experimentally. And then, the shock tube will be used to measure ignition delay time of various fuels.
Acknowledgement
본 연구는 서울대학교 차세대 우주추진 연구센터 와 연계된 미래창조과학부의 재원으로 한국연구재 단의 지원을 받아 수행한 선도연구센터지원사업(NRF- 2013R1A5A1073861)의 연구 결과입니다. 또한, 본 연구에서 저자중 손채훈은 한국연구재단(미래창조과 학부)의 우주핵심기술개발사업(NRF-2015M1A3A3A- 02009957)과 세종대학교 교내 연구비 지원을 받았으 며, 이에 감사드립니다.
References
[1] Hilal El Merhubi, Alan Kéromnès, Gianni Cata- lano, Benoîte Lefort, Luis Le Moyne, A high pre- ssure experimental and numerical study of methane ignition, Fuel, (2016), 164-172.
[2] NanBei, The Development of High Pressure Shock Tube and Experimental Study on Ignition Delay of Hydrocarbon, Shanghai jiaotong University,
Master’s thesis, 2011, 2-7.
[3] Hsi-Ping S. Shen, Jeremy Vanderover, Matthew A. Oehlschlaeger, A shock tube study of iso-octane ignition at elevated pressures: The influence of diluent gases, Combust. Flame., 155 (2008), 739- 755.
[4] Robert S. Tranter, Binod R. Giri and John H.
Kiefer, Shock tube/time-of-flight mass spectro- meter for high temperature kinetic studies, Re- view of scientific instruments, 78 (2007), No.
034101.
[5] A. E.L. Bakali, P. Dagaut, L. Pillier and P.
Meunier, Experimental and modeling study of the oxidation of natural gas in a premixed flame, shock tube, and jet-stirred reactor, Combust. Flame., 137 (2004), 109-128.
[6] YuanGang Wang, Chul Jin Kim, Chae Hoon Sohn, In-Seuck Jeung, A Numerical Study on Pressure Variation in a Shock Tube by Changing the Dia- meter Ratio of Low-Pressure (Driven) to High- Pressure (Driver) Part, J. Korean Soc. Combust., 21 (2016), 16-22.
[7] Hee Sun Han, YuanGang Wang, Chul Jin Kim, Chae Hoon Sohn, Measurement of Ignition Delay Time of Methane/Oxygen Mixtures by Using a Shock Tube, J. Korean Soc. Combust., 22 (2017), 8-13.
[8] Luong Dinh Thi, Yingjia Zhang, Zuohua Huang, Shock tube study on ignition delay of multi-com- ponent syngas mixtures - Effect of equivalence ra- tio, Int. J. Hydrog. Energy, 39 (2014), 6034-6043.
[9] D. F. Davidson, M. A. Oehlschlaeger, J. T. Her- bon, R. K. Hanson, Shock tube measurement of Iso-octane ignition times and OH concentration time histories, Proc. Combust. Inst., 29 (2002), 1295-1301.
[10] ANSYS Inc., ANSYS Fluent Theory Guide, 2015.
[11] ANSYS Inc., ANSYS Fluent Tutorial Guide, 2015.
[12] Landolt-Börnstein, Gases in Gases, Liquids and their Mixtures, 15 (2007).
[13] Scott A. Socolofsky, Gerhard H. Jirka, Environ- mental Fluid Mechanics Part I: Mass Transfer and Diffusion, 2nd Edition, 2002, 2-17.
[14] Daniel M. Dobkin, Michael K. Zuraw, Principles of Chemical Vapor Deposition, 1st Edition, 27-66.
[15] Weidong He, Weiqiang Lv, James H. Dickerson, Gas Transport in Solid Oxide Fuel Cells, Combust.
Flame., 2014, 9-16.