Accuracy and precision of integumental linear dimensions in a three-dimensional facial imaging system
Objective: A recently developed facial scanning method uses three-dimensional (3D) surface imaging with a light-emitting diode. Such scanning enables surface data to be captured in high-resolution color and at relatively fast speeds. The purpose of this study was to evaluate the accuracy and precision of 3D images obtained using the Morpheus 3D® scanner (Morpheus Co., Seoul, Korea).
Methods: The sample comprised 30 subjects aged 24−34 years (mean 29.0 ± 2.5 years). To test the correlation between direct and 3D image measurements, 21 landmarks were labeled on the face of each subject. Sixteen direct measurements were obtained twice using digital calipers; the same measurements were then made on two sets of 3D facial images. The mean values of measurements obtained from both methods were compared. To investigate the precision, a comparison was made between two sets of measurements taken with each method. Results: When comparing the variables from both methods, five of the 16 possible anthropometric variables were found to be significantly different.
However, in 12 of the 16 cases, the mean difference was under 1 mm. The ave- rage value of the differences for all variables was 0.75 mm. Precision was high in both methods, with error magnitudes under 0.5 mm. Conclusions: 3D scanning images have high levels of precision and fairly good congruence with traditional anthropometry methods, with mean differences of less than 1 mm. 3D surface imaging using the Morpheus 3D® scanner is therefore a clinically acceptable method of recording facial integumental data.
[Korean J Orthod 2015;45(3):105-112]
Key words: Three-dimensional scanner, Three-dimensional diagnosis and treat- ment planning, Structured light-based scanners
Soo-Hwan Kim
aWoo-Young Jung
aYu-Jin Seo
aKyung-A Kim
aKi-Ho Park
bYoung-Guk Park
ba
Department of Orthodontics, School of Dentistry, Kyung Hee University, Seoul, Korea
b
Department of Orthodontics, Oral Biology Research Institute, Kyung Hee University, Seoul, Korea
Received August 17, 2014; Revised November 30, 2014; Accepted December 24, 2014.
Corresponding author: Young-Guk Park.
Professor, Department of Orthodontics, Oral Biology Research Institute, School of Den- tistry, Kyung Hee University, 26 Kyungheedae-ro, Dongdaemun-gu, Seoul 130-701, Korea.
Tel +82-2-958-9392 e-mail [email protected]
*This study was supported by a grant from the Korean Health Technology Research &
Development Project, by the Ministry of Health & Welfare, Republic of Korea (HI14C2241).
© 2015 The Korean Association of Orthodontists.
The authors report no commercial, proprietary, or financial interest in the products or companies described in this article.
This is an Open Access article distributed under the terms of the Creative Commons Attribution Non-Commercial License (http://creativecommons.org/licenses/by-nc/4.0) which permits unrestricted non-commercial use, distribution, and reproduction in any medium, provided the original work is properly cited.
pISSN 2234-7518 • eISSN 2005-372X
http://dx.doi.org/10.4041/kjod.2015.45.3.105
INTRODUCTION
Acquiring patient data, including facial images of the head and neck region, is an integral step in the diag- nosis, treatment planning, and evaluation of orthodontic treatment and orthognathic surgery. Traditionally, information regarding soft tissues has been recorded in the form of photographs taken from various angles.
Two-dimensional (2D) photogrammetry is a convenient and economical way of capturing and archiving facial images. However, it has several limi tations. First, it offers limited angles. Second, since it is influenced by both the photographing angle and the distance, the results are often inconsistent. Furthermore, it does not permit linear measurements between landmarks and therefore offers only proportional data regarding the facial soft tissues.
Direct anthropometry was developed to overcome these drawbacks and to allow linear measurements. However, even this method has its disadvantages, such as pre- requisite training on live subjects and multiple time- consuming direct measurements during examination.
1Advances in cone-beam computed tomography (CBCT) have facilitated the recording of facial integumental data. CBCT has gained popularity because of its low dose of radiation, relatively high speed, and small unit size compared to conventional computed tomography (CT). In fact, it has become a routine examination for the diagnosis and planning of orthognathic surgeries.
How ever, CBCT does not record the texture or color of soft tissues.
2Three-dimensional (3D) photogrammetry is currently commercially available in a variety of imaging systems and provides an alternative method of obtaining and recording facial integumental data. It offers many ad- vantages over traditional methods: the quantification of angles, surface areas, and volumes, in addition to linear distances; user-guided interactive landmark localization;
the potential for extracting x, y, and z coordinate data for a wide variety of statistical shape analyses; and the speed with which images can be stored in a permanent archival record of a subject’s face.
3A major reason for using 3D digital photogrammetry is the ability to cap- ture surface data in high-resolution color at relatively fast speeds, a considerable advantage when working with young or developmentally impaired subjects.
4-6Based on the method of scanning, available systems can be divided into two types: laser surface scanning and, more recently, light emitting diode (LED) white light scanning. Since LED white light is innocuous to the human body, a range of devices using this light have flooded the market, and these differ considerably in terms of cost, capture method, imaging hardware, and software. Additionally, based on the method of data capture, there are two types of devices that use LED
white light; stereo-photogrammetry and structured- light systems. In stereo-photogrammetry, two or more cameras obtain the images from slightly different angles, and, by triangulation, match the corresponding features between the images to construct the 3D surface.
5In a structured-light system, a 3D scanner projects patterns of light and acquires the distortions of patterns to calculate the 3D coordinates of details on the object’s surface.
In the past, studies of the accuracy and precision of 3D scanners that use LED white light have focused on devices that use stereo-photogrammetry for data cap- turing.
3,7-10Furthermore, there have been few studies evaluating the precision and accuracy of systems that use structured light scanning, such as the Morpheus 3D® scanner (Morpheus Co., Seoul, Korea).
The Morpheus 3D® scanner is an example of a 3D pho- togrammetry imaging device that uses a structured- light scanning system. It has gained popularity due to its small size (dimensions: H × W × D, 390 × 140
× 240 mm), ease of use, and ability to acquire data rapidly (0.8 seconds). However, little is known about the accuracy and precision of this device. Before any system can be implemented in quantitative studies of patient populations, errors in producing and measuring images must be evaluated. A study that evaluates the accuracy and precision of such a device on human subjects, under realistic conditions of data collection, is required in order to accurately determine the impact of various sources of error, including those caused by biological variation, on the measures collected.
3Therefore, this study aims to evaluate the accuracy and precision of 3D facial scanning, specifically the linear accuracy of 3D facial scanning between the virtual imaging and direct integumental measurements, by the Morpheus 3D® scanner. In this study, accuracy is defined as the extent of deviation when comparing measurement values between direct anthropometry and the Morpheus 3D® system, and precision is defined as the absolute difference between repeated measurements of the same entity.
MATERIALS AND METHODS
Study sample
The sample comprised a total of 30 subjects aged 24 to 34 years (mean, 29.0 ± 2.5 years). Twenty of the 30 participants were male. All the subjects were healthy and morphologically normal.
Data acquisition
3D surface data were acquired at the Department of
Orthodontics, School of Dentistry, Kyung Hee University,
following approved IRB protocols (IRB No: KHDIRB
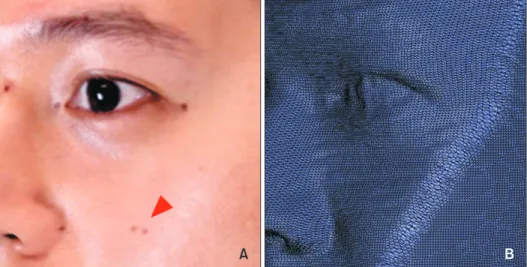
1310-1). Twenty-one landmarks were labeled on the face of each subject using a sharpened eyeliner pencil (Figure 1). Since direct labeling of the exocanthion (Ex) and endocanthion (En) with a marker would have been too invasive, the nearest points on the skin from the actual landmarks were labeled instead. Except for “ch”
and “Lal-4,” the linear distances were based on the standard anthropometric landmarks defined by Farkas.
11We defined the chelion (ch) as the most lateral aspect of the vermilion border of the corner of the subject’s mouth. We defined “La1-4” as points located 5 cm above the right Ex, right En, left En, and left Ex to
Figure 1. A, Craniofacial land- marks used in this stu dy.
11Tragion (Tra) is not shown. B, Linear distances mea sured using the Morpheus 3D® scanner.
La1-4: points located 5 cm above the right exocanthion, right endocanthion, left endo- canthion, and left exocanthion.
A B
Table 1. Definitions of landmarks used in this study
Landmark Definition
Nasion N Point in the midline of both the nasal root and the nasofrontal suture.
Alare Al The most lateral point on each alar contour.
Pronasale Pn The most protruded point of the apex nasi, identified in lateral view of the rest position of the head.
Subnasale Sn The midpoint of the angle at the columella base where the lower border of the nasal septum and the surface of the upper lip meet.
Labialesuperius Ls The midpoint of the upper vermilion line.
Labialeinferius Li The midpoint of the lower vermilion line.
Stomion Stm The imaginary point at the crossing of the vertical facial midline and the horizontal labial fissure between gently closed lips, with teeth shut in the natural position.
Cheilion Ch The most lateral aspect of the vermilion border of the corner of the subject’s mouth Tragion Tra The notch on the upper margin of the tragus.
Sublabiale B' The lower border of the lower lip or the upper border of the chin.
Pogonion Pog' The most anterior midpoint of the chin, located on the skin surface in front of the identical bony landmark of the mandible.
Endocanthion En The point at the inner commissure of the eye fissure.
(In this study, the nearest points on the skin from the actual landmarks.) Exocanthion Ex The point at the outercommissure of the eye fissure.
(In this study, the nearest points on the skin from the actual landmarks.) Cheek Ck The intersecting point of lines connecting Ala-Tra and Ex-Ch.
La1, 2, 3, and 4 The points located 5 cm above the right exocanthion, right endocanthion, left endocanthion,
and left exocanthion.
evaluate linear measurements on the subject’s forehead.
The landmarks used in this study are presented in Table 1.
Three-dimensional facial images were then taken with the Morpheus 3D® scanner. An LED white light was used as the light source in the imaging unit, providing a manufacturer’s accuracy of less than 0.1 mm. The entire scanning procedure took approximately 0.8 seconds. Pa- tients sat with natural head positions and reposed lips (Figure 2). For each subject, three images were taken from three different horizontal angles (the front, right, and left sides at an angle of 45
o) and then merged into a single 3D facial image.
Sixteen direct measurements using a digital caliper were made between the landmarks on each subject’s face. The same measurements were then made on the 3D facial images using the Morpheus 3D “line length”
tool, which enables measurements of the direct distance between two points. A single trained observer obtained all the measurements.
To investigate the precision, defined in this study as the absolute difference between repeated measurements of the same subject, one additional set of facial images was taken from all 30 subjects. Additional sets of measurements were directly drawn on the faces and on the 3D facial images. These were recorded separately to ensure that the observer was blinded to prior results.
Data analysis Accuracy
To determine the accuracy of the Morpheus 3D® scan- ner, the mean value of the two measurements derived from the two sets of 3D images of each subject was compared to the mean of those obtained with the digital
caliper. Prior to analysis, the Shapiro-Wilk test for data normality was performed on each variable. For normally distributed measurements, the Student t-test was performed. For other measurements, the nonparametric Wilcoxon signed rank test for paired data was used to compare the means. Additionally, the difference between the mean caliper and mean photogrammetry values was reported in order to provide directional information. All tests were performed using SPSS software version 12.0 (SPSS Inc., Chicago, IL, USA).
Precision
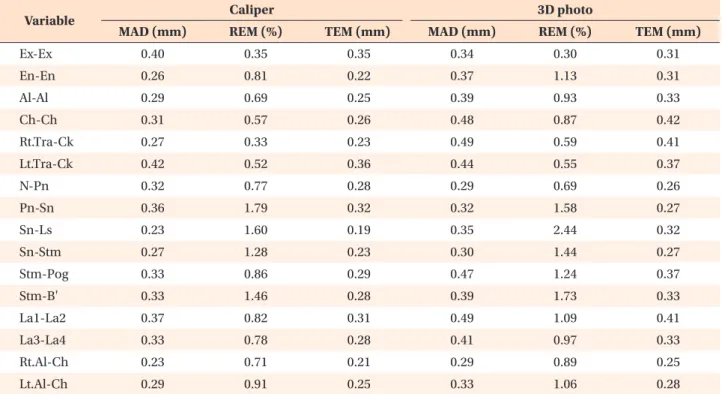
To quantify precision, two sets of measurements taken with each method were compared using three different precision estimates; mean absolute difference (MAD), relative error magnitude (REM), and technical error of measurement (TEM). MAD is a commonly reported pre- cision estimate.
12,13The advantages of MAD include the simplicity in its calculation, the ease with which it can be interpreted for comparative purposes, and its lack of dependence on size measurements.
13To obtain the REM, the MAD for a given variable was divided by its grand mean, and this result was then multiplied by 100. Therefore, the REM represents an estimate of the error magnitude, expressed as a per- centage, relative to the size of the measurement. In terms of reliability, a smaller percentage represents a more precise measurement. REM is analogous to a coefficient of variation, in which the standard deviation is divided by the mean. It is important because error magnitude scores alone can be misleading.
14Finally, the TEM is a standard-deviation − like estimate of error magnitude expressed in the original units of measurement. When there are two measurements involved, the formula for TEM is as follows:
8