
1. Introduction
Since power plants including nuclear power plants have been constructed in coastal region, sea water is commonly used in large quantity as cooling water. However, many metals and alloys in the plants have experienced corrosion, and chloride ions in the sea water have damaged metallic pipes and their welded parts [1-4]. The chloride ion in sea water is well known as a representative aggressive ion in the corrosion of metals & alloys. The dissolved oxygen in sea water and increased temperature also facili- tate the corrosion of the inner surface of tubing.
A great deal of pipes has been made using carbon steel and low alloy steel, and has thus been corroded, thinned, and finally penetrated by sea water corrosion. Therefore, many research efforts have been performed for a long time
[5]. One of the remedies to fight corrosion is the applica- tion of coating to the inside of the pipe; The first advant- age is that the coatings act as barrier between the pipe and sea water and control the corrosion of tubing. The second is that the coatings prevent the corrosion and thus increase the lifespan of tubing and reduce the repair [6].
However, the protective coatings may fail by long term exposure, cavitation, impingement of fluids, and variation of temperature and pressure [7]. If carbon steel is exposed by coating failure, the steel may corrode at a very high rate, especially in cavitation areas. This work focused on the effect of cavitation on the corrosion of carbon steel.
Cavitation is the repeated formation and collapse of bub- bles in a liquid [8]. Cavitation can be induced by high-fre- quency vibration in the flow (acoustic cavitation), or by sudden pressure variation in the flow (hydrodynamic cav- itation). When cavitation bubbles implode close to a sur- face, powerful micro-jets of velocity in the range (300 to 1,000) m/s are formed [9-13]. In addition, when strong cavitation occurs, the internal pressure in bubbles ex-
†Corresponding author: [email protected]
I. J. Jang: Master, K. T. Kim: Postdocs, Y. R. Yoo: Research Professor, Y. S. Kim: Professor
Effects of Ultrasonic Amplitude on Electrochemical Properties During Cavitation of Carbon Steel in 3.5% NaCl Solution
I. J. Jang, K. T. Kim, Y. R. Yoo, and Y. S. Kim† Materials Research Centre for Energy and Clean Technology, School of Materials Science and Engineering, Andong National University,
1375 Gyeongdong-ro, Andong, Gyeongbuk, 36729, Korea
(Received August 04, 2020; Revised August 21, 2020; Accepted August 22, 2020)
Cavitation corrosion in many industrial plants has recently become a serious issue. Cavitation corrosion has generally been investigated using a vibratory method based on ASTM G32 standard, and the test can be divided into direct cavitation and indirect cavitation. Cavitation corrosion test uses the vibration frequency of the horn of 20 kHz with constant peak-to-peak displacement amplitude. In this work, the peak-to-peak amplitude was controlled from 15 μm to 85 μm, and electrochemical measurements were obtained during indirect cavitation. The relationship between cavitation corrosion rate and electrochemical properties was discussed. Corrosion steps of carbon steel at the initial stage under cavitation condition in 3.5 % NaCl can be proposed. When the cavitation strength is relatively low, corrosion of the steel is more affected by the electrochemical process than by the mechanical process; but when the cavitation strength is relatively high, corrosion of the steel is affected more by the mechanical process than by the electrochemical process.
This work confirmed that the critical ultrasonic amplitude of 0.42 %C carbon steel is 53.8 μm, and when the amplitude is less than 53.8 μm, the corrosion effect during the cavitation corrosion process is higher than the mechanical effect.
Keywords: Carbon steel, Cavitation corrosion test, Cavitation corrosion rate, Electrochemical properties, Critical ultrasonic amplitude
plosively grows, induces severe erosion, and spreads from the center in the outward direction [14,15].
The erosion corrosion of metals and alloys used in many industrial plants has recently become a serious issue.
Cavitation corrosion has generally been investigated using a vibratory method based on ASTM G32 standard [16].
It can be divided into direct cavitation (this work, termed
‘Practice A’, and this type of electrochemical cavitation corrosion tester was described elsewhere [10,17] and indirect cavitation (this work, termed ‘Practice B’). Cavitation corro- sion tests were conducted to obtain results and the vibration frequency of the horn was 20 kHz with a constant peak-to-peak displacement amplitude. In the direct cav- itation test, the specimen was installed at the end of the horn [18-21]. However, many researchers used the modified ASTM G32. In the indirect cavitation test, the specimen was placed co-axially with the horn and was held at a distance of 1 mm and less from the horn [8,22-26]. In addition to acoustic cavitation methods, there are different methods of evaluating the flow assisted corrosion, which include a solution stirring method [27-29].
On the other hand, there are several kinds of research methods for cavitation corrosion behavior [30]; cavitation corrosion degree of materials is used as an indicator to evaluate the aggressiveness of the flow on the materials.
In addition, surface morphology, chemical composition, electrochemical properties, and surface mechanical prop-
erties are also investigated to explore the cavitation corro- sion characteristics and clarify the cavitation corrosion mechanism.
However, on the basis of literature survey, there are few systematic approaches to understanding cavitation corrosion behavior. The variation of cavitation strength in the real condition can be achieved by controlling the peak-to-peak amplitude. Therefore, in this work, the ul- trasonic peak-to-peak amplitude was controlled from (15 to 85) μm. Electrochemical measurements were con- ducted during the cavitation test. The relationship be- tween cavitation corrosion rate and electrochemical prop- erties was discussed.
2. Experimental Methods
2.1 Materials
Carbon steel of 0.42 %C was used in this work [31].
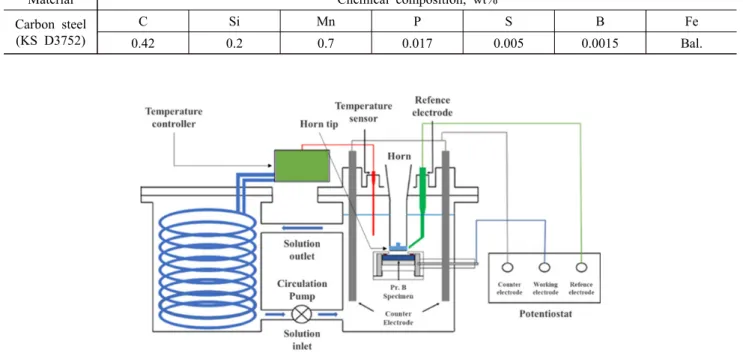
The dimensions of the specimen are 29 mm diameter, and 5 mm thickness. Table 1 shows the chemical composition 2.2 Cavitation corrosion test
2.2.1 Test equipment and test condition
Cavitation corrosion tester (R&B-RB111-CE, Korea) was made by a magnetostrictive-driven method and by modifying ASTM G32 standard [16]; Maximum
Material Chemical composition, wt%
Carbon steel (KS D3752)
C Si Mn P S B Fe
0.42 0.2 0.7 0.017 0.005 0.0015 Bal.
Table 1 Chemical composition of the experimental alloy
Fig. 1 Schematic of electrochemical cavitation corrosion test equipment.
power output of the tester was 1,000 W and ultrasonic transducer showing (20 KHz ± 5%) was used. The horn tip was made by super duplex stainless steel (Fe-25.8Cr-2.3Mo-0.2W-0.5Si-10.7Ni-0.65Mn-0.03C-0.4 2N-0.003S-0.023P), and its diameter was 16 mm. The distance between the horn tip and specimen was 0.5 mm and a new, freshly ground (# 2,000 SiC) horn tip was used in every test. Fig. 1 shows a schematic of the electrochemical cavitation corrosion tester using an indirect cavitation method - ‘Practice B’.
Test specimen having a diameter of 29 mm was ground by #2,000 SiC emery paper, and after installing in a corro- sion cell, cavitation corrosion tests were performed for 2, 4, and 6 h using an ultrasonic amplitude of 15, 50, and 85 μm (in this work, the peak-to peak amplitude was termed ‘ultrasonic amplitude’). Cavitation corrosion rate was calculated on the basis of weight loss and damage depth.
2.2.2 Electrochemical measurement during a cavitation Test specimen having a diameter of 29 mm after con- necting a rubber lined copper wire was mounted using an epoxy resin. After the surface was ground using a SiC paper of #2,000, the specimen was installed in the corro- sion cell. For Tafel test, a saturated calomel electrode (SCE) was used as a reference electrode, and high density graphite electrode was used as a counter electrode. Tafel test was performed using a potentiostat (Gamry DC 105, USA) from (-200 to +200) mV at open circuit potential at the scanning rate of 1 mV/sec. Test solution was 3.5
% NaCl at 15 °C, and Tafel plots were measured at every one hour after the initiation of cavitation (Test specimen was cathodic polarized at – 0.7 V(SCE) for 0.1 h before the cavitation).
2.3 Surface morphology observation
Surface morphology was observed using a digital cam- era, 3D Stereographic microscopy (HIROX, KH-7700, Japan), and FE-SEM (TESCAN, LYRA 3 XMH, Czech Republic).
3. Results
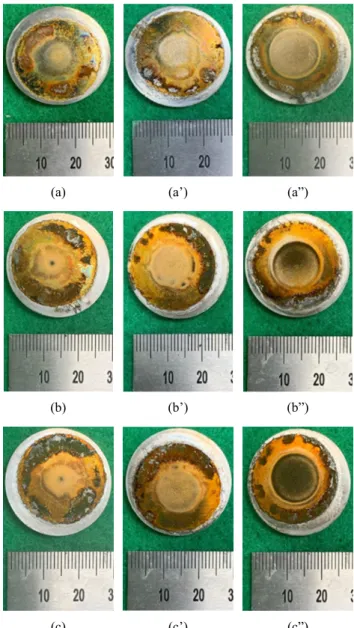
Fig. 2 shows the surface appearance after cavitation corro- sion test of 0.42 %C carbon steel in 3.5% NaCl at 15 °C and the photos were taken using a digital camera. In every specimen, two corroded circles were observed. The inner circle was formed by the cavitation and the outer circle was formed by the exposure to test solution. Increasing ultrasonic amplitude and test time facilitated the corrosion of carbon steel.
In order to identify the effect of ultrasonic amplitude and test time, the surface appearance of the center area of the specimen was observed by SEM. Fig. 3 reveals the effect of ultrasonic amplitude and cavitation time on the surface damage of 0.42 %C carbon steel in 3.5 % NaCl at 15 °C (SEM, ×200). In the case of 2 h cavitation with ultrasonic amplitude 15 μm, many localized corroded areas were observed but on increasing the cavitation time, corroded areas were spread out. The figures show that increasing the ultrasonic amplitude deepened and widened
(a) (a’) (a”)
(b) (b’) (b”)
(c) (c’) (c”)
Fig. 2 Surface appearance after cavitation corrosion test of 0.42 %C carbon steel in 3.5 % NaCl at 15 °C (Digital camera) : (a) (b) (c) Ultrasonic amplitude 15 μm, (a’) (b’) (c’) Ultrasonic amplitude 50μm, (a’’) (b’’) (c’’) Ultrasonic amplitude 85 μm, (a) (a’) (a’’) Cavitation time 2 h, (b) (b’) (b’’) Cavitation time 4 h, (c) (c’) (c’’) Cavitation time 6 h.
the corroded area. This is due to the increased cavity by higher ultrasonic amplitude.
Does the cavitation corrosion occur only in the area be- low the ultrasonic horn tip near the inner circle in Fig.
2, Fig. 4a depicts two observed areas; Indirect Affected Area (IAA) means the area apart from the ultrasonic horn tip and Direct Affected Area (DAA) refers to the area below and near the horn tip. Fig. 4b, c, d show the cav- itation damage in the ferrite phase formed on the Indirect Affected Area of 0.42 %C carbon steel. Uniform corrosion can usually occur in carbon steel exposed to a stagnant chloride solution [32], but the localized corrosion was formed. The corroded parts look like spherical pitting.
More pits in the ferrite phase were observed than in the pearlite phase. On the other hand, Fig. 5 presents the cav- itation damage in the ferrite and pearlite phases formed on the Direct Affected Area of 0.42 %C carbon steel.
The observed area was below and near the ultrasonic horn tip. Fig. 5a shows that a severely damaged area was formed, and many pits were also observed. Fig. 5b shows
the corroded pit in the ferrite phase, but Fig. 5c reveals the selective corrosion of ferrite phase and the remained cementite in the pearlite phase, while Fig. 5d depicts the corrosion of pearlite phase and the selective ferrite corro- sion and remaining cementite beneath the pearlite phase.
It is considered that the selective corrosion is related to the hardness of phases (ferrite; HB 90 , cementite; HB
(a) (a’) (a”)
(b) (b’) (b”)
(c) (c’) (c”)
Fig. 3 Effect of ultrasonic amplitude and cavitation time on the surface damage of 0.42 %C carbon steel in 3.5 % NaCl at 15
°C (SEM, ×200) : (a) (b) (c) Ultrasonic amplitude 15 μm, (a’) (b’) (c’) Ultrasonic amplitude 50 μm, (a’’) (b’’) (c’’) Ultrasonic amplitude 85 μm, (a) (a’) (a’’) Cavitation time 2 h, (b) (b’) (b’’) Cavitation time 4 h, (c) (c’) (c’’) Cavitation time 6 h.
(a) (b)
(c) (d)
Fig. 5 Cavitation damage in the ferrite and pearlite phases formed on the DAA of 0.42 %C carbon steel (cavitation corrosion test;
3.5 % NaCl at 15 °C for 2 h using 15 μm ultrasonic amplitude (SEM) : (a) Cavitated areas (×2,000), (b) Area #1 (×30,000), (c) Area #2 (×30,000), (d) Area #3 (×30,000).
(a) (b)
(c) (d)
Fig. 4 (a) Observed area (IAA- Indirect Affected Area, DAA-Direct Affected Area), and (b) (c) (d) cavitation damage in the ferrite phase formed on the IAA of 0.42 %C carbon steel (cavitation corrosion test; 3.5 % NaCl at 15 °C for 2 h using 15 μm ultrasonic amplitude (SEM, ×2000)).
600) [33], and cementite would act as cathodic site to promote the corrosion of ferrite phase of the steel [34-35].
However, it should be noted that the selective corrosion cannot be identified in the severely cavitation-corroded area by a high ultrasonic amplitude and long-time cav- itation test.
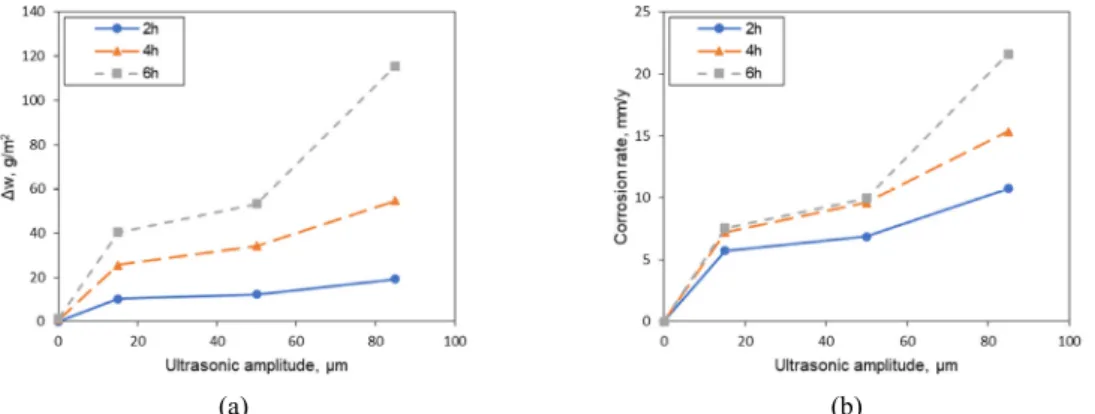
After each cavitation test, the weight loss was measured, and the corrosion rate was calculated. Fig. 6 shows the effect of ultrasonic amplitude on (a) the weight loss, and (b) the cavitation corrosion rate of 0.42 %C carbon steel in 3.5 % NaCl at 15 °C. The weight loss and corrosion rate of the specimen in the stagnant test solution were 1.02 g/m2 and 0.02 mm/yr, respectively. In the case of 2 h cavitation corrosion test, the corrosion rate was 5.72 mm/yr, and when the ultrasonic amplitude increases, the corrosion rate gradually increased. However, in the case of cavitation corrosion test at the ultrasonic amplitude 85 μm, the corrosion rate was abruptly increased from 10.76 mm/yr to 21.63 mm/yr. Fig. 7 presents the effect of cav- itation corrosion time on (a) the weight loss and (b) the cavitation corrosion rate of 0.42 %C carbon steel in 3.5
% NaCl at 15 °C (AMP 0 means the stagnant solution).
When the ultrasonic amplitude was low, the effect of test time was small. However, when the amplitude was high, the effect of test time was very large.
Fig. 8 shows the surface appearance by 3D microscopy of 0.42 %C carbon steel after cavitation corrosion test.
From the 3D microscopy the cavitation corroded depth (i.e. maximum corrosion depth) can be obtained, as shown in Fig. 9. Fig. 9 reveals the effect of (a) ultrasonic ampli- tude and (b) cavitation corrosion time on the cav- itation-corroded depth of 0.42 %C carbon steel in 3.5 % NaCl at 15 °C. The cavitation corroded depths with the amplitude and test time show a similar trend to those of the cavitation corrosion rate.
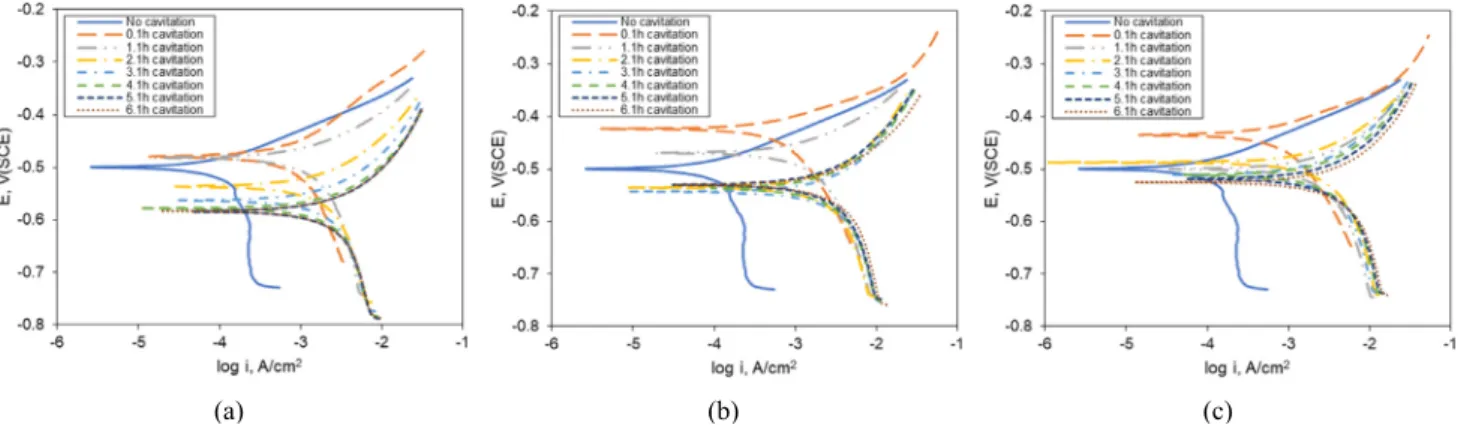
Fig. 10 shows the polarization curves obtained at each time, Fig. 11 presents the effect of cavitation time on the polarization behavior of 0.42 %C carbon steel during cav- itation corrosion test and in 3.5 % NaCl at 15 °C. The corrosion potential of carbon steel at stagnant solution was lower than those during cavitation corrosion test when the cavitation time was short(Fig. 10a and b), but regardless
(a) (b)
Fig. 6 Effect of ultrasonic amplitude on (a) the weight loss and (b) the cavitation corrosion rate of 0.42 %C carbon steel in 3.5 % NaCl at 15 °C
(a) (b)
Fig. 7 Effect of cavitation corrosion time on (a) the weight loss and (b) the cavitation corrosion rate of 0.42 %C carbon steel in 3.5 % NaCl at 15 °C.
(a) (a’) (a”)
(b) (b’) (b”)
(c) (c’) (c”)
Fig. 8 Surface appearance by 3D microscope of 0.42 %C carbon steel after cavitation corrosion test: (a) (b) (c) Ultrasonic amplitude 15 μm, (a’) (b’) (c’) Ultrasonic amplitude 50 μm, (a’’) (b’’) (c’’) Ultrasonic amplitude 85 μm, (a) (a’) (a’’) Cavitation time 2 h, (b) (b’) (b’’) Cavitation time 4 h, (c) (c’) (c’’) Cavitation time 6 h.
(a) (b)
Fig. 9 Effect of (a) ultrasonic amplitude and (b) cavitation corrosion time on the cavitation-corroded depth of 0.42 %C carbon steel in 3.5 % NaCl at 15 °C.
(a) (b) (c)
of the cavitation corrosion time, the polarization curves move towards the right direction. Fig. 11 shows that as the cavitation corrosion time increases, regardless of the ultrasonic amplitude, the polarization curves move to- wards the right direction.
4. Discussion
Generally, carbon steel suffers uniform corrosion in var- ious corrosive environments [33]. However, Fig. 3, 4, 5, and 8 show that carbon steel during cavitation corrosion test may be subjected to localized corrosion. Therefore, we compared the corrosion rate obtained between in weight loss and corroded depth.
Fig. 12 compares the cavitation corrosion rate obtained from the weight loss and the damaged depth of 0.42%C carbon steel through cavitation corrosion test. The rela- tionship between corrosion rate (Δw) by the weight loss and corrosion rate (Δt) by corroded depth is introduced as follows; Corrosion rate (Δt) = 7.3 × Corrosion rate (Δw) + 31.3. In other words, the corrosion rate obtained
by corroded depth was almost 7.3 times higher than that obtained by weight loss, and this implies carbon steel un- der cavitation condition corrodes in localized corrosion.
From the above discussion and corrosion morphologies, the corrosion steps of carbon steel at the initial stage under cavitation condition in 3.5 % NaCl can be proposed as
(d) (e) (f)
Fig. 10 Polarization curves obtained at the each time during cavitation corrosion test in 3.5% NaCl at 15 °C; (a) 0.1 h, (b) 1.1 h, (c) 2.1 h, (d) 3.1 h, (e) 4.1 h, (f) 5.1 h.
(a) (b) (c)
Fig. 11 Effect of cavitation time on the polarization behavior of 0.42 %C carbon steel during the cavitation corrosion test in 3.5
% NaCl at 15 °C; (a) Ultrasonic amplitude of 15 μm, (b) Ultrasonic amplitude of 50 μm, (c) Ultrasonic amplitude of 85 μm.
Fig. 12 Comparison of cavitation corrosion rate obtained from between the weight loss and the damaged depth of 0.42 %C carbon steel in 3.5 % NaCl at 15 °C.
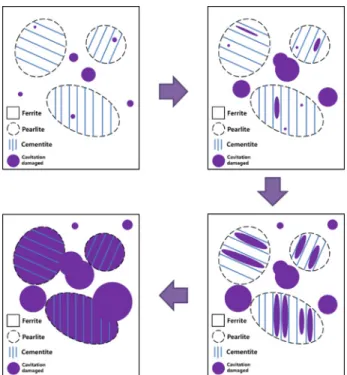
Fig. 13; Step 1- Ferrite corrodes in the ferrite phase having the pearlite and cementite remained. Step 2- Ferrite cor- rodes severely. Step 3- Enlarged ferrite corrosion. Step
4- Detachment of the ferrite and pearlite phases.
Do metals and alloys under cavitation condition erode mechanically, corrode electrochemically, or incur damage in mixed mode Fig. 14 shows the effect of (a) ~ (e) ultra- sonic amplitude and (a’) ~ (e’) cavitation time on (a) and (a’) corrosion potential, (b) and (b’) corrosion current den- sity, (c) and (c’) Tafel constant- βA, (d) and (d’) Tafel constant- βC, (e) and (e') anodic current density at -0.4 V(SCE), which are obtained from Fig. 10 and Fig. 11;
1) Corrosion potential: Increased ultrasonic amplitude increases the corrosion potential. However, corrosion potential in short-term cavitation is noble but a lon- ger cavitation decreases the corrosion potential. In the case of the initial stage of cavitation corrosion test, cavitation peening effect occurs but longer cav- itation makes the steel active, and thus decreases the corrosion potential.
2) Corrosion current density: Regardless of the ultra- sonic amplitude and cavitation time, the corrosion current density was increased. That is, cavitation ac- tually leads to increased corrosion.
3) Tafel slope: Higher ultrasonic amplitude increases the anodic Tafel slope, but decreases the cathodic Tafel slope; this means that corrosion reaction under the cavitation is controlled by the variation of catho- dic reaction. However, cavitation time did not affect Fig. 13 Cavitation corrosion steps of carbon steel in 3.5 % NaCl.
(a) (a’)
(b) (b’)
the Tafel slopes.
4) Anodic current density: Higher ultrasonic amplitude reduces the anodic current density, and this means that lower ultrasonic amplitude increases the peening effect. However, longer cavitation time increases the anodic reaction.
As reviewed above, carbon steel under a cavitation con- dition corrodes electrochemically, regardless of the level of ultrasonic amplitude. If this is true, how can we differ- entiate the two factors (electrochemical or mechanical) that affect the degradation of steel under cavitation Fig.
15 reveals the effect of ultrasonic amplitude on the rela- tionship between corrosion rate (iR) obtained from the cor- rosion current density and corrosion rate (Δw) obtained from the weight loss of 0.42 %C carbon steel during cav- itation corrosion test in 3.5% NaCl at 15 °C; For the ultra- sonic amplitude of 15 μm, Corrosion rate (Δw) = 0.462
× Corrosion rate (iR) + 2.79. For the ultrasonic amplitude of 50 μm, Corrosion rate (Δw) = 0.517 × Corrosion rate (iR) + 3.28. For the ultrasonic amplitude of 85 μm, Corrosion rate (Δw) = 3.049 × Corrosion rate (iR) -27.9.
These results imply that when the cavitation strength is relatively low, corrosion of the steel is more affected by
(c) (c’)
(d) (d’)
(e) (e’)
Fig. 14 Effect of ultrasonic amplitude and cavitation time on (a) and (a’) corrosion potential, (b) and (b’) corrosion current density, (c) and (c’) Tafel constant- βA, (d) and (d’) Tafel constant- βC, (e) and (e’) anodic current density at -0.4 V(SCE).
the electrochemical process than by the mechanical proc- ess, but when the cavitation strength is relatively high, corrosion of the steel is more affected by the mechanical process than by the electrochemical process.
Fig. 16 is redrawn from Fig. 15 and shows the relation- ship between the ultrasonic amplitude and the ratio of cav- itation corrosion rates that are obtained from the weight loss and the corrosion current density. This work defined the identical cavitation corrosion rate to mean that [(CR (△w) / CR(iR)] is equal to 1; when the ratio of less than 1, this means the electrochemical effect during the cav- itation corrosion process is higher than the mechanical effect. The ratio of higher than 1, this implies that mechan- ical effect is higher than the electrochemical effect.
Therefore, according to this definition, the ultrasonic am- plitude that shows the ratio of 1 can also be defined as the critical ultrasonic amplitude. Fig. 16, confirms that the critical ultrasonic amplitude is 53.8 μm. It is consid- ered that this value will be the criterion to understand the resistance to cavitation corrosion of metals and alloys.
5. Conclusions
In order to elucidate the effect of the cavitation strength on the electrochemical cavitation of carbon steel in 3.5
% NaCl at 15 oC, in this work, the ultrasonic peak-to-peak amplitude was controlled from (15 to 85) μm, and electro- chemical measurements were performed during the cav- itation corrosion test by an indirect cavitation method. The relationship between cavitation corrosion rate and electro- chemical properties was discussed and the following con- clusions were derived:
Corrosion steps of carbon steel at the initial stage under cavitation condition were proposed; Step 1- Ferrite cor- rodes in the ferrite and pearlite phases, and cementite remains. Step 2- Ferrite corrodes severely. Step 3- Enlarged ferrite corrosion. Step 4- Detachment of the fer- rite and pearlite phases.
Under cavitation condition, the corrosion potential, cor- rosion current density, Tafel slopes, and anodic current density at any potential vary. That is, cavitation affects the electrochemical processes, as well as the mechanical process.
The identical cavitation corrosion rate was defined as
‘The ratio of corrosion rates obtained by the weight loss and the corrosion current density’ being equal to 1, and an ultrasonic amplitude to show the ratio of 1 was also defined as the critical ultrasonic amplitude. It was con- firmed that the critical ultrasonic amplitude of 0.42 %C carbon steel is 53.8 μm, and the amplitude of less than 53.8 μm, this means that the electrochemical effect during the cavitation corrosion process is higher than the mechan- ical effect.
Acknowledgments
This work was supported by KOREA HYDRO &
NUCLEAR POWER CO., LTD (No. 2019-Technical-08).
References
1. J. A. Jeong, M. S. Kim, S. D. Yang, C. H. Hong, N.
K. Lee, and D. H. Lee, J. Kor. Soc. Mar. Eng., 42, 280 (2018).
http://dx.doi.org/10.5916/jkosme.2018.42.4.280 2. S. Y. Lee, K. H. Lee, C. U. Won, S. Na, Y. G. Yoon,
M. H. Lee, Y. H. Kim, K. M. Moon, and J. G. Kim, J. Ocean Eng. Technol., 27, 79 (2013).
https://doi.org/10.5574/KSOE.2013.27.3.079
3. J. H. Jeong, Y. H. Kim, K. M. Moon, M. H. Lee, and J. G. Kim, J. Kor. Soc. Mar. Eng., 37, 877 (2013).
https://doi.org/10.5916/jkosme.2013.37.8.877 Fig. 15 Effect of ultrasonic amplitude on the relationship between
corrosion current density and corrosion rate obtained from the weight loss of 0.42 %C carbon steel during cavitation corrosion test in 3.5% NaCl at 15 °C.
Fig. 16 Deduction of critical ultrasonic amplitude showing the identical cavitation corrosion rate, which means [(CR(△w) / CR(iR)] is equal to 1.
4. Y. Huang and D. Ji, Sensor. Actuat. B-Chem., 135, 375 (2008).
https://doi.org/10.1016/j.snb.2008.09.008 5. S. Nesic, Corros. Sci., 49, 4308 (2007).
https://doi.org/10.1016/j.corsci.2007.06.006
6. S. A. A. Buhri, D. K. Kaithari, and E. Rasu, Int. J.
Stud. Res. Technol. Manag., 4, 24 (2016).
https://doi.org/10.18510/ijsrtm.2016.421
7. L. Wang, N. Qiu, D. -H. Hellmann, and X. Zhu, J.
Mech. Sci. Technol., 30, 533 (2016).
https://doi.org/10.1007/s12206-016-0106-9
8. I. Tzanakis, L. Bolzoni, D. G. Eskin, and M. Hadfield, Metall. Mater. Trans. A, 48, 2193 (2017).
https://doi.org/10.1007/s11661-017-4004-2
9. H. Sun, J. Mech. Sci. Technol., 26, 2535(2012).
https://doi.org/10.1007/s12206-012-0633-y
10. S. B. Um, Master Thesis, p. 4, Andong National University, Gyeongbuk (2017).
11. A. Thiruvengadam, J. Basic Eng., 85, 365 (1963).
https://doi.org/10.1115/1.3656610
12. M. S. Plesset and A. T. Ellis, Wear, 1, 455 (1955).
https://doi.org/10.1016/0043-1648(58)90222-9
13. B. Vyas and C. M. Preece, Metall. Trans. A, 8, 915 (1977).
https://doi.org/10.1007/BF02661573
14. S. J. Lee and S. J. Kim, Corros. Sci. Tech., 11, 205 (2012).
https://doi.org/10.14773/cst.2012.11.5.205
15. S. J. Lee, J. H. Lee, and S. J. Kim, Corros. Sci. Tech., 14, 140 (2015).
https://doi.org/10.14773/cst.2015.14.3.140
16. ASTM G32-16, Standard Test Method for Cavitation Erosion Using Vibratory Apparatus, ASTM International, West Conshohocken, PA (2016).
http://doi.org/10.1520/G0032-16
17. K. T. Kim, H. Y. Chang, and Y. S. Kim, Corros. Sci.
Tech., 17, 310 (2018).
https://doi.org/10.14773/cst.2018.17.6.310
18. C. Haosheng, L. Jiang, C. Darong, and W. Jiadao, Wear, 265, 692 (2008).
https://doi.org/10.1016/j.wear.2007.12.011
19. C. A. Silva, I. B. Varela, F. O. Kolawole, A. P.
Tschiptschin, and Z. Panossian, Wear, 452-453, 203282 (2020).
https://doi.org/10.1016/j.wear.2020.203282
20. C. J. Lin and J. L. He, Wear, 259, 154 (2005).
https://doi.org/10.1016/j.wear.2005.02.099
21. J. T. Chang, C. H. Yeh, J. L. He, and K. C. Chen, Wear, 255, 162 (2003).
https://doi.org/10.1016/S0043-1648(03)00199-6 22. S. Z. Luo, Y. G. Zheng, M. C. Li, Z. M. Yao, and
W. Ke, Corrosion, 59, 597 (2003).
https://doi.org/10.5006/1.3277590
23. Y. Zheng, S. Luo, and W. Ke, Wear, 262, 1308 (2007).
https://doi.org/10.1016/j.wear.2007.01.006
24. W. Gou, H. Zhamg, H. Li, F. Liu, and J. Lian, Wear, 412-413, 120 (2018).
https://doi.org/10.1016/j.wear.2018.07.023
25. S. Hattori, T. Ogso, Y. Minami, and I. Yamada, Wear, 265, 1619 (2008).
https://doi.org/10.1016/j.wear.2008.03.012
26. D. Yan, J. Wang, F. Liu, and D. Chen, Wear, 303, 419 (2013).
https://doi.org/10.1016/j.wear.2013.03.024
27. F. N. da Silva, P. M. de Oliveira, N. M. da Fonseca, T. de Souza Araujo, E. T. de Carbalho Filho, J. D.
da Cunha, D. R. da Silva, and J. T. N. de Medeiros, Revista Materia, 24, e12302 (2019).
https://doi.org/10.1590/s1517-707620190001.0639 28. C. Sedano-de la Rosa, M. Vite-Torres, J. G. Godinez-
Salcedo, E. A. Gallardo-Hernandez, R. Cuamatzi- Melendez, and L. I. Farfan-Cabrera, Wear, 376-377, 549 (2017).
https://doi.org/10.1016/j.wear.2016.12.063
29. A. K. Krella, D. E. Zakrzewska, and A. Marchewicz, Wear, 452-453, 203-295 (2020).
https://doi.org/10.1016/j.wear.2020.203295
30. C. Lin, Q. Zhao, X. Zhao, and Y. Yang, Int. J.
Georesources Environ., 4, 1 (2018).
https://doi.org/10.15273/ijge.2018.01.001
31. KS D 3752, Carbon steel for machine structural use (2019).
32. S. Y. Hur, K. T. Kim, and Y. S. Kim, Corros. Sci.
Tech., 18, 129 (2019).
https://doi.org/10.14773/cst.2019.18.4.129
33. H. Y. Yang, Advanced Metallic Materials, p. 182, Munundang, Seoul, Korea (2011).
34. D. N. Staicopolus, J. Electrochem. Soc., 110, 1121 (1963).
https://doi.org/10.1149/1.2425602
35. N. Ochoa, C. Vega, N. Pebere, J. Lacaze, and J. L.
Brito, Mater. Chem. Phys., 156, 198 (2015).
https://doi.org/10.1016/j.matchemphys.2015.02.047



![Fig. 16 Deduction of critical ultrasonic amplitude showing the identical cavitation corrosion rate, which means [(CR(△w) / CR(i R )] is equal to 1.](https://thumb-ap.123doks.com/thumbv2/123dokinfo/5403422.217961/10.892.135.375.426.617/deduction-critical-ultrasonic-amplitude-showing-identical-cavitation-corrosion.webp)
