Copyright © 2014 The Korean Society for Bone and Mineral Research
This is an Open Access article distributed under the terms of the Creative Commons Attribution Non-Commercial Li- cense (http://creativecommons.org/licenses/by-nc/3.0/) which permits unrestricted non-commercial use, distribu- tion, and reproduction in any medium, provided the original work is properly cited.
pISSN 2287-6375 eISSN 2287-7029
High Dietary Sodium Intake Assessed by 24-hour Urine Specimen Increase Urinary Calcium Excretion and Bone Resorption Marker
Sun Mi Park1, Jaehwan Jee2, Ji Young Joung1, Yoon Young Cho1, Seo Young Sohn1, Sang-Man Jin1, Kyu Yeon Hur1, Jae Hyeon Kim1, Sun Wook Kim1, Jae Hoon Chung1, Moon Kyu Lee1, Yong-Ki Min1
1Division of Endocrinology and Metabolism, Department of Internal Medicine, Samsung Medical Center, Sungkyunkwan University School of Medicine, Seoul;
2Health Promotion Center, Samsung Medical Center, Seoul, Korea
Background: The average dietary sodium intake of Koreans is 2.6 times higher than the World Health Organization’s recommended amount. The effect of a diet high in sodium on the skeletal system, especially osteoporosis, has not previously been examined in Ko- rean postmenopausal women with low bone mass. We assessed the daily sodium in- take, and determined the impact of sodium intake on urinary calcium excretion and bone resorption marker. Methods: A retrospective review of medical records was per- formed for 86 postmenopausal subjects who were initially diagnosed with osteopenia or osteoporosis at the health promotion center. They were subsequently referred to the Division of Endocrinology and Metabolism between 2010 and 2013. All subjects com- pleted a modified food frequency questionnaire. Twenty-four hour urine collection for sodium, calcium and creatinine excretion, and serum C-terminal telopeptides of type I collagen (CTX-I) were also obtained. Results: The average amount of daily sodium and calcium intake were 3,466 mg and 813 mg, respectively. Average dietary sodium intake and 24-hour urinary sodium excretion showed significant positive linear correlation (r=
0.29, P=0.006). There was also a significant positive linear correlation between 24-hour urine sodium and calcium excretion (r=0.42, P<0.001); CTX-I and 24-hour urinary calci- um excretion (r=0.29, P=0.007). Conclusions: Excessive sodium intake assessed by 24- hour urine specimen is associated with high calcium excretion in urine. High calcium ex- cretion is also related to increasing bone resorption marker.
Key Words: Bone resorption marker, Dietary sodium intake, Urinary calcium excretion, Urinary sodium excretion
INTRODUCTION
The prevalence of osteoporosis among Korean women over the age of 50 has been reported at 38.7%;[1] this rate is substantively higher than that about 10%
prevalence rate reported for women over 50 years in the United States according to the 2010, 2012 National Center for Health Statistics (NCHS).[2,3] High sodium intake is recognized as a risk factor for osteoporosis because: it alters calcium me- tabolism by increasing urinary calcium excretion.[4,5] Therefore, one of the impor- tant factors leading to a high prevalence of osteoporosis in Korean women could Corresponding author
Yong-Ki Min
Division of Endocrinology and Metabolism, Department of Internal Medicine, Samsung Medical Center, Sungkyunkwan University School of Medicine, 81 Irwon-ro, Gangnam- gu, Seoul 135-710, Korea
Tel: +82-2-3410-3432 Fax: +82-2-3410-3849 E-mail: [email protected] Received: May 22, 2014 Revised: June 29, 2014 Accepted: July 3, 2014
No potential conflict of interest relevant to this article was reported.
Original Article
be excessive dietary sodium intake. In 2011, the Korea Na- tional Health and Nutrition Examination Survey (KNHANES V-2) reported that the average daily sodium intake was 6,172 mg for males and 4,172 mg per day for females in Korea.[6] The amount of daily sodium intake is much greater than that of the Americans mean consumption of approxi- mately 3,400 mg of sodium per day,[7] and it exceeds the World Health Organization (WHO)’s recommendation for adult of sodium intake less than 2,000 mg per day.[8] Salt consumption, that which exceeds physiologic need has been associated with a raft of adverse clinical outcomes in various organ systems;[9] however, there is no published data showing sodium intake with bone metabolism for the population of Korean women. The authors assessed daily sodium intake in postmenopausal Korean women with low bone mass and analyzed the association with urinary calcium excretion and bone resorption marker.
METHODS
1. SubjectsSubjects included postmenopausal women who were at least one year past menopause and were first diagnosed with osteopenia or osteoporosis by WHO criteria through the health promotion center at the Samsung Medical Cen- ter (Seoul, Korea). The subjects initially went in for a medi- cal checkup in general population; they were subsequently referred to the Division of Endocrinology and Metabolism between March 2010 and March 2013. A total of three hun- dred four subjects initially included those who completed the survey on dietary sodium and calcium intake by modi- fied food frequency questionnaire (FFQ) on the basis of the FFQ used in the KNHANES. Subjects were excluded if she used glucocorticoids, estrogen, supplemental calcium, vi- tamin D, anticonvulsant agents, diuretics. An estimated glomerular filtration rate less than 60 mL/min/1.73 m2 (by Modification of Diet in Renal Disease study equation) were also excluded from the study. After exclusion, 86 subjects who collected 24-hour urine specimen for sodium and cal- cium excretion at the outpatient department of Endocri- nology and Metabolism were reviewed and analyzed for our study. This study was approved by the Institutional Re- view Board of Samsung Medical Center (2013-07-179-001).
2. Measurements
Measurements of biomarkers of bone resorption and baseline serum electrolyte, calcium and phosphorus, cre- atinine profile were retrospectively obtained from electron- ic medical records. All patients had collected 24-hour urine samples to estimate urine sodium, calcium, and creatinine excretion. Blood samples were obtained at their first visit at the outpatient clinic of Division of Endocrinology and Metabolism. Subjects were sampled in the morning after an overnight fast exceeding 8 hours. C-terminal crosslink- ing telopeptides of type I collagen (CTX-I), a marker of bone resorption, was measured in the serum by electro- chemiluminescence immunoassay (ECLIA) (Roche Modular Analytics E170 [Roche Diagnostics, Mannheim, Germany]).
The interassay coefficient of variation for CTX-I ranged be- tween 2.6% and 2.9% depending on CTX-I level. All pa- tients underwent baseline bone mineral density (BMD) us- ing dual energy X-ray absorptiometry (DXA; GE Healthcare Lunar, Madison, WI, USA). In accordance with the WHO cri- teria, osteopenia was defined as a T-score for the lumbar spine, total hip of between -1 and -2.5, and osteoporosis was defined as T-score of less than -2.5.
1) Assessment of dietary sodium and calcium intake All subjects completed the modified FFQ based on the KNHANES (2008)[10] during a health care examination at the health promotion center. The modified FFQ is compos- ed of 71 questions; the questions assess the frequency of servings included in 11 food groups consisting of a total of 63 food items. The detailed contents of food groups and frequency of servings were the same as FFQ used in the KNHANES. “Modified FFQ” is the questionnaire format, based on FFQ, utilized in the KNHANES and modified in Samsung Medical Center to promote better understanding and easy to recall for patients of food groups and consumption fre- quency. Subjects were asked to complete the survey on di- etary intake for the previous three months. Nutritional in- take was analyzed using CAN-Pro 4.0 (Korean Nutrition So- ciety, Seoul, Korea).
Subjects were stratified into two different groups based on sodium intake: 1) low sodium intake group (<2 g/day);
and 2) high sodium intake group (≥2 g/day), based on the WHO’s recommended daily sodium intake guidelines. As urinary sodium excretion is the gold standard to evaluate actual dietary sodium intake, we also applied the same cut-
off point to evaluation of the subjects’ 24-hour urinary so- dium excretion amount.
3. Statistical analysis
Statistical analyses were performed using SPSS statistics 21.0 (SPSS, Inc. Chicago, IL, USA). Pearson’s correlation co- efficients were obtained between dietary sodium intake and 24-hour urinary sodium excretion, 24-hour urinary so- dium excretion and calcium excretion, and 24-hour urinary calcium excretion and serum CTX-I. The association of the dietary sodium intake assessed by modified FFQ and 24- hour urinary sodium excretion was analyzed using a paired t-test. The differences of the 24-hour urinary calcium ex- cretion and serum CTX-I in the sodium intake or sodium excretion group (<2 g/day vs. ≥2 g/day) were analyzed by t-tests. A P value less than 0.05 was considered to indi- cate statistical significance.
RESULTS
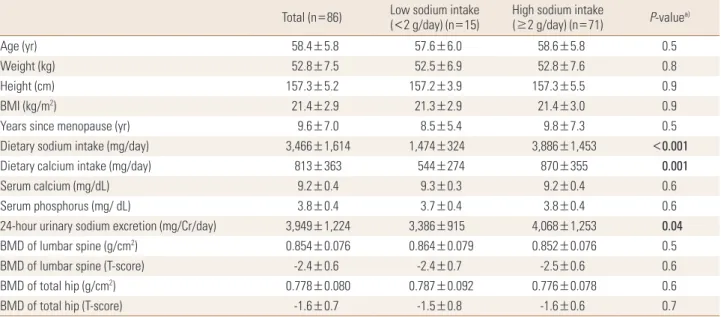
Table 1 showed the baseline characteristics of the study population based on sodium intake assessed with the mod- ified FFQ. The mean age of our study group was 58.4 years old; the average years since menopause was 9.6 years. No statistically significant differences between groups were
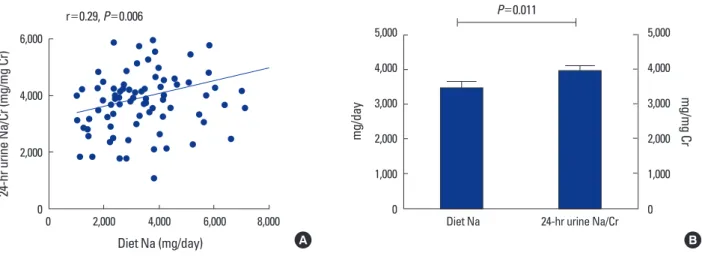
observed in the baseline parameters, except for dietary so- dium, calcium intake and 24-hour urinary sodium excre- tion. Among the 86 subjects, the average amount of daily sodium intake and calcium intake were 3,466 mg and 813 mg, respectively. Subjects’ calcium intake, as assessed by modified FFQ was significantly higher than the low sodium intake group (<2 g/day, n=15) in high sodium intake group (≥2 g/day, n=71) (Table 1). A significant positive correla- tion was found between the average dietary sodium in- take (mg/day) and 24-hour urinary sodium excretion (mg/
mg Cr) (Fig. 1A), before and after adjusted by dietary calci- um intake (mg/day). Sodium excretion assessed by 24-hour urine collection (3,949±1,224 mg) was significantly greater than dietary sodium intake amount assessed by the modi- fied FFQ used with KNHANES (3,466±1,614 mg) (Fig. 1B).
The 86 patients were stratified into two groups based on self-reported daily sodium intake: as low sodium intake group (<2 g/day) and high sodium intake group (≥2 g/
day). The sodium level group cut-off points were based on the recommended daily sodium amount suggested by the WHO.[8] We also applied the same cut-off point to evalua- tion of 24-hour urinary sodium excretion amount, as dietary sodium intake and 24-hour urinary sodium excretion amount showed a significant positive correlation (P=0.006). Based on the amounts of dietary sodium intake assessed by the
Table 1. Baseline characteristics of the low (<2 g/day) and high (≥2 g/day) sodium intake group (n=86) based on modified food frequency ques- tionnaire
Total (n=86) Low sodium intake
(<2 g/day) (n=15) High sodium intake
(≥2 g/day) (n=71) P-valuea)
Age (yr) 58.4±5.8 57.6±6.0 58.6±5.8 0.5
Weight (kg) 52.8±7.5 52.5±6.9 52.8±7.6 0.8
Height (cm) 157.3±5.2 157.2±3.9 157.3±5.5 0.9
BMI (kg/m2) 21.4±2.9 21.3±2.9 21.4±3.0 0.9
Years since menopause (yr) 9.6±7.0 8.5±5.4 9.8±7.3 0.5
Dietary sodium intake (mg/day) 3,466±1,614 1,474±324 3,886±1,453 <0.001
Dietary calcium intake (mg/day) 813±363 544±274 870±355 0.001
Serum calcium (mg/dL) 9.2±0.4 9.3±0.3 9.2±0.4 0.6
Serum phosphorus (mg/ dL) 3.8±0.4 3.7±0.4 3.8±0.4 0.6
24-hour urinary sodium excretion (mg/Cr/day) 3,949±1,224 3,386±915 4,068±1,253 0.04
BMD of lumbar spine (g/cm2) 0.854±0.076 0.864±0.079 0.852±0.076 0.5
BMD of lumbar spine (T-score) -2.4±0.6 -2.4±0.7 -2.5±0.6 0.6
BMD of total hip (g/cm2) 0.778±0.080 0.787±0.092 0.776±0.078 0.6
BMD of total hip (T-score) -1.6±0.7 -1.5±0.8 -1.6±0.6 0.7
Data presents as means±SD, statistical analysis by t-tests. Bold entries is a significant values of P<0.05.
a)P values for differences in baseline characteristics between sodium excretion groups.
BMI, body mass index; BMD, bone mineral density.
modified FFQ, low sodium intake group (<2 g/day) includ- ed 15 subjects; the high sodium intake group (≥2 g/day) included 71 subjects. However, the number of subjects in- cluded in the high sodium intake group (≥2 g/day) were greater (n=86) when stratified based on the 24-hour uri- nary sodium excretion. There were no significant differenc- es in average urinary calcium excretion according to the sodium intake group stratified by self-reported dietary so- dium intake (P=0.48). However, 24-hour urinary calcium excretion was significantly higher in the high sodium in- take group based on 24-hour urinary sodium excretion (P=
0.016) (Table 2). There was also a significant linear correla- tion between 24-hour urinary sodium excretion and 24- hour urinary calcium excretion at the level of P<0.001 (r=
0.421) (Fig. 2A). CTX-I, a biochemical marker of bone resor- ption, measured in serum were significantly associated with 24-hour urinary calcium excretion (P=0.007) (Fig. 2B). There were no statistically significant correlation found between 24-hour urinary sodium excretion and CTX-I (P=0.3, data not shown). Serum CTX-I showed a higher tendency in the
high urinary sodium excretion group (≥2 g/day); however, the relationship was not statistically significant (Table 2).
There were also no statistically significant correlation be- tween 24-hour urinary sodium excretion and BMD (lumbar spine, P=0.6; total hip, P=0.1; data not shown).
DISCUSSION
According to the 2011 KNHANES V-2,[6] the average Ko- rean adult consumes 5,158 mg sodium per day (12 g of salt), which is 2.6 times higher than the recommended amount from the WHO.[8] The health implications of a high sodium diet on an individual’s health have been highlighted and recently re-emphasized in terms of clinical impact on car- diovascular system.[9] The skeletal system is also deleteri- ously affected by the level of dietary salt levels that are com- monly consumed.[4,11]
We assessed subjects’ sodium intake by both self-report- ed sodium intake via modified FFQ and directly estimated 24-hour urine specimen for sodium excretion. These two Table 2. Average amount of 24-hour urinary calcium excretion and serum C-terminal telopeptides of type I collagen in low (<2 g/day) and high (≥2 g/day) sodium intake group based on the modified food frequency questionnaire and 24-hour urinary sodium collection
Dietary sodium 24-hour urine sodium
<2 g/day ≥2 g/day <2 g/day ≥2 g/day
24-hour urine calcium 181.2±89.4 201.8±104.6 125.9±37.3a) 207.7±104.1a)
Serum CTX-I 0.523±0.264 0.528±0.231 0.485±0.173 0.533±0.243
Data presents as means±SD or median (interquartile range).
a)P<0.05.
CTX-I, C-terminal crosslinking telopeptides of type I collagen; FFQ, food frequency questionnaire.
Fig. 1. Association of the estimated sodium intake assessed by modified food frequency questionnaire (FFQ) and 24-hour urinary sodium excre- tion. (A) Correlation between daily sodium intake (mg/day) and 24-hour urinary sodium excretion (mg/mg Cr). (B) Differences between average amount of daily sodium intake assessed by the FFQ and the 24-hour urinary sodium excretion. Na, sodium; Cr, creatinine.
6,000
4,000
2,000
0
24-hr urine Na/Cr (mg/mg Cr)
0 2,000 4,000 6,000 8,000 Diet Na (mg/day)
r=0.29, P=0.006
5,000 4,000 3,000 2,000 1,000 0
mg/day
5,000 4,000 3,000 2,000 1,000 0
mg/mg Cr
Diet Na 24-hr urine Na/Cr P=0.011
A B
measures were significantly and positively correlated, which has been proven as the quantity of sodium in a 24-hour urine specimen is almost the same as the quantity of sodi- um ingested in the absence of hydration disorders or large change of volume load.[12] Evidence suggested sodium is nearly absorbed due to the great solubility of its salts in the aqueous environment of the digestive tract. Sodium is excreted mainly with urine and sweat, and to a much small- er extent through body secretions, skin, and via feces.[13]
Excessive sodium intake increases blood osmolality and thus osmosensors in the hypothalamus sense and the in- creased water intake in response to ensuing thirst leads to the dilution of plasma sodium and provides the water vol- ume for renal sodium excretion.[13]
The coefficient of correlation calculated between dietary sodium and 24-hour urinary sodium excretion in our study (r=0.29, P=0.006) was similar to a previous study of sodi- um and calcium intake in postmenopausal women (r=0.31, P<0.001).[11] However, the average sodium excretion as- sessed by 24-hour urine collection was significantly greater than the self-reported dietary sodium intake amount as- sessed by the modified FFQ. Indeed, measuring dietary so- dium intake has some difficulties as seen in the weak cor- relation coefficient with urinary sodium excretion observed in our study and previous study.[11] Discretionary use of sodium in food preparation or cooking may vary from 25%
to 45% among individuals,[14] and subjects may find re- porting discretionary sodium use difficult to levels of varia- tion. Furthermore, the estimated sodium intake in FFQ, es- timated by personal recall, also has notable limitations: the sodium content of processed foods may vary considerably
depending on preparation, processing, and various cook- ing techniques.[11] Thus, the calculation of sodium intake amount by nutritional databases based on reported sur- veys is not likely to be accurate of actual intake. Therefore, urinary sodium excretion is used as the gold standard for estimate actual sodium intake in clinical research.
Our data showed a correlation between high sodium in- take, measured as urinary sodium excretion, and high lev- els of calcium excretion via urine. In addition, there was a significant correlation between 24-hour urinary calcium excretion and the bone resorption marker, CTX-I. Although there was no statistical significance, serum CTX-I was high- er in the high sodium intake group based on 24-hour urine sodium collection. The small number of individuals in the low sodium excretion group could introduce bias for com- paring two groups. CTX-I has previously been deemed as one of the best bone markers for fracture prediction and skeletal bone loss.[15,16] The physiologic mechanism is:
higher urinary sodium excretion induces hypercalciuria and is responsible for a significant negative change in cal- cium balance.[17-19] Moreover, increased bone turnover due to bone resorption is associated with a loss of calcium in the urine; that is, sodium takes out calcium in the urine that, in turn, stimulates bone resorption activities. Although the overall evidence on the relationship between sodium and osteoporosis is inconsistent,[4,11,20] considering the effects on bone metabolism as described above, one would expect a negative effect of sodium excretion on bone loss.
There were a number of limitations to this study. First, the study only required one 24-hour urine sample to esti- mate sodium and calcium excretion. Indeed, it is well known Fig. 2. Correlation of (A) 24-hour urinary sodium excretion and calcium excretion; (B) 24-hour urinary calcium excretion and serum C-terminal telo- peptides of type I collagen. CTX-I, C-terminal crosslinking telopeptides of type I collagen; Ca, calcium.
400
200
0
24-hr urine Ca (mg/day)
0 2,000 4,000 6,000 24-hr urine Na (mg/day)
r=0.42, P<0.001
1.0
0.5
0.0
CTX-l (ng/mL)
0 100 200 300 400 24-hr urine Ca (mg/day)
r=0.29, P=0.007
A B
that in order to accurately estimate sodium intake, multi- ple specimens of 24-hour urine sodium is needed to reflect their usual diet.[21] Our study population showed that the average amount of daily sodium and calcium intake were 3,465 mg and 814 mg, respectively. However, that of Kore- an women reported in KNHANES V-2[6] showed clear dis- tinction that 4,172 mg and 451 mg; which were higher in sodium intake and lower in calcium intake. The subjects’
characteristics that healthy selected person who under- went regular health care could be attributed to these dif- ferences.
In conclusion, excessive sodium intake assessed by 24- hour urine specimen is associated with high calcium excre- tion in the urine and high calcium excretion is related to the increasing bone resorption marker. Large prospective trials, including outcomes with serial BMDs with osteopo- rotic fracture incidences, are needed to demonstrate the effect of high sodium diet on bone health.
REFERENCES
1. Ministry of Health & Welfare, Korea Centers for Disease Con- trol and Prevention. Korea health statistics 2009: Korea na- tional health and nutrition examination survey (KNHANES IV-3). Seoul: Ministry of Health & Welfare; 2010.
2. Looker AC, Borrud LG, Dawson-Hughes B, et al. Osteopo- rosis or low bone mass at the femur neck or lumbar spine in older adults: United States, 2005–2008. 2012 [cited by 2014 May 10]. Available from: http://www.cdc.gov/nchs/
data/databriefs/db93.pdf
3. Centers for Disease Control and Prevention. Healthy peo- ple 2010: Arthritis, osteoporosis, and chronic back condi- tions. 2010 [cited by 2010 May 10]. Available from: http://
www.cdc.gov/nchs/data/hpdata2010/hp2010_final_re- view_focus_area_02.pdf
4. Nordin BE, Need AG, Morris HA, et al. The nature and sig- nificance of the relationship between urinary sodium and urinary calcium in women. J Nutr 1993;123:1615-22.
5. Zarkadas M, Gougeon-Reyburn R, Marliss EB, et al. Sodium chloride supplementation and urinary calcium excretion in postmenopausal women. Am J Clin Nutr 1989;50:1088-94.
6. Ministry of Health & Welfare, Korea Centers for Disease Con- trol and Prevention. Korea health statistics 2011: Korea na- tional health and nutrition examination survey (KNHANES
V-2). Seoul: Ministry of Health & Welfare; 2012.
7. Centers for Disease Control and Prevention. Sodium intake among adults - United States, 2005-2006. MMWR Morb Mortal Wkly Rep 2010;59:746-9.
8. World Health Organization. Guideline: Sodium intake for adults and children. Geneva, CH: World Health Organiza- tion; 2012.
9. Kotchen TA, Cowley AW, Jr., Frohlich ED. Salt in health and disease-a delicate balance. N Engl J Med 2013;368:1229-37.
10. Ministry of Health & Welfare, Korea Centers for Disease Con- trol and Prevention. Korea health statistics 2007: Korea na- tional health and nutrition examination survey (KNHANES IV-1). Seoul: Ministry of Health & Welfare; 2008.
11. Devine A, Criddle RA, Dick IM, et al. A longitudinal study of the effect of sodium and calcium intakes on regional bone density in postmenopausal women. Am J Clin Nutr 1995;62:740-5.
12. Audran M, Legrand E. Hypercalciuria. Joint Bone Spine 2000;67:509-15.
13. Kohlmeier M. Nutrient metabolism. 2nd ed. Amsterdam, NL: Academic Press; 2006.
14. National Health and Medical Research Council. Report of the working party on sodium in the Australian diet. Can- berra, AU: Australian Government Publishing Service; 1984.
15. Garnero P. Markers of bone turnover for the prediction of fracture risk. Osteoporos Int 2000;11 Suppl 6:S55-65.
16. Johnell O, Odén A, De Laet C, et al. Biochemical indices of bone turnover and the assessment of fracture probability.
Osteoporos Int 2002;13:523-6.
17. Sabto J, Powell MJ, Breidahl MJ, et al. Influence of urinary sodium on calcium excretion in normal individuals. A re- definition of hypercalciuria. Med J Aust 1984;140:354-6.
18. McParland BE, Goulding A, Campbell AJ. Dietary salt af- fects biochemical markers of resorption and formation of bone in elderly women. BMJ 1989;299:834-5.
19. Teucher B, Dainty JR, Spinks CA, et al. Sodium and bone health: impact of moderately high and low salt intakes on calcium metabolism in postmenopausal women. J Bone Miner Res 2008;23:1477-85.
20. Dawson-Hughes B, Fowler SE, Dalsky G, et al. Sodium ex- cretion influences calcium homeostasis in elderly men and women. J Nutr 1996;126:2107-12.
21. Massey LK, Whiting SJ. Dietary salt, urinary calcium, and bone loss. J Bone Miner Res 1996;11:731-6.