Background and Purpose Obstructive sleep apnea (OSA) is associated with cerebral white- matter changes (WMC), but the underlying mechanisms are not completely understood. Our aim was to identify the cardiovascular autonomic characteristics during sleep that are associated with cerebral WMC in OSA patients.
Methods We recruited subjects from our sleep-center database who underwent both poly- somnography and brain MRI within a 1-year period. Sixty patients who had OSA with WMC (OSA+WMC), 44 patients who had OSA without WMC (OSA–WMC), and 31 control subjects who had neither OSA nor WMC were analyzed. Linear and nonlinear indices of heart-rate vari- ability (HRV) were analyzed in each group according to different sleep stages and also over the entire sleeping period.
Results Among the nonlinear HRV indices, the Poincaré ratio (SD12) during the entire sleep period was significantly increased in the OSA+WMC group, even after age adjustment. Mean- while, detrended fluctuation analysis 1 during non-rapid-eye-movement sleep tended to be lowest in the OSA+WMC group. These indices were altered regardless of the presence of hyper- tension or diabetes. In the subgroup analysis of middle-aged OSA patients, approximate entropy during rapid-eye-movement sleep was significantly lower in OSA+WMC patients than in OSA–
WMC patients. Overall, the nonlinear HRV indices suggest that sympathetic activity was higher in the OSA+WMC group than in the OSA–WMC and control groups.
Conclusions Our findings suggest that dysregulation of HRV, especially overactivation of sympathetic tone, could be a pathophysiologic mechanism underlying the development of WMC in OSA patients.
Key Words obstructive sleep apnea, white-matter changes, heart-rate variability, nonlinear indices, sympathetic overactivation.
Sympathetic Overactivity Based on Heart-Rate Variability in Patients with Obstructive Sleep Apnea and
Cerebral Small-Vessel Disease
INTRODUCTION
Obstructive sleep apnea (OSA) is considered to be a significant risk factor for cardiovascu- lar morbidity1,2; the main pathophysiologic mechanisms include cardiovascular autonomic dysfunction, which is predominantly represented by sympathetic overactivation.3,4 There is growing evidence that OSA is associated with cerebral small-vessel diseases,5,6 including ce- rebral white-matter changes (WMC),7–9 which are associated with an increased risk of cere- brovascular events and vascular cognitive impairments.10 However, the mechanisms under- lying cerebral WMC in patients with OSA are not completely understood.
Heart-rate variability (HRV) has been widely analyzed as a noninvasive method for eval- uating cardiovascular autonomic conditions in various conditions.11 Among the frequency- Jangsup Moona,b,c*
Kang Hyun Choia,b* Jung Hyun Parka,d* Tae-Jin Songa Yun Seo Choib Ju-Hee Kimb Hyeon Jin Kima,b Hyang Woon Leea,b
a Departments of Neurology and
b Medical Science, Ewha Womans University School of Medicine and Ewha Medical Research Institute, Seoul, Korea
c Department of Neurology, Biomedical Research Institute, Seoul National University Hospital, Seoul, Korea
d Department of Neurology, Heavenly Hospital, Goyang, Korea
pISSN 1738-6586 / eISSN 2005-5013 / J Clin Neurol 2018;14(3):310-319 / https://doi.org/10.3988/jcn.2018.14.3.310
Received October 16, 2017 Revised January 22, 2018 Accepted January 25, 2018 Correspondence Hyang Woon Lee, MD, PhD Departments of Neurology and Medical Science,
Ewha Womans University School of Medicine and Ewha Medical Research Institute, 1071 Anyangcheon-ro,
Yangcheon-gu, Seoul 07985, Korea Tel +82-2-2650-2673
Fax +82-2-2650-5958 E-mail [email protected]
*These authors contributed equally to this work.
cc This is an Open Access article distributed under the terms of the Creative Commons Attribution Non-Com- mercial License (http://creativecommons.org/licenses/by-nc/4.0) which permits unrestricted non-commercial use, distribution, and reproduction in any medium, provided the original work is properly cited.
JCN
Open Access ORIGINAL ARTICLEMoon J et al.
JCN
perivascular spaces.6 Although WMC are suggested to be as- sociated with increased sympathetic activity, and HRV analy- ses are useful for monitoring sympathetic activities during sleep stages, HRV analyses in association with WMC during sleep—including in OSA patients—are lacking.
In the current study we assessed linear and nonlinear HRV indices according to different sleep stages in order to identify the cardiovascular autonomic characteristics during sleep that are associated with cerebral WMC in OSA.
METHODS
Patients
In total, 135 subjects were analyzed in this study (Fig. 1).
Among the patients who visited the Sleep Center of Ewha University Medical Center and underwent overnight poly- somnography (PSG) between April 2005 and May 2014, we selected 185 patients in whom 1.5- or 3.0-T brain FLAIR and T2-weighted MRI images were obtained within 1 year before or after PSG. The indication for performing PSG was the pres- domain HRV indices, the low-frequency (LF) component is
considered to represent both sympathetic and parasympa- thetic activity, while the high-frequency (HF) component is accepted as a marker of parasympathetic activity. The LF/HF ratio is considered to reflect sympathovagal balance, with a higher LF/HF indicating a predominance of sympathetic ac- tivity and a lower LF/HF suggesting parasympathetic pre- dominance.12 It is well document that sympathetic activity during rapid-eye-movement (REM) sleep is increased dur- ing physiologic sleep,13 and excessive sympathetic activity during both wakefulness and sleep has been reported in OSA patients based on HRV studies.14 It has recently been dem- onstrated that morbidity and mortality can be predicted more accurately using several nonlinear HRV indices than standard linear parameters in certain diseases, including cardiovascular disease.15,16
We previously reported a significant association between moderate-to-severe OSA and indicators of WMC, includ- ing an increased burden of white-matter hyperintensities, asymptomatic lacunar infarctions, cerebral microbleeds, or
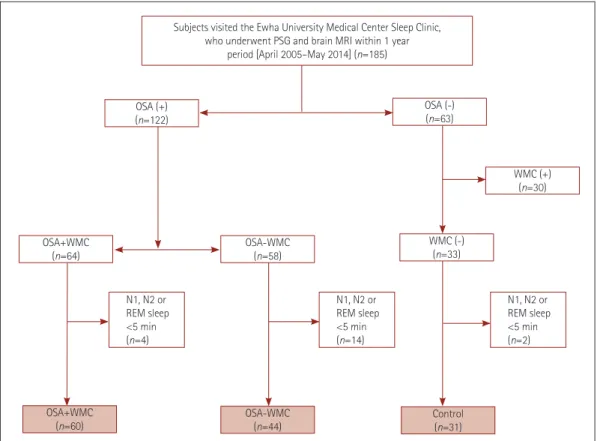
Subjects visited the Ewha University Medical Center Sleep Clinic, who underwent PSG and brain MRI within 1 year
period [April 2005–May 2014] (n=185)
OSA (+) (n=122)
OSA (-) (n=63)
WMC (+) (n=30)
OSA+WMC (n=64)
OSA+WMC
(n=60) OSA-WMC
(n=44) Control
(n=31) OSA-WMC
(n=58)
WMC (-) (n=33)
N1, N2 or REM sleep
<5 min (n=4)
N1, N2 or REM sleep
<5 min (n=14)
N1, N2 or REM sleep
<5 min (n=2)
Fig. 1. Flow chart for the selection of the study subjects. Among the patients who visited the Sleep Center of Ewha University Medical Center and underwent overnight PSG between April 2005 and May 2014, 185 patients were selected who underwent brain MRI within 1 year before or after PSG. Sixty-four of the 122 OSA patients had WMC. Thirty-three of the subjects without OSA did not have WMC. Subjects were excluded from the heart-rate variability analysis if the artifact-free and arousal-free periods of their N1, N2, or REM sleep periods were shorter than 5 min on PSG.
Finally 135 subjects were included in the current study: 60 were assigned to the OSA+WMC group, 44 to the OSA–WMC, and 31 to the control group. OSA: obstructive sleep apnea, OSA+WMC: obstructive sleep apnea with white-matter changes, OSA-WMC: obstructive sleep apnea without white-matter changes, PSG: polysomnography, REM: rapid-eye-movement, WMC: white-matter changes.
HRV and WMC in OSA
JCN
ence of at least one OSA-related symptom (e.g., witnessed loud snoring between apnea episodes, episodes of gasping for air, or choking), sleep fragmentation/insomnia, nonrefresh- ing sleep, and being in the high-risk category for OSA accord- ing to the Berlin Questionnaire, as described previously.6,17,18 Brain MRI was routinely recommended in our sleep center for evaluating underlying organic brain lesions.
Based on the obtained PSG results, 122 of the 185 patients were diagnosed with OSA, of which 64 had WMC on brain MRI. Thirty of the patients without OSA who had WMC were excluded since they were considered not appropriate for in- clusion in a control group when investigating the impact of OSA on the development of WMC. Subjects were excluded from the HRV analysis if the artifact-free and arousal-free pe- riods of their N1, N2, or REM sleep were less than 5 min on PSG. Finally, 60 patients were assigned to the OSA with WMC (OSA+WMC) group, 44 to the OSA without WMC (OSA–
WMC) group, and 31 subjects to the control group. This study was approved by the Institutional Review Board of our hospi- tal (IRB No. 11-21-016). The need to obtained informed con- sent from the patients was waived due to the retrospective de- sign and observational nature of the study.
MRI protocol and assessment of white-matter changes
The brain MRI protocol applied in this study has been de- scribed in detail previously.6,19 Brain MRI image slices were acquired using the following parameters: for FLAIR, repeti- tion time (TR)/echo time (TE)=12,000 ms/120 ms, pixel spacing=0.449 mm/0.449 mm, field of view (FOV)=183×230 mm2, and slice thickness=5 mm; for T2-weighted images, TR/TE=15,000 ms/90 ms, pixel spacing=0.240 mm/0.240 mm, FOV=176×220 mm2, and slice thickness=5 mm. The extent of WMC was determined on brain FLAIR and T2- weighted MRI images according to the modified Fazekas scoring system20: a Fazekas score of ≥1 was considered to in- dicate WMC, while score of 0 indicated the absence of WMC.
The presence of WMC was independently investigated by two neurologists (T.J.S. and J.H.P.) while they were blinded to clinical information. Consensus was reached in cases of dis- crepancy regarding the presence of WMC.
Polysomnography
PSG was performed in accordance with a previously de- scribed protocol.6,18 Overnight PSG was performed with a comprehensive device (TWin® PSG Clinical Software, Grass Technologies, West Warwick, RI, USA) at the Sleep Center of Ewha University Medical Center. The electrocardiogram (ECG) was recorded at a sampling rate of 256 Hz. The PSG data were initially scored by an experienced sleep technician
and then reviewed thoroughly by expert sleep physicians (H.W.L. and J.H.P.) following the 2014 American Academy of Sleep Medicine manual for sleep scoring and respiratory event criteria.21
Briefly, apnea episodes were defined when the airflow was reduced to ≥90% of the baseline values for at least 10 sec, and they were further classified as either the obstructive type if respiratory effort was noted on either the chest or abdomi- nal belt channel, or the central type if no respiratory effort was noted. Hypopnea episodes were defined as a ≥30% re- duction of airflow for at least 10 sec and accompanied by a decrease of ≥3% in oxygen saturation (SaO2) or arousal.
The apnea-hypopnea index (AHI) was calculated by aver- aging the total number of obstructive apnea episodes and hypopnea episodes per hour of sleep, with OSA being diag- nosed when AHI ≥5.
Assessment of heart-rate variability
For each patient we carefully selected artifact-free, apnea- free, awakening-free, 5-min ECG samples from each sleep stage: N1, N2, REM sleep, and wakefulness. ECG samples were selected from the earliest period within a particular sleep stage, and for the wakefulness period we analyzed a 5-min seg- ment at the beginning of the PSG recording that was free of ectopic beats and artifacts. For the HRV analysis according to different sleep stages, one 5-min segment was analyzed for each sleep stage, to give a total of three 5-min segments for each patient. The HRV analysis during the entire sleep peri- od utilized the entire ECG data set recorded between the on- set and the end of sleep on PSG.
The ECG data were analyzed using Kubios HRV software.12 The RR variability was analyzed in both the time and fre- quency domains. Each RR interval was calculated using Welch’s periodogram method. Mean RR intervals, the stan- dard-deviation of normal to normal RR intervals (SDNN), and the root mean square of successive differences (RMSSD) were acquired as time-domain indices. Spectral components of HRV were classified as very low frequency (VLF, <0.04 Hz), LF (0.04–0.15 Hz), and HF (0.15–0.4 Hz). LF- and HF- variability components were calculated in both power and normalized units (LFnu and HFnu, respectively). LFnu and HFnu were calculated as LFnu=LF/(total power–VLF)×100 and HFnu=HF/(total power–VLF)×100.
The nonlinear properties of HRV were analyzed using Poincaré plots, detrended fluctuation analysis (DFA), ap- proximate entropy (ApEn), and sample entropy (SampEn).
A Poincaré plot is a graphical presentation of the correlation between consecutive RR intervals, and the standard-devia- tions of the points perpendicular to and along the line of iden- tity (the line where RRj=RRj+1) are denoted by SD1 and SD2,
Moon J et al.
JCN
respectively. SD1 represents the short-term beat-to-beat vari- ability, and SD2 measures the long-term variability.12 SD12 represents the relationship between these components, which is the ratio of short-term variation to long-term variation (i.e., SD1/SD2).15,22 DFA measures correlations within the data over different time scales.23 DFA1 (α1) and DFA2 (α2) are obtained from the plot by default within ranges of 4–16 beats and 16–64 beats, which represent short-term and long-term fluctuations, respectively. For the entropy-derived measures of ApEn and SampEn, lower values of entropy reflect data that are more predictable, while more-random and complex data are described by higher values of entropy.24,25
Statistical analysis
Clinical variables were compared among the groups using
the chi-square test for categorical variables and analysis of variance (ANOVA) for continuous variables. The Tukey hon- estly significant difference (HSD) test was used for post-hoc analysis of ANOVA. HRV indices were compared among the groups using ANOVA with the post-hoc Tukey HSD test for three-group comparisons, and the independent t-test for com- parisons of control and combined OSA groups. Analysis of covariance (ANCOVA) was performed to control for the ef- fect of age on HRV, and the Bonferroni test was applied for post-hoc comparisons. In the subgroup analysis of OSA pa- tients selected by specific age ranges, the OSA+WMC and OSA–WMC groups did not conform to a normal distribu- tion, and so the Mann-Whitney test was used to compare the mean values. The statistical analyses were conducted using SPSS software version 13.0 (SPSS Inc., Chicago, IL, USA),
Table 1. Demographic characteristics and PSG findings in control subjects, patients with OSA–WMC, and patients with OSA+WMC Control (n=31) OSA–WMC (n=44) OSA+WMC (n=60) p Demographic characteristic
Age (years) 47.8±10.7 49.1±10.2 66.8±9.6 <0.001*†
Sex (male) 14 (45.2) 36 (81.8) 32 (53.3) 0.002
BMI (kg/m2) 24.0±3.3 25.9±3.2 25.3±3.2 0.047*‡
Neck circumference (cm) 36.6±3.3 39.1±3.3 37.3±3.9 0.009*†
HTN (yes) 7 (22.6) 10 (22.7) 39 (65) <0.001
Diabetes (yes) 2 (6.5) 4 (9.1) 17 (28.3) 0.007
Hyperlipidemia (yes) 2 (6.5) 5 (11.4) 8 (13.3) 0.611
Alcohol consumption (yes) 12 (38.7) 18 (40.9) 19 (31.7) 0.676
Current smoker (yes) 9 (29.0) 10 (22.7) 9 (15.0) 0.417
ESS 7.1±5.4 9.0±5.6 6.8±4.7 0.083
BDI 13.2±7.5 12.8±10.5 13.7±12.7 0.916
PSG findings
Total sleep time (min) 368.0±108.9 367.8±78.2 337.6±91.3 0.166
Sleep latency (min) 18.4±26.6 7.6±10.7 16.8±28.6 0.084
AI (n/h) 13.4±6.6 26.1±16.3 28.1±14.9 <0.001*‡
RAI (n/h) 0.2±0.4 2.6±7.0 5.0±10.8 0.032*
AHI (n/h) 1.4±1.3 23.7±19.8 31.8±20.2 <0.001*‡
REM AHI (n/h) 3.8±6.8 23.8±17.2 31.9±21.8 <0.001*‡
NREM AHI (n/h) 1.1±1.6 23.4±21.6 32.0±21.3 <0.001*‡
RDI (n/h) 3.7±13.5 27.2±22.4 31.8±19.9 <0.001*‡
Minimum SaO2 (%) 86.3±10.8 82.0±7.3 80.1±9.4 0.011*
N1 sleep (%) 22.4±11.1 28.0±16.0 32.7±16.0 0.009*
N2 sleep (%) 51.8±17.8 47.5±13.1 45.3±16.5 0.185
N3 sleep (%) 7.1±8.2 7.3±8.2 6.0±7.6 0.678
REM sleep (%) 18.0±12.0 15.6±7.0 14.2±7.0 0.129
p-values were calculated using the chi-square test for categorical variables and analysis of variance for continuous variables. Data are n (%) or mean±
standard-deviation values.
*p<0.05 between control and OSA+WMC in post-hoc Tukey test, †p<0.05 between OSA–WMC and OSA+WMC in post-hoc Turkey test, ‡p<0.05 be- tween control and OSA–WMC.
AHI: apnea-hypopnea index, AI: arousal index, BDI: Beck Depression Inventory, BMI: body mass index, ESS: excessive daytime sleepiness, HTN: hyper- tension, n/h: number per hour, NREM: non-rapid-eye-movement, OSA+WMC: obstructive sleep apnea with white-matter changes, OSA-WMC: ob- structive sleep apnea without white-matter changes, PSG: polysomnography, RAI: respiratory arousal index, RDI: respiratory disturbance index, REM:
rapid-eye-movement, SaO2: oxygen saturation.
HRV and WMC in OSA
JCN
and p<0.05 was considered statistically significant.
RESULTS
Demographic characteristics and polysomnography findings
Age, sex, and body mass index (BMI) differed among the three groups (Table 1). Patients were significantly older in the OSA+WMC group (age 66.8±9.6 years, mean±standard de- viation) than in the OSA–WMC group (age 49.1±10.2 years) and the control group (age 47.8±10.7 years). BMI was signifi- cantly lower in the control group than in either of the OSA groups. The incidence of hypertension and diabetes differed across the groups, being highest in the OSA+WMC group.
Sleep characteristics including daytime sleepiness, total sleep time, sleep latency, and percentages of time in the REM, N2, and N3 sleep periods did not differ significantly between the groups, with the exception of the percentage of N1 sleep being higher in the OSA+WMC group than in the control group (Table 1). The arousal index, AHI, REM AHI, non-REM (NREM) AHI, and respiratory disturbance index were significantly higher in both the OSA+ WMC and OSA–
WMC groups than in the control group, as expected. The mini- mum SaO2 differed significantly among the groups, with the minimum SaO2 being markedly lower in the OSA+WMC group than in the control group.
Heart-rate variability findings
Several indices in the time-domain and frequency-domain analyses of HRV differed significantly among the three groups (Table 2). Since most of the HRV parameters—including the frequency-domain indices and nonlinear indices—are sig- nificantly influenced by increasing age,26,27 and patients in the OSA+WMC group were significantly older than those in the other groups, we performed ANCOVA to control for the ef- fect of age on HRV parameters. Applying this age adjustment resulted in the differences in the time-domain and frequen- cy-domain indices no longer being significant.
In terms of nonlinear HRV indices, SD12 was significant- ly higher and DFA1 was markedly lower in the OSA+WMC group than in the OSA–WMC and control groups during NREM sleep, REM sleep, and the entire sleep period (Table 2).
ApEn was significantly lower in the OSA+WMC group during REM sleep.
When ANCOVA was performed with age controlled as a covariate, SD12 during the entire sleep period was the only HRV parameter that differed significantly among the three groups (p=0.045). However, DFA1 tended to be lowest in the OSA+WMC group during NREM sleep (p=0.051) (Table 2).
Subgroup analysis in subjects without hypertension or diabetes
In order to minimize the effect of confounding factors on HRV indices, we performed a subgroup analysis in subjects who did not have hypertension or diabetes, comprising 24, 33, and 18 subjects in the control, OSA–WMC, and OSA+WMC groups, respectively. ANCOVA was performed with age con- trolled as a covariate. SD12 during the entire sleep period dif- fered significantly among the groups, being 0.41±0.13, 0.50±
0.16, and 0.60±0.21 in the control, OSA–WMC, and OSA+WMC groups, respectively (p=0.028). DFA1 during NREM sleep was also significantly different among the groups, being 1.15±
0.37, 0.97±0.28, and 0.86±0.36 in the control, OSA–WMC, and OSA+WMC groups, respectively (p=0.025) (Table 2).
Subgroup analysis in selected age groups
Since more than two-thirds of the general population older than 65 years have WMC,28 we selected middle-aged patients (age 45–64 years) for inclusion in an additional subgroup analysis, involving 18 patients in each of the OSA–WMC and OSA+WMC groups. The mean AHI was higher than 20 in both groups, which indicates that most of these patients had moderate-to-severe OSA. The demographic characteristics and sleep study parameters did not differ significantly be- tween these two groups (Table 3).
In the HRV analysis, none of the frequency-domain indices differed between the OSA–WMC and OSA+WMC groups (data not shown). Regarding the nonlinear indices, ApEn dur- ing REM sleep was significantly lower in the OSA+WMC group (0.79±0.25) than in the OSA–WMC group (0.94±
0.23) (p=0.031) (Fig. 2A and Table 3). Receiver operating characteristics analysis was performed to assess the effec- tiveness of ApEn for differentiating OSA+WMC from OSA–
WMC. The value of 0.71 for the area under the curve indi- cated a diagnosis of OSA+WMC. When ApEn was lower than 0.85, the sensitivity, specificity, positive predictive value, and negative predictive value were 55.6, 77.8, 71.4, and 63.6%, respectively (Fig. 2B). None of the other nonlinear indices dif- fered significantly between the two groups (data not shown).
DISCUSSION
With the aim of identifying the cardiovascular autonomic characteristics associated with cerebral WMC in OSA pa- tients, we performed HRV analysis based on sleep stages ob- tained from PSG in a large number of OSA patients and con- trol subjects. The frequency-domain indices did not exhibit any meaningful differences among the study groups. The non- linear index of SD12 during the entire sleep period was in- creased in the OSA+WMC group, which was the only signif-
Moon J et al.
JCN
icant difference observed after age adjustment. Additionally, DFA1 during NREM sleep tended to be lower in the OSA+WMC group. These indices were altered regardless of the presence of hypertension or diabetes. In subgroup analy- sis of middle-aged patients (age 45–64 years) with moder- ate-to-severe OSA, ApEn during REM sleep was significant- ly lower in the OSA+WMC group than in the OSA–WMC group. Overall our findings suggest that changes in nonlinear HRV indices reflect sympathetic overactivity in the OSA+
WMC group, which might be related to the pathophysiology of WMC in OSA patients.
Changes in HRV indices according to different sleep stag-
es have been reported both in healthy subjects and in patients with OSA.13 Parasympathetic activity normally increases as a subject approaches a deeper sleep stage during NREM sleep, resulting in increases in the HF component and decreases in the LF component as well as in the LF/HF ratio. The opposite alterations occur during REM sleep and wakefulness, char- acterized by the predominance of sympathetic activity, re- sulting in increases in the LF component and LF/HF and a decreased HF component.11,13 Previous HRV analyses in OSA patients revealed an overall predominance of sympathetic activity during either wakefulness or sleep, characterized by lower total variability and increases in the LF component and Table 2. Analysis of heart-rate variability in control, OSA–WMC, and OSA+WMC groups (selected indices with significant group differences)
Control (n=31)
OSA–WMC (n=44)
OSA+WMC
(n=60) p‡ (ANOVA) p§ (ANCOVA)
Subgroup analysis (no HTN or diabetes)∥
p§ (ANCOVA) Time-domain indices (ms)
SDNN
NREM sleep (N1–N2) 43.4±23.5 60.7±52.5 85.6±104.8 0.038* 0.203 0.130
RMSSD
NREM sleep (N1–N2) 37.6±29.9 61.3±68.1 105.2±134.3 0.005* 0.177 0.117
Frequency-domain indices HF power (ms2)
NREM sleep (N1–N2) 534.8±713.7 2,442.8±9,075.4 10,365.9±22,009.0 0.006*† 0.090 0.181 LFnu
Awake 45.3±17.3 50.1±17.9 40.0±17.1 0.016† 0.271 0.629
NREM sleep (N1–N2) 51.9±24.9 50.4±20.4 38.8±21.5 0.007*† 0.065 0.157
HFnu
Awake 54.4±17.1 49.7±17.9 59.7±16.9 0.017† 0.275 0.635
NREM sleep (N1–N2) 48.0±24.8 49.5±20.3 60.9±21.4 0.007*† 0.064 0.160
Nonlinear indices (ms) Poincaré plot (SD1)
NREM sleep (N1–N2) 26.6±21.2 43.4±48.3 74.5±95.2 0.005* 0.177 0.117
Poincaré ratio (SD12)
NREM sleep (N1–N2) 0.52±0.32 0.57±0.25 0.72±0.30 0.003*† 0.167 0.140
REM sleep 0.36±0.27 0.44±0.28 0.61±0.37 0.002*† 0.305 0.479
Entire sleep period 0.44±0.18 0.51±0.16 0.60±0.19 <0.001*† 0.045 0.028
Detrended fluctuation analysis 1
NREM sleep (N1–N2) 1.07±3.39 0.93±0.31 0.81±0.33 0.003* 0.051 0.025
REM sleep 1.17±0.34 1.06±0.31 0.90±0.37 0.002* 0.238 0.352
Entire sleep period 0.93±0.17 0.87±0.14 0.80±0.18 0.002* 0.308 0.129
ApEn
REM sleep 0.90±0.22 0.90±0.22 0.78±0.27 0.018† 0.234 0.776
Data are n (%) or mean±standard-deviation values.
*p<0.05 between control vs. OSA+WMC in post-hoc Turkey test, †p<0.05 between OSA-WMC vs. OSA+WMC in post-hoc Tukey test, ‡p-values calcu- lated using ANOVA, §p-values calculated using ANCOVA with age controlled as a covariate, ∥subgroup analysis was performed in subjects who had neither hypertension nor diabetes. There were 24, 33, and 18 subjects in the control, OSA–WMC group, and OSA+WMC group, respectively.
ApEn: approximate entropy, ANCOVA: analysis of covariance, ANOVA: analysis of variance, HF: high frequency, LF: low frequency, NREM: non-rapid- eye-movement, nu: normalized unit, OSA+WMC: obstructive sleep apnea with white-matter changes, OSA-WMC: obstructive sleep apnea without white-matter changes, REM: rapid-eye-movement, RMSSD: root mean square of successive differences, SDNN: standard-deviation of normal to nor- mal RR intervals.
HRV and WMC in OSA
JCN
LF/HF, and a decrease in the HF component.4,11,24,29
Our data differed somewhat from previous findings for HRV changes in frequency-domain indices in OSA patients during sleep.30,31 The frequency-domain HRV indices did not differ among the groups in our study. Analyzing frequen- cy-domain HRV indices in OSA patients is especially chal- lenging due to the presence of repetitive apnea episodes, arousals, and leg movements, which induce biologic noise and can modify the findings of HRV analyses.11 We consider these factors to be the main reasons for the inconsistencies in findings for frequency-domain HRV indices in OSA pa- tients between previous studies,31,32 and the current study.
Nonlinear HRV indices may be superior for assessing au- tonomic cardiovascular regulation in OSA patients. Many of the heart-rate fluctuations occur over a broad frequency range, showing complex, and irregular variability. This sug- gests that the mechanisms involved in cardiovascular regu- lation occur in a nonlinear fashion over a long time period, and therefore nonlinear methods will be superior to conven- tional (linear) measurement techniques for detecting altera- tions in heart-rate dynamics.33 Several studies have shown that nonlinear indices are more effective than conventional indices for predicting the condition of the heart and the prognosis in cardiac patients.15,16,25,34 Moreover, nonlinear in- dices are known to be less affected by artifacts,23 which makes them more appropriate for use in OSA patients who intrin- sically display many artifacts on the ECG due to recurrent arousals.
SD12 during the entire sleep period was significantly in- creased and DFA1 during NREM sleep had a tendency to decrease in the OSA+WMC group after age adjustment, which together suggest the predominance of sympathetic ac- tivity in the OSA+WMC group. These alterations were con- sistently observed in patients without hypertension or diabe- tes, suggesting that our findings are not attributable solely to the presence of hypertension or diabetes. SD12 may reflect the complex nature of HRV changes since it combines two nonlinear characteristics in a single parameter: increased SD12 can reflect increased short-term beat-to-beat variabil- ity (SD1) and/or decreased long-term variability (SD2). It is meaningful that SD12 measured during the entire sleep pe- riod was significantly higher in the OSA+WMC group, be- cause assessing the ECG data during the entire sleep period can avoid selection bias when choosing ECG samples. In- creased SD12 and decreased DFA1 have been reported to be associated with mortality after myocardial infarction,15 and SD12 has been negatively correlated with DFA1 both in healthy subjects and in patients with coronary artery dis- ease.22 Increased sympathetic activity is thought to be reflect- ed in a lower DFA134; increasing the infusion doses of norepi- nephrine resulted in increased SD12 and decreased DFA1.35,36 ApEn during REM sleep was the only parameter that dif- fered significantly between the OSA+WMC and OSA–WMC groups in a subgroup analysis of middle-aged patients with moderate-to-severe OSA. ApEn reflects the randomness of HRV, with a lower ApEn indicating decreased randomness,12 Fig. 2. ApEn values during REM sleep in middle-aged OSA patients (age 45–64 years). A: ApEn values during REM sleep of each subject in the OSA–WMC group (0.94±0.23, n=18) and OSA+WMC group (0.79±0.25, n=18) (p=0.031, Mann-Whitney test). B: ROC curve analysis was per- formed for diagnosing OSA+WMC among middle-aged OSA patients. The area under the curve was 0.71. With a cutoff of ApEn <0.85, the sensi- tivity, specificity, PPV, and NPV were 55.6, 77.8, 71.4, and 63.6%, respectively. ApEn: approximate entropy, NPV: negative predictive value, OSA: ob- structive sleep apnea, OSA+WMC: obstructive sleep apnea with white-matter changes, OSA-WMC: obstructive sleep apnea without white-matter changes, PPV: positive predictive value, REM: rapid-eye-movement, ROC: receiver operating characteristics.
0 20 40 60 80 100 OSA+WMC (Age 45–64): ROC curve
Specificity (%) 100
80 60 40 20 0
Sensitivity AUC: 0.710
ApEn threshold: <0.85 - Sensitivity: 55.6%
- Specificity: 77.8%
- PPV: 71.4%
- NPV: 63.6%
B
OSA-WMC OSA+WMC Age between 45–64
ApEn (REM) 1.5
1.0
0.5
0.0
Threshold: 0.85
A
p=0.031
Value
Moon J et al.
JCN
and decreased HRV randomness is associated with simplifi- cation of cardiovascular regulation, which is observed in ag- ing and pathologic conditions.11 Patients in the OSA+WMC group demonstrated lower ApEn, which suggests a reduction of parasympathetic tone.25 A lower ApEn has been reported to be associated with postoperative ventricular dysfunction25 and poor outcome in arrhythmia patients.16 We suggest that
decreased ApEn, especially during REM sleep, is a useful mark- er for predicting WMC in OSA patients.
The identified nonlinear indices that were dysregulated in the OSA+WMC group were concordantly related to sympa- thetic overactivity and parasympathetic dysfunction, which is a well-known autonomic property of OSA. It is not yet known if increased SD12, decreased DFA1, and decreased ApEn are directly associated with the pathophysiology of ce- rebral WMC. However, we assume that sympathetic overac- tivity would play a crucial role in the development of WMC.
OSA patients experience recurrent intermittent hypoxemia with consequent sympathetic activation and marked surges in blood pressure, with each of these mechanisms possibly impairing endothelial function37 and eventually leading to cerebral WMC.38 It has been reported that sympathetic nerve terminals exist in the tunica media of human cerebral arter- ies39 and that the intracranial capillary diameter is regulated by pericyte contraction in response to noradrenergic neurotrans- mitters.40 While continuous-positive-airway-pressure treat- ment can reportedly improve linear HRV parameters,41,42 whether such treatment can normalize nonlinear indices re- mains unclear. However, we propose that these nonlinear in- dices can be used as indicators of WMC in OSA patients, and consequently may be useful when selecting OSA patients on whom to perform brain MRI. For example, the presence of WMC in middle-aged OSA patients could be predicted by ApEn during REM sleep with a moderate positive predictive value (71.4%) and specificity (77.8%).
In addition, some of the time-domain indices differed considerably in OSA+WMC patients. It is noteworthy that SDNN and RMSSD were significantly increased during NREM sleep in the OSA+WMC group (the oldest group), because both parameters are known to decrease with increasing age.27 Increased nighttime RMSSD has been reported to be inde- pendently associated with the progression of small-vessel disease.43 However, the differences in SDNN and RMSSD in the OSA+WMC group were inconsistent after age adjust- ment, and so further studies are required to clarify the asso- ciations between these parameters and cerebral WMC.
This study was subject to a few limitations. First, the base- line demographic characteristics and the prevalence of chron- ic conditions such as hypertension and diabetes differed among the included groups. Patients in the OSA+WMC group were significantly older (by a mean of almost 20 years) and had a higher prevalence of hypertension or diabetes than those in the other groups. HRV indices are significantly af- fected by age, and hypertension and diabetes may impact HRV measures.26,27 We therefore performed ANCOVA with age controlled as a covariate, and performed additional sub- group analyses in order to minimize the effect of these po- Table 3. Demographic characteristics and PSG findings in selected
middle-aged subjects (age 45–64 years) from the OSA–WMC and OSA+WMC groups
OSA–WMC (n=18)
OSA+WMC (n=18) p Demographic characteristic
Age (years) 55.3±4.0 57.6±4.9 0.068
Sex (male) 14 (77.8) 14 (77.8) 1.000
BMI (kg/m2) 25.5±3.0 26.6±2.7 0.226
Neck circumference (cm) 39.4±2.9 40.3±2.9 0.532
HTN (yes) 8 (44.4) 10 (55.6) 0.505
Diabetes (yes) 3 (16.7) 6 (33.3) 0.248 Hyperlipidemia (yes) 2 (11.1) 1 (5.6) 0.546 Alcohol consumption (yes) 8 (44.4) 9 (50.0) 0.738 Current smoker (yes) 4 (22.2) 2 (11.1) 0.371
ESS 10.2±6.2 7.3±3.8 0.126
BDI 14.2±10.1 10.1±8.8 0.204
PSG findings
Total sleep time (min) 365.3±81.4 364.6±105.9 0.650 Sleep latency (min) 10.9±14.4 7.4±9.8 0.628
AI (n/h) 24.1±15.3 26.0±14.4 0.584
RAI (n/h) 2.0±3.3 3.4±7.8 0.938
AHI (n/h) 20.9±18.0 29.3±17.6 0.064
REM AHI (n/h) 18.2±13.3 26.5±20.9 0.308 NREM AHI (n/h) 21.3±20.7 30.6±19.2 0.059
RDI (n/h) 29.1±24.5 29.1±17.8 0.501
Minimum SaO2 (%) 81.7±4.9 83.6±4.6 0.265
N1 sleep (%) 30.6±16.5 30.8±11.3 0.521
N2 sleep (%) 48.6±16.2 46.7±14.2 0.696
N3 sleep (%) 5.5±5.8 5.4±6.4 0.650
REM sleep (%) 14.8±7.5 15.1±6.5 0.938
Nonlinear index for HRV ApEn
REM sleep 0.94±0.23 0.79±0.25 0.031
p-values were calculated using the chi-square test for categorical variables and the Mann-Whitney test for continuous variables. Data are n (%) or mean±standard-deviation values.
AI: arousal index, AHI: apnea-hypopnea index, ApEn: approximate en- tropy, BDI: Beck Depression Inventory, BMI: body mass index, ESS: ex- cessive daytime sleepiness, HRV: heart-rate variability, HTN: hyperten- sion, n/h: number per hour, NREM: non-rapid-eye-movement, OSA+
WMC: obstructive sleep apnea with white-matter changes, OSA-WMC:
obstructive sleep apnea without white-matter changes, PSG: polysom- nography, RAI: respiratory arousal index, RDI: respiratory disturbance index, REM: rapid-eye-movement, SaO2: oxygen saturation.
HRV and WMC in OSA
JCN
tential confounders. Second, most of the subjects in the con- trol group had multiple sleep-related complaints, including insomnia, sleep fragmentation, snoring, nonrefreshing sleep, and so they might not have constituted a reliable control group. Third, apnea-free, artifact-free, 5-min ECG samples were selected from each sleep stage for HRV analysis, which might not represent the HRV for each sleep stage. It is known that HRV changes during REM sleep, and can begin during NREM sleep several minutes earlier than the transition to REM sleep13; also, the degree of sympathetic activation during REM sleep is affected by the previous sleep stage.32 We consider these limitations to be the main reasons for the inconsistencies between the findings for the frequency-domain HRV indices between the current study and previous studies.
In summary, certain nonlinear HRV indices were signifi- cantly altered in OSA+WMC patients, with SD12 being in- creased and DFA1 and ApEn being decreased during sleep.
In particular, an increased SD12 during the entire sleep peri- od and a decreased ApEn during REM sleep could be useful as markers for predicting cerebral WMC in OSA patients. Fu- ture work should investigate the validity of these nonlinear HRV parameters and their causal relationships with the patho- physiologic mechanisms underlying WMC.
Conflicts of Interest
The authors have no financial conflicts of interest.
Acknowledgements
This study was supported by the RP-Grant 2015 (to J.M.) and RP-Grant 2014 (to K.H.C.) of Ewha Womans University, and by Basic Science Re- search Program through the National Research Foundation of Korea fund- ed by the Ministry of Education (2014-R1A2A1A11052103 and 2017-R1A2A2 A05069647) and Ministry of Education the Korea Health Technology R&D Project through the Korea Health Industry Development Institute (KH- IDI) funded by the Ministry of Health & Welfare (HI14C1989) (to H.W.L.).
REFERENCES
1. Yaggi HK, Concato J, Kernan WN, Lichtman JH, Brass LM, Mohs- enin V. Obstructive sleep apnea as a risk factor for stroke and death.
N Engl J Med 2005;353:2034-2041.
2. Gonzaga C, Bertolami A, Bertolami M, Amodeo C, Calhoun D. Ob- structive sleep apnea, hypertension and cardiovascular diseases. J Hum Hypertens 2015;29:705-712.
3. Khoo MC, Kim TS, Berry RB. Spectral indices of cardiac autonomic function in obstructive sleep apnea. Sleep 1999;22:443-451.
4. Palma JA, Urrestarazu E, Lopez-Azcarate J, Alegre M, Fernandez S, Artieda J, et al. Increased sympathetic and decreased parasympa- thetic cardiac tone in patients with sleep related alveolar hypoventi- lation. Sleep 2013;36:933-940.
5. Eguchi K, Kario K, Hoshide S, Ishikawa J, Morinari M, Shimada K.
Nocturnal hypoxia is associated with silent cerebrovascular disease in a high-risk Japanese community-dwelling population. Am J Hyper- tens 2005;18:1489-1495.
6. Song TJ, Park JH, Choi KH, Chang Y, Moon J, Kim JH, et al. Moder- ate-to-severe obstructive sleep apnea is associated with cerebral small vessel disease. Sleep Med 2017;30:36-42.
7. Nishibayashi M, Miyamoto M, Miyamoto T, Suzuki K, Hirata K. Cor-
relation between severity of obstructive sleep apnea and prevalence of silent cerebrovascular lesions. J Clin Sleep Med 2008;4:242-247.
8. Kamba M, Inoue Y, Higami S, Suto Y, Ogawa T, Chen W. Cerebral metabolic impairment in patients with obstructive sleep apnoea: an independent association of obstructive sleep apnoea with white mat- ter change. J Neurol Neurosurg Psychiatry 2001;71:334-339.
9. Kim H, Yun CH, Thomas RJ, Lee SH, Seo HS, Cho ER, et al. Obstruc- tive sleep apnea as a risk factor for cerebral white matter change in a middle-aged and older general population. Sleep 2013;36:709-715B.
10. Pantoni L. Cerebral small vessel disease: from pathogenesis and clini- cal characteristics to therapeutic challenges. Lancet Neurol 2010;9:
689-701.
11. Tobaldini E, Nobili L, Strada S, Casali KR, Braghiroli A, Montano N.
Heart rate variability in normal and pathological sleep. Front Physiol 2013;4:294.
12. Tarvainen MP, Niskanen JP, Lipponen JA, Ranta-Aho PO, Karjalain- en PA. Kubios HRV--heart rate variability analysis software. Comput Methods Programs Biomed 2014;113:210-220.
13. Bonnet MH, Arand DL. Heart rate variability: sleep stage, time of night, and arousal influences. Electroencephalogr Clin Neurophysiol 1997;102:390-396.
14. Narkiewicz K, Pesek CA, Kato M, Phillips BG, Davison DE, Somers VK. Baroreflex control of sympathetic nerve activity and heart rate in obstructive sleep apnea. Hypertension 1998;32:1039-1043.
15. Stein PK, Domitrovich PP, Huikuri HV, Kleiger RE; Cast Investiga- tors. Traditional and nonlinear heart rate variability are each inde- pendently associated with mortality after myocardial infarction. J Cardiovasc Electrophysiol 2005;16:13-20.
16. Khan AA, Mumtahina U, Yeasmin N. Heart rate variability analysis using approximate entropy and detrended fluctuation for monitoring heart condition. Piscataway (NJ): IEEE, 2013.
17. Epstein LJ, Kristo D, Strollo PJ Jr, Friedman N, Malhotra A, Patil SP, et al. Clinical guideline for the evaluation, management and long-term care of obstructive sleep apnea in adults. J Clin Sleep Med 2009;5:263- 18. Song TJ, Park JH, Choi KH, Kim JH, Choi Y, Chang Y, et al. Is obstruc-276.
tive sleep apnea associated with the presence of intracranial cerebral atherosclerosis? Sleep Breath 2017;21:639-646.
19. Song TJ, Cho HJ, Chang Y, Youn M, Shin MJ, Jo I, et al. Low-density- lipoprotein particle size predicts a poor outcome in patients with ath- erothrombotic stroke. J Clin Neurol 2015;11:80-86.
20. Fazekas F, Chawluk JB, Alavi A, Hurtig HI, Zimmerman RA. MR sig- nal abnormalities at 1.5 T in Alzheimer's dementia and normal aging.
AJR Am J Roentgenol 1987;149:351-356.
21. Berry RB, Brooks R, Gamaldo CE, Harding SM, Lioyd RM, Marcus CL, et al. The AASM Manual for the Scoring of Sleep and Associated Events: Rules, Terminology and Technical Specifications, Version 2.1.
Darien (IL): American Academy of Sleep Medicine, 2014.
22. Hoshi RA, Pastre CM, Vanderlei LC, Godoy MF. Poincaré plot index- es of heart rate variability: relationships with other nonlinear vari- ables. Auton Neurosci 2013;177:271-274.
23. Penzel T, Kantelhardt JW, Grote L, Peter JH, Bunde A. Comparison of detrended fluctuation analysis and spectral analysis for heart rate vari- ability in sleep and sleep apnea. IEEE Trans Biomed Eng 2003;50:1143- 1151.
24. Palma JA, Iriarte J, Fernandez S, Valencia M, Alegre M, Artieda J, et al. Characterizing the phenotypes of obstructive sleep apnea: clinical, sleep, and autonomic features of obstructive sleep apnea with and without hypoxia. Clin Neurophysiol 2014;125:1783-1791.
25. Fleisher LA, Pincus SM, Rosenbaum SH. Approximate entropy of heart rate as a correlate of postoperative ventricular dysfunction. An- esthesiology 1993;78:683-692.
26. Beckers F, Verheyden B, Aubert AE. Aging and nonlinear heart rate control in a healthy population. Am J Physiol Heart Circ Physiol 2006;
290:H2560-H2570.
Moon J et al.
JCN
27. Antelmi I, de Paula RS, Shinzato AR, Peres CA, Mansur AJ, Grupi CJ.
Influence of age, gender, body mass index, and functional capacity on heart rate variability in a cohort of subjects without heart disease. Am J Cardiol 2004;93:381-385.
28. Smith EE, Saposnik G, Biessels GJ, Doubal FN, Fornage M, Gorelick PB, et al. Prevention of stroke in patients with silent cerebrovascular disease: a scientific statement for healthcare professionals from the American Heart Association/American Stroke Association. Stroke 2017;48:e44-e71.
29. Wiklund U, Olofsson BO, Franklin K, Blom H, Bjerle P, Niklasson U.
Autonomic cardiovascular regulation in patients with obstructive sleep apnoea: a study based on spectral analysis of heart rate variabili- ty. Clin Physiol 2000;20:234-241.
30. Gula LJ, Krahn AD, Skanes A, Ferguson KA, George C, Yee R, et al.
Heart rate variability in obstructive sleep apnea: a prospective study and frequency domain analysis. Ann Noninvasive Electrocardiol 2003;
8:144-149.
31. Lado MJ, Méndez AJ, Rodríguez-Liñares L, Otero A, Vila XA. Noc- turnal evolution of heart rate variability indices in sleep apnea. Com- put Biol Med 2012;42:1179-1185.
32. Busek P, Vanková J, Opavský J, Salinger J, Nevsímalová S. Spectral analysis of heart rate variability in sleep. Physiol Res 2005;54:369-376.
33. Mäkikallio TH, Tapanainen JM, Tulppo MP, Huikuri HV. Clinical ap- plicability of heart rate variability analysis by methods based on non- linear dynamics. Card Electrophysiol Rev 2002;6:250-255.
34. Jons C, Raatikainen P, Gang UJ, Huikuri HV, Joergensen RM, Johan- nesen A, et al. Autonomic dysfunction and new-onset atrial fibrilla- tion in patients with left ventricular systolic dysfunction after acute myocardial infarction: a CARISMA substudy. J Cardiovasc Electro- physiol 2010;21:983-990.
35. Tulppo MP, Mäkikallio TH, Seppänen T, Airaksinen JK, Huikuri HV.
Heart rate dynamics during accentuated sympathovagal interaction.
Am J Physiol 1998;274:H810-H816.
36. Tulppo MP, Mäkikallio TH, Seppänen T, Shoemaker K, Tutungi E, Hughson RL, et al. Effects of pharmacological adrenergic and vagal modulation on fractal heart rate dynamics. Clin Physiol 2001;21:515- 37. Kato M, Roberts-Thomson P, Phillips BG, Haynes WG, Winnicki M, 523.
Accurso V, et al. Impairment of endothelium-dependent vasodilation of resistance vessels in patients with obstructive sleep apnea. Circula- tion 2000;102:2607-2610.
38. Hoth KF, Tate DF, Poppas A, Forman DE, Gunstad J, Moser DJ, et al.
Endothelial function and white matter hyperintensities in older adults with cardiovascular disease. Stroke 2007;38:308-312.
39. Oka N, Akiguchi I, Matsubayashi K, Kameyama M, Maeda T, Kawamura J. Density of sympathetic nerve terminals in human su- perficial temporal arteries: potassium permanganate fixation and monoamine oxidase histochemistry. Stroke 1987;18:229-233.
40. Peppiatt CM, Howarth C, Mobbs P, Attwell D. Bidirectional control of CNS capillary diameter by pericytes. Nature 2006;443:700-704.
41. Limphanudom P, Chierakul N, Pinyopattarakul N, Nana A, Naruman C, Tangchityongsiva S, et al. Recovery of heart rate variability in pa- tients with moderate to severe obstructive sleep apnea after 6-month continuous positive airway pressure treatment. J Med Assoc Thai 2007;
90:1530-1535.
42. Kufoy E, Palma JA, Lopez J, Alegre M, Urrestarazu E, Artieda J, et al.
Changes in the heart rate variability in patients with obstructive sleep apnea and its response to acute CPAP treatment. PLoS One 2012;7:
e33769.
43. Yamaguchi Y, Wada M, Sato H, Nagasawa H, Koyama S, Takahashi Y, et al. Impact of nocturnal heart rate variability on cerebral small-ves- sel disease progression: a longitudinal study in community-dwelling elderly Japanese. Hypertens Res 2015;38:564-569.