INTRODUCTION
The prevalence of periodontal disease is particularly high in the adult population.1,2Periodontal disease is the main cause of tooth extraction in adults aged ≥ 40 years.3 In Korea, this disease entity occurs in 7 out of 10 adults and is known to be a chronic disease with a relatively high prevalence.4 It has recently been reported that periodontal disease affects not only oral physiological and aesthetic aspects but also systemic diseases such as cardiovascular disease, premature birth, bacterial respiratory disease and diabetes mellitus.5-7
As periodontal disease progresses, clinical attachment loss (CAL) occurs through the destruction of the periodontal lig- ament and its adjacent alveolar bone, subsequently leading to gingival recession and pathologic periodontal probing depth.8 Therefore, the degree of CAL reflects the severity of CAL and can be used as an indicator to estimate the severity of periodontal
disease. CAL, which measures the distance between the cement-enamel junction and the lowest point using a periodontal probe, is a criterion for the assessment of the severity of periodontal disease in the diagnosis.12,13
Although periodontal disease occurs primarily due to bac- teria within the gingival crevice or the periodontal pocket, it may be affected indirectly by many other risk factors occur- ring changes in the vascular system, severity of inflammato- ry reactions and systemic immunological responses.8,9Recent interest has been focused on such risk factors that affect the ini- tiation and progression of periodontal disease. Numerous risk factors have been reported in the literature: (1) fixed risk factors such as age, sex and inheritance and (2) variable risk factors such as hyperlipidemia, hypertension, smoking, dia- betes mellitus, obesity, alcohol consumption, stress, socioe- conomic status, educational level, exercise and eating habits.
It has been reported that the risk factors differ among countries
DOI:10.4047/jap.2011.3.1.25
Risk assessment for clinical attachment loss of periodontal tissue in Korean adults
Gun-Bak Rheu1a, DDS, MSD, Suk Ji2a, DDS, PhD, Jae-Jun Ryu3, DDS, PhD, Jung-Bok Lee4, PhD, Chol Shin5, MD, PhD, Jeong Yol Lee1, DDS, PhD, Jung-Bo Huh6, DDS, MSD, Sang-Wan Shin1*, DDS, PhD
1Department of Prosthodontics, Graduate School of Clinical Dentistry, 2Department of Periodontology, Anam Hospital,
3Medical College Dept. of Dentistry, 4Institute of Human Genetics, College of Medicine,
5Department of Internal Medicine, College of Medicine, Korea University, Seoul,
6Department of Prosthodontics, Graduate School of Dentistry, Pusan National University, Yangsan, Korea
aThese authors contributed equally to this work.
PURPOSE. The purpose of this study was to assess the prevalence and extent of clinical attachment loss of periodontal tissue and to find out variables related to clinical attachment loss (CAL) in Korean adults older than 40 years of age. MATERIALS AND METHODS. Data were col- lected from 2,519 subjects who were part of a cohort study conducted in Ansan city by Korea University Medical School for Korean Genome project. Age, sex, smoking, drinking, fast glucose, blood pressure, obesity and total cholesterol levels were examined. The oral exam- ination included probing pocket depth, gingival recession and CAL of Ramford's teeth. The severity of periodontitis was classified based on the mean value of CAL. The relationship between each risk factor and the severity of CAL was independently estimated using the chi-square test, the test or one-way ANOVA. Multiple regression analysis was used to determine the significance of each factor in the periodontal disease.
RESULTS. The prevalences of clinical attachment between 1 and 3 mm, between 3 and < 5 mm, and ≥ 5 mm were 80.27%, 16.75% and
< 1%, respectively. Although the univariate analysis showed age, gender, smoking, fasting glucose, blood pressure and total cholesterol lev- els were significantly related to the severity of CAL, multiple regression analysis indicated that age (P < .0001), gender (P < .0001) and smok- ing (P < .05) were only significantly related. CONCLUSION. Older age, male gender and smoking were significant risk factor for the increase of CAL, and these may be useful indicators of periodontitis high-risk groups. [J Adv Prosthodont 2011;3:25-32]
ORIGINAL ARTICLE J Adv Prosthodont 2011;3:25-32
KEY WORDS. Korean, Periodontal attachment loss, Periodontitis, Epidemiology, Risk factor
Corresponding author: Sang-Wan Shin
Dept. of Prosthodontics, Graduate School of Clinical Dentistry, Korea University 97, Gurodonggil, Guro-Gu, Seoul, 152-703, Korea
Tel. 82 2 818 6874: e-mail, [email protected]
Received February 8, 2011 / Last Revison February 21, 2011 / Accepted March 11, 2011
ⓒ 2011 The Korean Academy of Prosthodontics
This is an Open Access article distributed under the terms of the Creative Commons Attribution Non-Commercial License (http://creativecommons.org/licenses/by- nc/3.0) which permits unrestricted non-commercial use, distribution, and reproduction in any medium, provided the original work is properly cited.
*This study was supported by a grant of the Korea Centers for Disease Control and Prevention (2006-347-2400-2440-215,2007-090-091-4800-4854-300).
investigated.10,11
Recently there is an increase of the elderly population in Korea and periodontal disease has persistently increased. So, the analy- sis of the risk factors affecting CAL is necessary to understand comprehensively on oral hygiene practices in Korea and to estab- lish a long-term strategy for oral hygiene practice. There are only few studies on risk factors for periodontal disease in Korean subjects. Therefore, this study was conducted to determine direct risk factors for CAL in the Korean population. This study was carried out as a part of the Korean Genome Project of Korea University Medical School and included a cohort aged 40 years residing in the Ansan District of Kyounggido Province.
MATERIALS AND METHODS 1. Materials
The Human Genome Institute of Korea University Medical School has performed a cohort study of 5,020 adults aged 40- 69 years as a part of the Korean Genome Project by sample col- lection using telephone numbers since 2001 every 2 years. This study included 2,519 participants who underwent oral exam- ination between July 2006 (the second year of period 3) and December 2007 (the first year of period 4). To avoid confounding factors, the following participants were excluded from the study:
(1) those who underwent a chest surgery, (2) those with malignant diseases including oral cavity cancer, (3) those who underwent a cancer surgery, (4) edentulous participants and (5) those who had a loss of ≥ 3 Ramford’s teeth.
2. Methods
1) Oral examination
All measurements were made by a single dental hygienist with a dental mirror, a dental explorer and a 0.4-mm periodontal probe (Hu-friedy’s WHO-style probe, Hu-Friedy Inc, Chicago, IL, USA).
Probing pocket depth and measuring gingival recession were con- ducted at the lingual and mesial-distal sides of Ramford’s teeth (#16, #21, #24, #36, #41 and #44), and CAL was calcu- lated from these values. The mean value of clinical attachment loss was obtained and divided into 4 groups: a clinical attach- ment of <1 mm (normal group), a clinical attachment of 1 - 3 mm (mild group), a clinical attachment of 3 - 5 mm (moderate group) and a clinical attachment of ≥5 mm (severe group).
2) Questionnaire survey
Information on age, sex, smoking, alcohol consumption, pre- sent illness, past medical history and family history was col- lected from all participants. According to smoking and alco- hol consumption, the participants were categorized as never smokers or drinkers, past smokers or drinkers, and current smok- ers or drinkers.
3) Measurement of blood glucose and total cholesterol Blood glucose was measured with a fasting period of 9 to 14 hours, and 1 and 2 hours after the glucose tolerance test with an oral load of glucose (75 g). Blood total cholesterol was mea- sured with a fasting period of 8 to 14 hours.
4) Blood pressure measurement
After blood pressure was measured on both forearms in a sit- ting position, it was measured again twice on the forearm that had a higher value. After each participant was allowed to take a 5-minute rest in a supine position, blood pressure was also measured twice at intervals of 30 seconds in a sitting position.
5) Analysis of obesity using waist circumference
Waist circumference was measured 3 times at the largest dimen- sion with a rope type measurement, and the mean value of 3 times measurement was calculated.
6) Statistical analysis
Statistical analysis was performed using the 8 aforementioned risk factors as an independent variable and CAL as a depen- dent variable. All continuous data are expressed as mean ± SD, and all categorical data are expressed as a frequency or a percentage. The relationships between CAL and demo- graphic/clinical parameters or risk factors for cardiovascular disease were analyzed using the chi-square test. In univariate analysis, comparisons between demographical/clinical para- meters and the risk factors for cardiovascular disease were made using the t test or one-way ANOVA. In multiple regression analy- sis, the comparisons were made using the Scheffe′'s method.
Independent risk factors for periodontal disease were analyzed by multivariate analysis. All statistical analyses were performed using SAS v.9.13. A P value of < .05 was considered statistically significant.
RESULTS
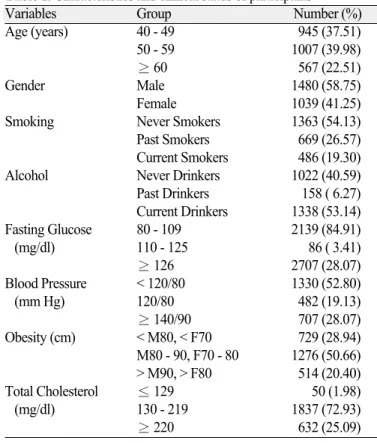
1. Demographic and clinical characteristics
Of all participants, 77.5% were aged 40 - 59 years, and 22.5%
were aged 60 - 69 years. The numbers of male and female was similar. Approximately 20% of the participants were cur- rent smokers, 53% were current drinkers, 20% were obese, and 25% to 27% were in the risk group based on blood glucose, blood pressure and blood cholesterol (Table 1).
2. Degree of CAL
The mean values of probing pocket depth and CAL were 2.02 and 2.42 mm, respectively. Of all participants, 80% belonged to the mild group, 16.75% the moderate group, and < 1% to the severe group (Table 2).
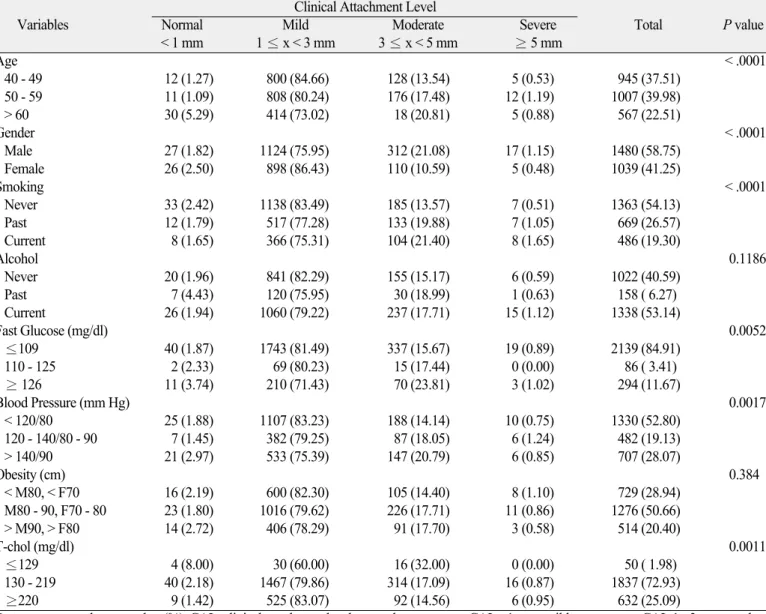
3. Correlation between the degree of CAL and risk factors
There were significant correlations between the degree of CAL and the risk factors in the mild and moderated groups. CAL was increased along the age, and the degree of CAL increased more in male group than in female group (P < .0001). CAL was increased in the sequence of never smokers, past smokers and current smokers (P < .0001). There was no significant correlation between alcohol consumption and CAL. Patients, who had high- er blood glucose and blood pressure, showed more increased CAL level (P < .005). There was no significant correlation between CAL and obesity, regardless of age. CAL was decreased as blood total cholesterol became higher (P <
.0001) (Table 3).
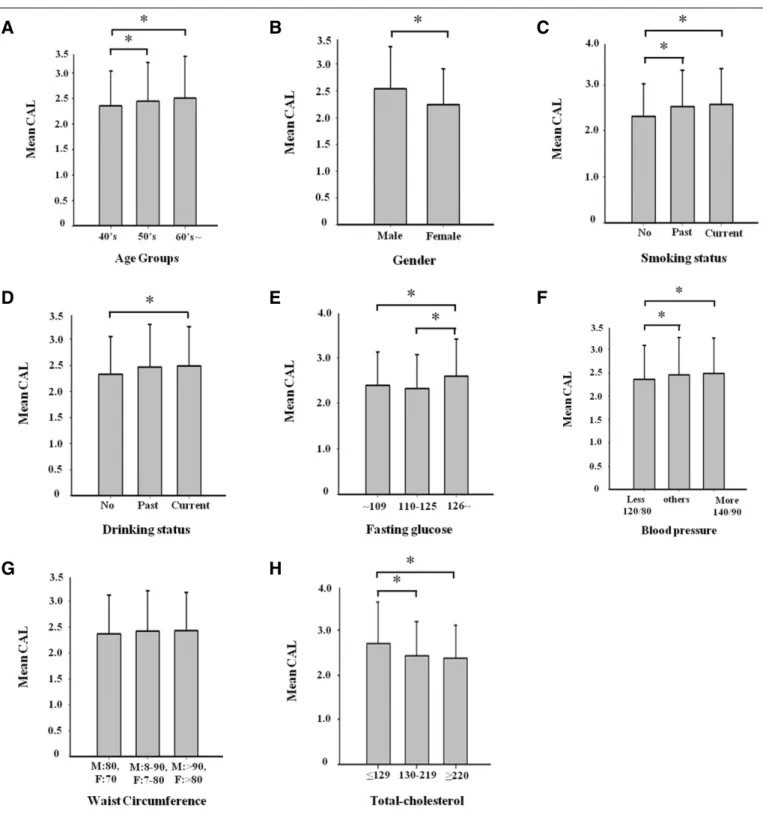
4. Analysis of risk factors for CAL
The risk factors for CAL were determined using the afore-
mentioned statistical analyses (P < .0003 for ANOVA mod- el, P < .0001 for two-sample t test). There were significant dif- ferences in CAL between the 40 - 49 and 50 - 59/60 - 69 age groups. There was a significant difference between both sex- es. For smoking, there were significant differences in CAL between never smokers and past/current smokers. For alcohol consumption, there was a significant difference in CAL between never drinkers and current drinkers. For fasting blood glucose, there were significant differences between participants with a blood glucose level of <109 mg/dl and those with ≥126 mg/dl. For blood pressure, there were significant differences between participants with a blood pressure of
≤ 120/80 mm Hg or those with 140/90 mm Hg. In the case of obesity, there was no significant different in CAL. For blood cholesterol, the participants with a blood cholesterol level of
<129 was significantly different with both those with 130 - 219 and those with >220 (Fig. 1).
A. Age (ANOVA model: P =.0003). The difference in CAL was statistically significant between the patients aged 40 - 49 and those aged 50 - 59 years or those aged 60 - 69 years (Scheffe′'s Method) B. Gender. The difference in CAL was sta- tistically significant between both sexes (2-sample t test, P <
.0001). C. Smoking (ANOVA model, P < .0001). The difference in CAL was statistically significant between never and past smok- ers and between never and current smokers (Scheffe′'s Method).
D. Drinking. ANOVA model, P < .0001). The difference in CAL was statistically significant between never/past and current drinkers (Scheffe′'s method). E. Glucose. (ANOVA model, P
< .0001). The difference in CAL was statistically signifi- cant between the participants with a blood glucose level of ≥ 126 mg/dl and those with ≤109 mg/dl or those with 110-125 mg/dl (Scheffe′'s Method). F. Blood pressure. (ANOVA model, P < .0003). The difference in CAL was statistically significant between the participants with a blood pressure of <120/80 mm Hg and those with 120/80 - 139/89 or those with ≥140/90 mm Hg (Scheffe′'s Method). G. Obesity. The difference in CAL was not statistically significant between the 3 groups (Scheffe′'s Method) H. Total-cholesterol. (ANOVA model, P < .0003). The difference in CAL was statistically significant between the par- ticipants with a blood total cholesterol level of <130 mg/dl and those with 130 - 219 mg/dl or those with ≥220 mg/dl (Scheffe′'s Method).
Table 1. Characteristics and clinical status of participants
Variables Group Number (%)
Age (years) 40 - 49 945 (37.51)
50 - 59 1007 (39.98)
≥ 60 567 (22.51)
Gender Male 1480 (58.75)
Female 1039 (41.25)
Smoking Never Smokers 1363 (54.13)
Past Smokers 669 (26.57)
Current Smokers 486 (19.30)
Alcohol Never Drinkers 1022 (40.59)
Past Drinkers 158 ( 6.27) Current Drinkers 1338 (53.14)
Fasting Glucose 80 - 109 2139 (84.91)
(mg/dl) 110 - 125 86 ( 3.41)
≥ 126 2707 (28.07)
Blood Pressure < 120/80 1330 (52.80)
(mm Hg) 120/80 482 (19.13)
≥ 140/90 707 (28.07)
Obesity (cm) < M80, < F70 729 (28.94) M80 - 90, F70 - 80 1276 (50.66)
> M90, > F80 514 (20.40)
Total Cholesterol ≤ 129 50 (1.98)
(mg/dl) 130 - 219 1837 (72.93)
≥ 220 632 (25.09)
Table 2. Periodontal status of participants
Total Normal Mild Moderate Severe
< 1 mm 1 mm ≤ x < 3 mm 3 mm ≤ x < 5 mm ≥ 5 mm
Male 1480 27 (1.82) 1124 (75.95) 312 (21.08) 17 (1.15)
Female 1039 26 (2.50) 898 (86.43) 110 (10.59) 5 (0.48)
Total 2519 53 (2.10) 2022 (80.27) 422 (16.75) 22 (0.87)
5. Multiple regression analysis of the correlations between mean CAL and risk factors
In univariate analysis, age, smoking and sex were significantly correlated with the mean value of CAL, but blood pressure, blood total cholesterol, obesity and drinking were not. Among sig- nificant factors, age showed a regression coefficient of 0.008, and CAL was increased by 0.008 per year after 40 years of age.
As for sex, CAL tended to be 0.272 greater in male group than in female group when other factors were similar. In the case of smoking, Current smokers had significant difference in CAL with both past smokers and never smokers, and CAL was increased by 0.083 in current smokers. It is well known that blood glucose is significantly correlated with obesity, thus sta- tistical analyses were performed after blood glucose was excluded to avoid a problem of multicollinearity, in this study (Table 4).
Table 3. Correlations between the degrees of CAL and risk factors
Clinical Attachment Level
Variables Normal Mild Moderate Severe Total P value
< 1 mm 1 ≤ x < 3 mm 3 ≤ x < 5 mm ≥ 5 mm
Age < .0001
40 - 49 12 (1.27) 800 (84.66) 128 (13.54) 5 (0.53) 945 (37.51)
50 - 59 11 (1.09) 808 (80.24) 176 (17.48) 12 (1.19) 1007 (39.98)
> 60 30 (5.29) 414 (73.02) 18 (20.81) 5 (0.88) 567 (22.51)
Gender < .0001
Male 27 (1.82) 1124 (75.95) 312 (21.08) 17 (1.15) 1480 (58.75)
Female 26 (2.50) 898 (86.43) 110 (10.59) 5 (0.48) 1039 (41.25)
Smoking < .0001
Never 33 (2.42) 1138 (83.49) 185 (13.57) 7 (0.51) 1363 (54.13)
Past 12 (1.79) 517 (77.28) 133 (19.88) 7 (1.05) 669 (26.57)
Current 8 (1.65) 366 (75.31) 104 (21.40) 8 (1.65) 486 (19.30)
Alcohol 0.1186
Never 20 (1.96) 841 (82.29) 155 (15.17) 6 (0.59) 1022 (40.59)
Past 7 (4.43) 120 (75.95) 30 (18.99) 1 (0.63) 158 ( 6.27)
Current 26 (1.94) 1060 (79.22) 237 (17.71) 15 (1.12) 1338 (53.14)
Fast Glucose (mg/dl) 0.0052
≤109 40 (1.87) 1743 (81.49) 337 (15.67) 19 (0.89) 2139 (84.91)
110 - 125 2 (2.33) 69 (80.23) 15 (17.44) 0 (0.00) 86 ( 3.41)
≥ 126 11 (3.74) 210 (71.43) 70 (23.81) 3 (1.02) 294 (11.67)
Blood Pressure (mm Hg) 0.0017
< 120/80 25 (1.88) 1107 (83.23) 188 (14.14) 10 (0.75) 1330 (52.80)
120 - 140/80 - 90 7 (1.45) 382 (79.25) 87 (18.05) 6 (1.24) 482 (19.13)
> 140/90 21 (2.97) 533 (75.39) 147 (20.79) 6 (0.85) 707 (28.07)
Obesity (cm) 0.384
< M80, < F70 16 (2.19) 600 (82.30) 105 (14.40) 8 (1.10) 729 (28.94)
M80 - 90, F70 - 80 23 (1.80) 1016 (79.62) 226 (17.71) 11 (0.86) 1276 (50.66)
> M90, > F80 14 (2.72) 406 (78.29) 91 (17.70) 3 (0.58) 514 (20.40)
T-chol (mg/dl) 0.0011
≤129 4 (8.00) 30 (60.00) 16 (32.00) 0 (0.00) 50 ( 1.98)
130 - 219 40 (2.18) 1467 (79.86) 314 (17.09) 16 (0.87) 1837 (72.93)
≥220 9 (1.42) 525 (83.07) 92 (14.56) 6 (0.95) 632 (25.09)
Data are presented as a number (%). CAL, clinical attachment level; normal group, mean CAL< 1 mm; mild group, mean CAL 1 - 3 mm; moderate group, mean CAL 3 - 5 mm; severe group, mean CAL > 5 mm.
Table 4. Multiple regression analysis of the associations between risk factors and CAL
Multiple regression Regression SE of
model coefficient regression P value
coefficient
Intercept 2.093 0.142 < .0001
Age (years) 0.008 0.002 < .0001
T-cholesterol (mg/dl) -0.001 < .000 .1312
Blood pressure (mmHg) 0.03 0.018 .1013
Obesity (cm) 0.035 0.022 .1155
Smoking 0.083 0.041 .0442*
Drinking 0.017 0.033 .6073
Gender -0.272 0.035 < .0001
(male = 0, female = 1)
Female was regarded as 1, and male gender as 0; smoking was regard- ed as smoking (1) or non-smoking (0); drinking was regarded as drink- ing (1) or non-drinking (0). *P < .05
Fig. 1. Correlations between degrees of CAL (mm) and risk factors. A: Age (ANOVA model: P = .0003). The difference in CAL was statistically sig- nificant between the patients aged 40 - 49 and those aged 50 - 59 years or those aged 60 - 69 years (Scheffe′'s method), B: Gender. The difference in CAL was statistically significant between both sexes (2-sample t test, P < .0001), C: Smoking (ANOVA model, P < .0001). The difference in CAL was statistically significant between never and past smokers and between never and current smokers (Scheffe′'s method), D: Drinking. ANOVA mod- el, P < .0001). The difference in CAL was statistically significant between never/past and current drinkers (Scheffe′'s method), E: Glucose. (ANOVA model, P < .0001). The difference in CAL was statistically significant between the participants with a blood glucose level of ≥126 mg/dl and those with ≤109 mg/dl or those with 110 - 125 mg/dl (Scheffe′'s method): F, Blood pressure. (ANOVA model, P < .0003). The difference in CAL was sta- tistically significant between the participants with a blood pressure of < 120/80 mm Hg and those with 120/80 -139/89 or those with ≥140/90 mm Hg (Scheffe′'s method). G. Obesity. The difference in CAL was not statistically significant between the 3 groups (Scheffe′'s method), H: Total-cholesterol.
(ANOVA model, P < .0003). The difference in CAL was statistically significant between the participants with a blood total cholesterol level of < 130 mg/dl and those with 130 - 219 mg/dl or those with ≥ 220 mg/dl (Scheffe′'s method).
A B C
D E
G H
F
DISCUSSION
The aims of this study were to evaluate the severity of CAL and to determine risk factors for CAL in Korean adults aged ≥40 years. In this study, 80.27% of the participants belonged to the mild group, 16.75% to the moderate group, and
< 1% to the severe group. Among the factors examined, CAL was significantly correlated with age (P < .0001), sex (P
< .0001) and smoking (P < .05). Aging, male, past smoking and current smoking were significantly high risk factor for CAL.
In univariate analysis, blood glucose, blood pressure and blood total cholesterol were significantly correlated with CAL.
CAL in this study was lower than in previous studies con- ducted in the United States and European countries. An epi- demiological study of periodontal disease in Pomerania, Germany reported that 89.7% of the total study subjects had CAL ≥ 3 mm.11Morris et al.14found in a study with subjects aged 20 to 65 years that 43% had CAL ≥ 4 mm and 8% had CAL ≥ 6 mm. Dye et al.15found in a study conducted in the United States that CAL ≥ 4 mm occurred in 10.4% of the study subjects in the 14 - 20 age group, 6.7% in the 20 - 34 age group, and 13.2% in the 50 - 64 age group, suggesting an increasing tendency with age. They also stated that CAL ≥3 mm occurred in 32.7% of the study subjects, and CAL ≥ 5 mm in 9.2%. An epidemiological study conducted with French adults aged 35 - 64 years reported that CAL ≥ 5 mm occurred in 46.68%.16 Theses results are remarkably different from ours. The differences may be explained as follows. First, in our study, we performed anthropometric measurements, routine blood tests and oral examination on subjects who regularly visit our hospital for health screening and are much concerned about their health. For this reason, they had performed appropriate den- tal care, and this seemed to have lowered the incidence of CAL.
Second, in our study, gingival recession and periodontal probing depth were measured by a single oral hygienist with only 3-year experience. For this reason, there may be errors in the measurement of periodontal probing depth. It has been shown that more inaccurate and lower periodontal probing depth is measured by inexperienced examiners compared to experts.17 Third, considering that periodontal destruction is not evenly distributed throughout the entire teeth and is site specific,18our results do not represent the CAL of the entire teeth, because only Ramford’s teeth were evaluated in our study. It has been demonstrated that CAL is lesser in values measured in a small number of teeth than in those measured in the entire teeth.19,20
In our study, fixed risk factors such as sex and age affected CAL the most significantly, followed by smoking among variable risk factors. A plausible explanation for this may be that numerous secondary factors related to age and sex affect CAL.21It has been documented that poorer oral hygiene with
increasing age is related to an increase of exposure time to causative diseases and an increase in aging-related factors.22 In our study, there were significant differences in CAL between the 40 - 49 and 50 - 59 age groups and between the 40 - 49 and 60 - 69 age groups but no significant difference between the 50 - 59 and 60 - 69 age groups, suggesting that CAL occurs remarkably in the 40 - 49 age group. Genco23 has shown that since CAL is caused by accumulation of destruc- tion of periodontal tissue rather than by its increased destruc- tion, and age itself does not act as a risk factor. In our study, males showed higher CAL than females, which is similar to the results of previous studies.10,24Albandar10reported that the prevalence of periodontal proving depth ≥3 mm was 1.3 times higher in males and that ≥ 5 mm was 1.7 times higher in males.
These results may be explained by the facts that males have poor- er oral hygiene practices than females25and access to dental care is different between both sexes.26The correlation between smok- ing and periodontal disease has been studied since the middle of the last century.27Numerous epidemiologic studies have report- ed that smoking is a major risk factor for periodontal disease.28 However, there have been a few studies on Korean. Our cohort study in the Ansan District of Kyounggido Province found that smoking is closely related to CAL. It seems likely that smok- ing increases the population of periodontal pathogens within the bacterial membrane29or that it provokes periodontitis by affecting host immune responses.27
Preshaw et al.30have demonstrated that refractory diabetes mellitus can cause CAL and the resolution of periodontal disease may improve clinical symptoms of diabetes mellitus, suggesting that there is a cross-susceptibility between periodontal disease and diabetes mellitus. It has been shown that diabetes mellitus increases the susceptibility to inflammatory tissue destruc- tion and leads to CAL by reducing neutrophil functions or by accelerating the synthesis of advanced glycosylation end products.31 In our study, there was an inverse correlation between CAL and blood total cholesterol unlike other risk fac- tors. There was a significant difference in CAL between subjects with blood total cholesterol ≤ 129 mg/dl (2%) and those with ≥130 mg/dl (98%). CAL tended to decrease as blood total cholesterol increased. Considering that participants with blood cholesterol ≤129 mg/dl and the upper 2% of the par- ticipants with blood total cholesterol ≥ 130 mg/dl had systemic disease or nutritional disorders associated with poor oral hygiene, it was estimated that there was a U-type correlation between blood total cholesterol and CAL. Further studies with lipoproteins, including LDL, HDL and neutral fat, and oth- er risk factors, such as dietary life, are needed to confirm these results.
Perlstein and Bissada32have indicated that obesity acts as a risk factor for periodontal disease. Thereafter, many studies in Japan and the United States have reported that periodontal dis- ease is significantly related to obesity.33,34Although the mech-
anism of the relationship has not yet been elucidated, it has been proposed that various cytokines secreted from mast cells, including tumor necrosis factor-α(TNF-α), and their metabo- lites produces inflammatory reactions of periodontal tissue and thus increase susceptibility to tissue destruction, and that plasminogen activator-1 secreted from mast cells reduces blood supply to periodontal tissue, subsequently facilitating tis- sue destruction.35However, in our study, there was no significant correlation between CAL and waist circumference. Since most of the previous studies investigated the correlation between CAL and obesity in terms of body mass index (BMI),33,35their results are difficult to compare with ours. A recent study with adults in Jordan has reported that there is a significant correlation between CAL and waist circumference with cut- off values of 88 cm for females and 102 cm for males.36This result is inconsistent with ours probably because we used different cutoff values.
CONCLUSION
It has been suggested that periodontitis is related to ather- osclerotic cardiovascular disease.5Age, sex, smoking, blood pressure and blood glucose, which were identified as risk fac- tors for periodontal disease in our study, may also act as risk factors for cardiovascular disease. If the aforementioned risk factors coexist with periodontitis, then the risk for cardiovascular disease will further increase. Therefore, the prevention of periodontitis as well as control of smoking, blood pressure and blood glucose will help prevent both periodontal disease and cardiovascular disease.
REFERENCES
1. Bouchard P, Boutouyrie P, Mattout C, Bourgeois D. Risk as- sessment for severe clinical attachment loss in an adult population.
J Periodontol 2006;77:479-89.
2. Papapanou PN. Epidemiology of periodontal diseases: an update.
J Int Acad Periodontol 1999;1:110-6.
3. Reich E, Hiller KA. Reasons for tooth extraction in the western states of Germany. Community Dent Oral Epidemiol 1993;21:379- 83.
4. Ministry of Helath & Welfare. Korea Centers for Disease Control and Prevention. 2007 Statistics of National Health 2008. p. 66.
5. Southerland JH, Taylor GW, Moss K, Beck JD, Offenbacher S.
Commonality in chronic inflammatory diseases: periodonti- tis, diabetes, and coronary artery disease. Periodontol 2000 2006;40:130-43.
6. Kinane D, Bouchard P; Group E of European Workshop on Periodontology. Periodontal diseases and health: Consensus Report of the Sixth European Workshop on Periodontology. J Clin Periodontol 2008;35:333-7.
7. Raghavendran K, Mylotte JM, Scannapieco FA. Nursing home- associated pneumonia, hospital-acquired pneumonia and ven- tilator-associated pneumonia: the contribution of dental biofilms and periodontal inflammation. Periodontol 2000 2007;44:164- 77.
8. Kinane DF. Causation and pathogenesis of periodontal dis-
ease. Periodontol 2000 2001;25:8-20.
9. Nunn ME. Understanding the etiology of periodontitis: an overview of periodontal risk factors. Periodontol 2000 2003;32:11- 23.
10. Albandar JM. Global risk factors and risk indicators for periodontal diseases. Periodontol 2000 2002;29:177-206.
11. Holtfreter B, Schwahn C, Biffar R, Kocher T. Epidemiology of periodontal diseases in the Study of Health in Pomerania. J Clin Periodontol 2009;36:114-23.
12. Baelum V, Manji F, Wanzala P, Fejerskov O. Relationship between CPITN and periodontal attachment loss findings in an adult population. J Clin Periodontol 1995;22:146-52.
13. Dye BA, Selwitz RH. The relationship between selected mea- sures of periodontal status and demographic and behavioural risk factors. J Clin Periodontol 2005;32:798-808.
14. Morris AJ, Steele J, White DA. The oral cleanliness and peri- odontal health of UK adults in 1998. Br Dent J 2001;191:186- 92.
15. Dye BA, Tan S, Smith V, Lewis BG, Barker LK, Thornton-Evans G, Eke PI, Beltra′n-Aguilar ED, Horowitz AM, Li CH. Trends in oral health status: United States, 1988-1994 and 1999-2004.
Vital Health Stat 2007;11:1-92.
16. Bourgeois D, Bouchard P, Mattout C. Epidemiology of periodontal status in dentate adults in France, 2002-2003. J Periodontal Res 2007;42:219-27.
17. Seabra RC, Costa FO, Costa JE, Van Dyke T, Soares RV.
Impact of clinical experience on the accuracy of probing depth measurements. Quintessence Int 2008;39:559-65.
18. Papapanou PN, Wennstro¨m JL, Gro¨ndahl K. Periodontal status in relation to age and tooth type. A cross-sectional radiographic study. J Clin Periodontol 1988;15:469-78.
19. Kingman A, Susin C, Albandar JM. Effect of partial recording protocols on severity estimates of periodontal disease. J Clin Periodontol 2008;35:659-67.
20. Beck JD, Caplan DJ, Preisser JS, Moss K. Reducing the bias of probing depth and attachment level estimates using random par- tial-mouth recording. Community Dent Oral Epidemiol 2006;34:1- 10.
21. Van Dyke TE, Sheilesh D. Risk factors for periodontitis. J Int Acad Periodontol 2005;7:3-7.
22. Papapanou PN, Lindhe J, Sterrett JD, Eneroth L. Considerations on the contribution of ageing to loss of periodontal tissue sup- port. J Clin Periodontol 1991;18:611-5.
23. Genco RJ. Current view of risk factors for periodontal dis- eases. J Periodontol 1996;67:1041-9.
24. Susin C, Dalla Vecchia CF, Oppermann RV, Haugejorden O, Albandar JM. Periodontal attachment loss in an urban popula- tion of Brazilian adults: effect of demographic, behavioral, and environmental risk indicators. J Periodontol 2004;75:1033- 41.
25. Christensen LB, Petersen PE, Krustrup U, Kj�ller M. Self-re- ported oral hygiene practices among adults in Denmark.
Community Dent Health 2003;20:229-35.
26. Roberts-Thomson KF, Stewart JF. Access to dental care by young South Australian adults. Aust Dent J 2003;48:169-74.
27. Palmer RM, Wilson RF, Hasan AS, Scott DA. Mechanisms of action of environmental factors-tobacco smoking. J Clin Periodontol 2005;32:180-95.
28. Borrell LN, Papapanou PN. Analytical epidemiology of peri- odontitis. J Clin Periodontol 2005;32:132-58.
29. van Winkelhoff AJ, Bosch-Tijhof CJ, Winkel EG, van der Reijden WA. Smoking affects the subgingival microflora in pe- riodontitis. J Periodontol 2001;72:666-71.
30. Preshaw PM, Foster N, Taylor JJ. Cross-susceptibility be- tween periodontal disease and type 2 diabetes mellitus: an im- munobiological perspective. Periodontol 2000 2007;45:138-57.
31. Nishimura F, Iwamoto Y, Soga Y. The periodontal host response with diabetes. Periodontol 2000 2007;43:245-53.
32. Perlstein MI, Bissada NF. Influence of obesity and hypertension on the severity of periodontitis in rats. Oral Surg Oral Med Oral Pathol 1977;43:707-19.
33. Saito T, Shimazaki Y, Koga T, Tsuzuki M, Ohshima A.
Relationship between upper body obesity and periodontitis. J Dent Res 2001;80:1631-6.
34. Reeves AF, Rees JM, Schiff M, Hujoel P. Total body weight and waist circumference associated with chronic periodontitis
among adolescents in the United States. Arch Pediatr Adolesc Med 2006;160:894-9.
35. Saito T, Shimazaki Y. Metabolic disorders related to obesity and periodontal disease. Periodontol 2000 2007;43:254-66.
36. Khader YS, Bawadi HA, Haroun TF, Alomari M, Tayyem RF. The association between periodontal disease and obesity among adults in Jordan. J Clin Periodontol 2009;36:18-24.