Sacral tumors include primary bone tumors, sacral canal tumors and, most commonly, metastases. The most common primary malignant bone tumor is chordo- ma, and the second most common is giant cell tumor.
The presence of multiple lesions involving the sacrum and other bones suggests metastasis or multiple myelo- ma. Although the imaging findings of sacral tumors are nonspecific, a patient’s age and sex, and specific find- ings such as calcification or fluid-fluid levels, can help radiologists determine the differential diagnosis. The imaging findings may overlap, however, in which case the final diagnosis can be determined by biopsy. We il- lustrate the imaging findings of primary sacral tumors, emphasizing the MRI findings.
Benign Bone Tumors
Giant Cell Tumor
Giant cell tumor is the second most common primary sacral tumor. Its peak incidence is during the 2 nd-4th decades of life, and there is female predominance (1 4).
Sacral giant cell tumors are frequently eccentric and originate in anterior spinal elements. They are generally found in a subchondral location in both long and flat bones, and this may lead to transarticular spread (3, 5).
Typically, the tumor is a purely lytic lesion without mar- ginal sclerosis or tumor matrix calcification. Due to the presence of necrosis and hemorrhage, heterogeneous in- termediate signal intensity is seen at both T1-and T2- weighted MR imaging (3) (Fig. 1).
Aneurysmal Bone Cyst
Aneurysmal bone cysts are expansile lesions with multiloculated blood-filled sacs. Their incidence peaks during the second decade of life, and there is slight fe- male predominance (4). They may result from trauma
Imaging Findings of Sacral Tumors
1Seung Ho Kim, M.D., Sung Hwan Hong, M.D., Ja-Young Choi, M.D.,
Sung Hye Koh, M.D., Hye Won Chung, M.D., Jung-Ah Choi, M.D., Heung Sik Kang, M.D.
The various pathologic conditions detected at CT and MRI and subsumed by the term “sacral tumor” include primary bone tumors, sacral canal tumors and metastases.
Among these, metastases are much more common than primary bone tumors, of which chordoma is the most common. Although the imaging findings of sacral tumors are nonspecific, a patient’s age and sex, and specific findings such as calcification or fluid-fluid levels, can help radiologists in their differential diagnosis. We describe the imaging findings of primary sacral tumors, emphasizing the MRI findings.
Index words :Sacrum, neoplasms Neoplasms
Magnetic resonance (MR)
1Department of Radiology, Seoul National University College of Medicine Received July 16, 2003 ; Accepted September 29, 2003
Address reprint requests to : Heung Sik Kang, M.D., Department of Radiology, Seoul National University Bundang Hospital,
300 Gumidong, Bundanggu, Kyunggido Sungnamsi 463-707, Korea.
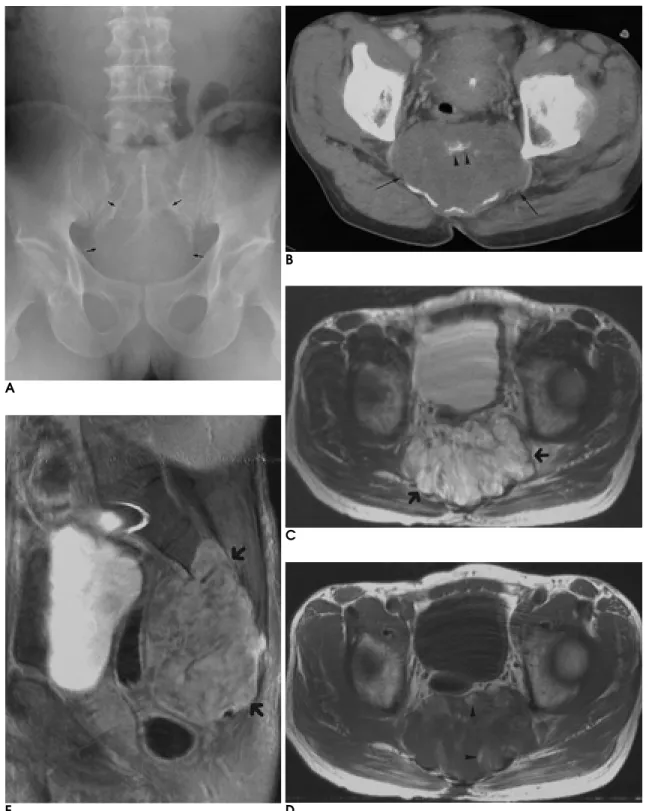
A
B
E
C
D Fig. 1. A 31-year-old woman with sacral giant cell tumor.
A. Anteroposterior radiograph shows ill-defined subtle osteolytic lesion in the upper sacrum (arrows).
B. Contrast-enhanced CT scan shows multiple cystic components (arrowheads) within the mass (arrows).
C. Sagittal T2-weighted MR image shows intermediate signal intensity mass (arrows) with multiple internal cystic components. It extends into the sacral canal.
D. Sagittal T1-weighted MR image shows intermediate signal intensity mass (arrows).
E. Contrast-enhanced axial T1-weighted MR image shows moderate enhancement of the mass (arrows). Multiple cystic compo- nents (arrowheads) correspond to necrosis.
lignant (3, 6), though a sacral location is relatively rare (6). The presence of fluid-fluid levels is diagnostically useful but is not pathognomonic, since fluid-fluid levels have also been reported in giant cell tumors, telang- iectatic osteosarcomas, osteoblastomas, and chondrob- lastomas (1, 7). The most common radiographic appear- ance is an osteolytic expansile lesion surrounded by a thin bony shell (2) (Fig. 2).
Benign Sacral Canal Tumors
Schwannoma and Neurofibroma
Sacral schwannomas are rare; schwannomas tend, in- stead, to grow along nerve segments and expand the sacral canal and neural foramen. Schwannomas and neurofibromas that occur in this location arise from the lower lumbar and sacral dorsal sensory nerve roots.
Reports have stated that the target sign seen at T2- weighted MR imaging, comprising a central area of low- to-intermediate signal intensity surrounded by a periph- eral ring of high signal intensity, is almost pathogno- monic of neurofibroma. This finding corresponds patho- logically to fibrous tissue (with high collagen content) centrally and more myxoid tissue peripherally, and is a feature of schwannomas and malignant peripheral nerve sheath tumors, as well as neurofibromas (8). On the basis of imaging findings only, it is often difficult to differentiate schwannoma from isolated neurofibroma within the sacrum (Fig. 3, 4), but the presence of multi- ple nerve sheath tumors suggests a diagnosis of neurofi- bromatosis. In such cases, malignant transformation may occur (3).
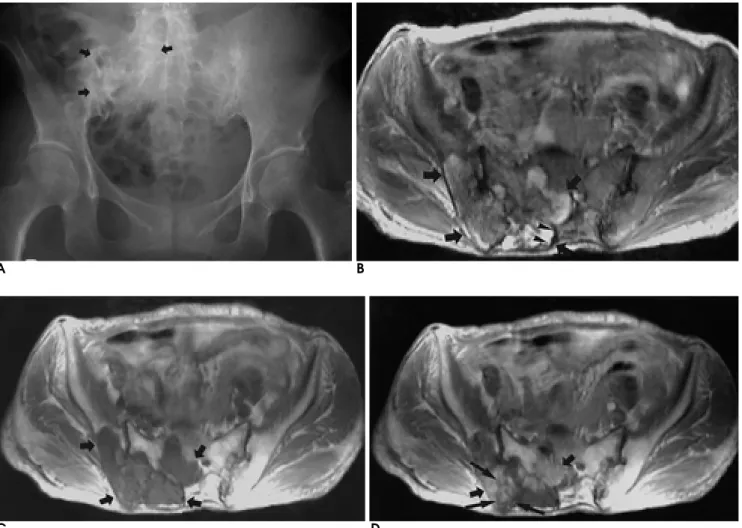
A
B
Fig. 2. A 41-year-old woman with sacral giant cell tumor and sec- ondary aneurysmal bone cyst.
A. Sagittal T2-weighted MR image shows multiloculated expan- sile mass (thick arrows) with multiple fluid-fluid levels (arrow- heads) and low signal intensity rim (small arrows), typical of aneurysmal bone cyst. This case was pathologically secondary aneurysmal bone cyst.
B. Axial T1-weighted MR image shows multiple high signal inten- sity areas (arrowheads) correspond to hemorrhage within the mass. The mass obliterates the sacral canal and extends across the right sacroiliac joint (arrows). This transarticular spread and ec- centric location suggests underlying giant cell tumor.
Malignant Bone Tumors
Chordoma
Chordoma is the most common primary malignant
sacral tumor, accounting for 2 4% of all primary malig- nant bone tumors. A chordoma arises from intraosseous notochordal remnants, and so almost always occurs in a midline or paramedian location (1 4). Nearly 50% of all chordomas originate in the sacrococcygeal region,
A B C
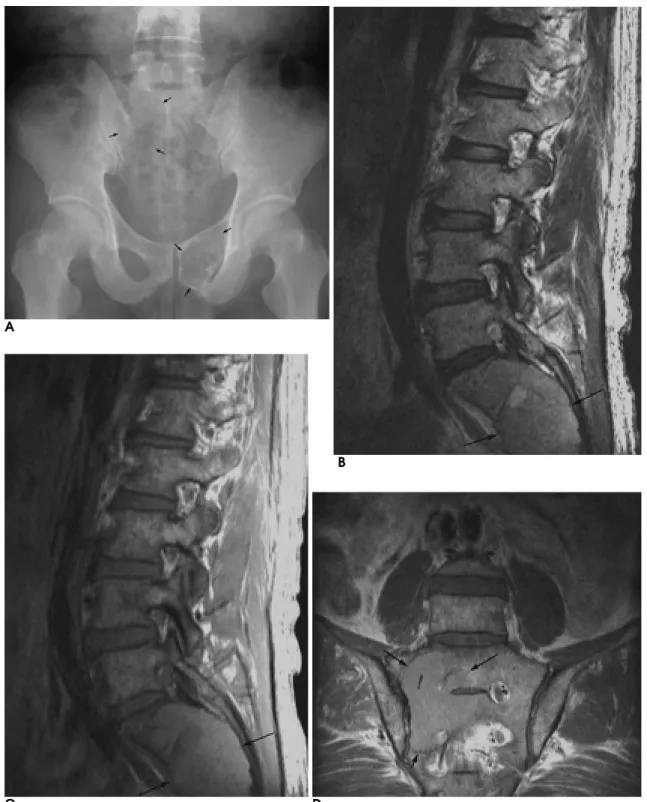
Fig. 4. A 22-year-old man with sacral nerve neurofibroma.
A. Sagittal T2-weighted MR image shows peripheral high signal intensity mass (arrows) in the sacral canal. There is slight erosion (arrowheads) of the sacral vertebral body. This image shows typical target sign.
B. Axial T1-weighted MR image shows iso signal intensity mass extending into the right sacral foramen (arrows).
C. Contrast-enhanced sagittal T1-weighted MR image shows heterogeneous enhancement (arrows).
A B C
Fig. 3. A 71-year-old man with schwannoma.
A. Sagittal T2-weighted MR image shows high signal intensity mass (arrows) in the sacral canal.
B. Axial T1-weighted MR image shows a low signal intensity mass just distal to the left sacral foramen. There is erosion (arrows) of the sacral vertebral body.
C. Contrast-enhanced fat-suppressed coronal T1-weighted MR image shows heterogeneous enhancement (arrows).
B
C
D A
E
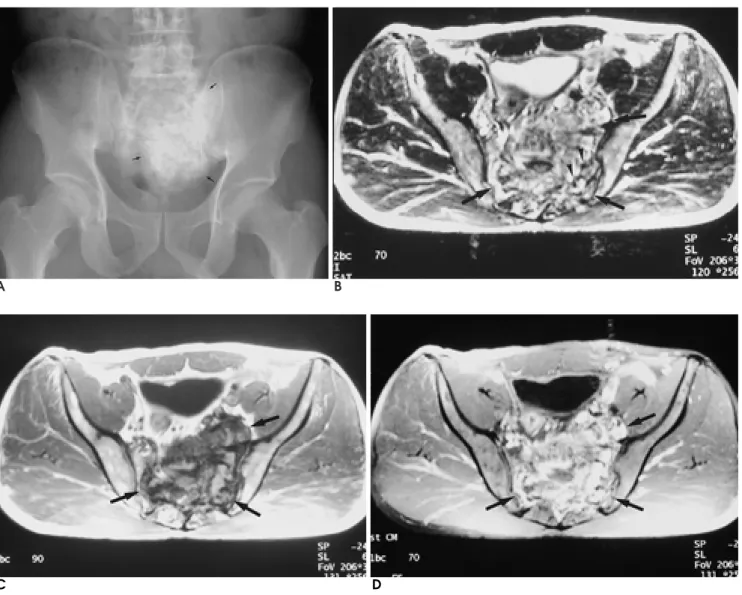
Fig. 5. A 61-year-old man with sacral chordoma.
A. Anteroposterior radiograph shows large expansile osteolytic lesion (arrows).
B. CT scan shows destructive mass (arrows) with soft tissue density containing calcification (arrowheads).
C. Axial T2-weighted MR image shows heterogeneous high signal intensity mass (arrows) centered in the midline. This findings correlate with the intratumoral accumulation of mucin.
D. Axial T1-weighted MR image shows slightly low signal intensity mass with focal high signal intensities (arrowheads) resulting from hemorrhage.
E. Contrast-enhanced sagittal T1-weighted MR image shows moderate enhancement (arrows).
and a further 35% in the sphenooccipital region. The re- maining 15% occur in the spine above the sacrum. Men are affected twice as frequently as women, and patients’
mean age is 50 years (2). Typical chordomas contain clear cells with intracytoplasmic vacuoles and abundant mucin; in atypical chordomas, the mucinous matrix is replaced by chondroid or osteoid elements. CT images of sacral chordomas depict large lytic lesions centered in the midline, and calcification is present in 30 70% of patients. Typical chordomas are isointense or slightly hypointense on T1-weighted images, and hyperintense on T2-weighted images. At both CT and MR, enhance- ment of their soft tissue components, which varies, is of- ten moderate (2, 3) (Fig. 5).
Chondrosarcoma
Chondrosarcomas account for 7 12% of malignant primary tumors of the spine, where about 10% of all chondrosarcomas are found (2, 4). The thoracic spine is the most common site and sacral involvement is unusu- al. Patients’ mean age is 45 years. Histologically, chon- drosarcomas are composed of lobules of hyaline carti- lage separated by fibrovascular septations. Radiographs and CT images reveal large destructive lesions with characteristic chondroid matrix mineralization.
Calcifications are typically rounded or curvilinear and are also visible in the soft tissue component of the le- sions. On MR images, they are manifested as areas of signal void. Enhanced MR imaging typically demon-
A B
C D
Fig. 6. A 59-year-old woman with chondrosarcoma.
A. Anteroposterior radiograph shows irregular sclerotic lesion (arrows) in the sacrum and the right iliac bone, extending across the right sacroiliac joint. It corresponds to matrix mineralization of tumor.
B. Axial T2-weighted MR image shows heterogeneous high signal intensity mass (arrows) with multilobulated contour and soft tis- sue involvement. Its center is in the right sacrum and extends into the right iliac bone. Curvilinear signal void (arrowheads) corre- sponds to calcification.
C. Axial T1-weighted MR image shows slightly low signal intensity mass (arrows). It extends into the right sacral neural foramen.
D. Contrast-enhanced axial T1-weighted MR image shows peripheral patchy enhancement (arrows) and ring-like septal enhance- ment (long arrows).
strates peripheral and septal enhancement correspond- ing to vascular septations between cartilaginous lobules (2) (Fig. 6).
Lymphoma
Primary bone lymphoma is a rare round-cell tumor, but is the third most common malignant primary neo- plasm of the sacrum, with a prevalence of 8% (9). Its in- cidence peaks during the second and third decades of life, with a male-female ratio of 2:1. Aggressive bone de- struction is a usual feature (Fig. 7). Because the tumor tends to extend to soft tissue while leaving underlying osseous structures intact, osteolytic lesions are not al- ways visible at radiography. At times, the appearance of a soft tissue mass can be the only clue to extensive un-
derlying bone involvement (1, 9).
Multple Myeloma
Multiple myeloma arises due to the neoplastic clonal expansion of plasma cells, and is the second most com- mon malignant primary neoplasm of the sacrum (9).
The incidence of myelomas peaks in the sixth and sev- enth decades of life; the tumor is more common in men than women, with a ratio of almost 2:1. Typically, multi- ple round lytic lesions with nonsclerotic margins occur, though in some patients (12 25%) there is diffuse dem- ineralization (1). Multiple lesions are depicted as hy- pointense to healthy marrow at T1-weighted imaging, and hyperintense at T2-weighted imaging (2) (Fig. 8).
C
Fig. 7. A 60-year-old woman with sacral lymphoma.
A. Anteroposterior radiograph shows osteolytic mass (arrows). Note the loss of de- lineation of neural foraminal lines (arrowheads).
B. Axial T2-weighted MR image shows slightly high signal intensity mass (arrows) centered in the sacrum.
C. Axial T1-weighted MR image shows iso signal intensity mass (arrows).
A B
A
B
C D
Fig. 8. A 61-year-old man with multiple myeloma.
A. Anteroposterior radiograph shows multiple lytic lesions (arrows) with nonsclerotic margin in the sacrum and the left pubic bone.
B. Sagittal T2-weighted MR image shows lesion (arrows) slightly hyperintense to healthy marrow.
C. Sagittal T1-weighted MR image shows iso intense mass (arrows). Diffuse abnormal signal intensity is also seen in whole lumbar spines. It may be diffuse infiltration of multiple myeloma or red marrow reconversion or mixed pattern.
D. Contrast-enhanced coronal T1-weighted MR image shows mild enhancement (arrows) with obliteration of the sacral neural foramen.
Osteosarcoma
Osteosarcoma is the most common nonlymphoprolif- erative primary malignant bone tumor, but rarely af- fects the spine. Less than 3% of all osteosarcomas are found there, and the tumor account for 5% of all prima- ry malignant spinal tumors (10). The lumbosacral region is the most common site. Radiographs and CT images depict a purely lytic, mixed, or predominantly osteoblas- tic lesion; CT helps identify both matrix mineralization and extension into paravertebral and extradural soft tis- sues. The MR imaging of nonmineralized areas is non- specific; lesions show low to intermediate signal intensi- ty at T1-weighted imaging, and high signal intensity at
may show a signal void at all pulse sequences (2).
References
1. Disler DG, Miklic D. Imaging findings in tumors of the sacrum.
AJR Am J Roentgenol 1999;173:1699-1706
2. Llauger J, Palmer J, Amores S, Bague S, Camins A. Primary tumors of the sacrum: diagnostic imaging. AJR Am J Roentgenol 2000;174:417-424
3. Diel J, Ortiz O, Losada RA, Price DB, Hayt MW, Katz DS. The sacrum: pathologic spectrum, multimodality imaging, and subspe- cialty approach. Radiographics 2001;21:83-104
4. Murphey MD, Andrews CL, Flemming DJ, Temple HT, Smith WS, Smirniotopoulos JG. From the archives of the AFIP. Primary tumors of the spine: radiologic-pathologic correlation. Radiograph-
A B
C D
Fig. 9. A 46-year-old man with sacral osteosarcoma.
A. Anteroposterior radiograph shows ill-defined mass (arrows) with osseous matrix.
B. Axial T2-weighted MR image shows slightly hyperintense heterogeneous mass (arrows) extending into the pelvic cavity.
Multiple signal void structures (arrowheads) correspond to bone formation.
C. Axial T1-weighted MR image shows low signal intensity mass (arrows).
D. Contrast-enhanced axial T1-weighted MR image shows well enhancement (arrows).
of 407 cases. AJR Am J Roentgenol 1985;144:955-960
6. Capanna R, Van Horn JR, Biagini B, Ruggieri P. Aneurysmal bone cyst of the sacrum. Skeletal Radiology 1989;18:109-113
7. Tsai JC, Dalinka MK, Fallon MD, Zlatkin MB, Kressel HY. Fluid- fluid level: a nonspecific finding in tumors of bone and soft tissue.
Radiology 1990;175:779-782
8. Murphey MD, Smith WS, Smith SE, Kransdorf MJ, Temple HT.
From the archives of the AFIP. Imaging of musculoskeletal neuro-
genic tumors: radiologic-pathologic correlation. Radiographics 1999;19:1253-1280
9. Unni KK. Dahlin’s bone tumors: general aspects and data on 11,087 cases, 5th edition. Philadelphia: Lippincott-Raven, 1996
10. Green R, Saifuddin A, Cannon S. Pictorial review: imaging of pri- mary osteosarcoma of the spine. Clinical Radiology 1996;51:325- 329