This is an Open Access article distributed under the terms of the Creative Commons At- tribution Non-Commercial License (http://creativecommons.org/licenses/by-nc/3.0/) which permits unrestricted non-commercial use, distribution, and reproduction in any medium, provided the original work is properly cited.
The Relationship between Lung Function and
Metabolic Syndrome in Obese and Non-Obese Korean Adult Males
Soo Kyoung Kim1, Kyu Yeon Hur1, Yoon Ho Choi2, Sun Wook Kim1, Jae Hoon Chung1, Hee Kyung Kim1, Moon-Kyu Lee1, Yong-Ki Min1, Kwang-Won Kim1, Jae Hyeon Kim1
1Division of Endocrinology and Metabolism, Department of Internal Medicine, 2Department of Center for Health Promotion and Sports Medicine, Samsung Medical Center, Sungkyunkwan University School of Medicine, Seoul, Korea
Background: The existence of an association between lung function and metabolic syndrome (MetS) has been debated in cases involving non-obese subjects. To address this debate, we performed a cross-sectional study to investigate the association between lung function and MetS in both obese and non-obese populations.
Methods: The present study consisted of a total of 1,951 Korean male subjects. In this study group, we investigated relationships between lung function and MetS risk factors such as fasting serum glucose, systolic blood pressure (SBP), insulin resistance in- dex, waist circumference (WC), and hemoglobin A1C level.
Results: Forced vital capacity (FVC) values were significantly lower in the MetS group compared with those of the non-MetS group. In both non-obese (body mass index [BMI] < 25 kg/m2) and obese subjects (BMI ≥ 25 kg/m2), fasting serum glucose, he- moglobin A1C level, insulin resistance index, SBP, WC, and the prevalences of diabetes and MetS were significantly higher in sub- jects in the lowest FVC quartile compared with those in the highest FVC quartile. Odds ratios for the presence of MetS risk fac- tors, after adjusting for age and height, ranged from 1.21 to 1.39 (P < 0.01) for a one standard deviation decrease in FVC.
Conclusion: The results of our study suggest that decreased vital capacity in Korean adult male subjects is associated with MetS, irrespective of obesity.
Keywords: FEV1; FVC; Insulin resistance; Metabolic syndrome
Corresponding author: Jae Hyeon Kim
Division of Endocrinology and Metabolism, Department of Internal Medicine, Samsung Medical Center, Sungkyunkwan University School of Medicine, 50 Irwon-dong, Gangnam-gu, Seoul 135-710, Korea
INTRODUCTION
Metabolic syndrome (MetS), a disorder involving impaired glu- cose metabolism, dyslipidemia, hypertension, and central obe- sity, is associated not only with type 2 diabetes mellitus and cardiovascular disease, but also with many other systemic dis- orders such as chronic lung disease and fatty liver disease [1].
In Western countries, several reports have suggested that glu- cose intolerance or diabetes, hypertension, and cardiovascular diseases are associated with impaired lung function [2-6].
Recently, several studies have been published showing that decreased lung function is associated with MetS [1,7,8]. While these studies have demonstrated a positive relationship between decreased lung function and MetS [9,10], the relationship be- tween vital capacity and MetS in non-obese subjects remains a matter of debate. In 2009, Oda and Kawai [11] reported that lower vital capacity is associated with diabetes but not with MetS in non-obese Japanese men, and that the association be- tween lower vital capacity and diabetes in non-obese men may involve factors other than MetS or insulin resistance. Converse- pISSN 1976-9180 · eISSN 2093-2650
ly, other studies have reported an association between lower vital capacity and MetS even in non-obese subjects, which sug- gests that lower vital capacity may be associated with certain characteristics of metabolically obese subjects who are of nor- mal weight [12,13].
To our knowledge, few studies have addressed the relation- ship between lung function and MetS in the Korean population [14]. Thus, we performed a cross-sectional study to investigate the relationship between lung function and MetS in both obese and non-obese Korean population.
METHODS
Subjects and measurements
Data was collected from the Samsung Medical Health Promo- tion Center between March 1 and July 31, 2008. During that time period, a total of 4,804 men and 4,192 women visited the medical center. Of these patients, we selected participants who were 30 years of age or older. The subjects meeting these crite- ria were requested to fill out a questionnaire regarding their personal history of cardiovascular disease, smoking status, anti- hypertensive medication, anti-lipid drugs, and hypoglycemic agents. Because many of the female patients were not available for answering questionnaire, the present study includes only male subjects.
Subjects with a history of lung cancer, lung or pleural sur- gery, or chronic lung disease (chronic obstructive pulmonary disease or asthma) were excluded. To eliminate the effects of smoking on lung function, current smokers were excluded.
Based on those exclusion criteria, the final sample population consisted of 1,951 non-smoking men.
For the collection of blood samples, patients fasted over- night, and blood was subsequently collected to measure serum glucose, triglycerides, high density lipoprotein cholesterol (HDL-C), low density lipoprotein cholesterol (LDL-C), hemo- globin A1C (HbA1C), white blood cell count (WBC), electrolytes, high sensitivity C-reactive protein (hs–CRP), and insulin levels.
Lung function tests including forced vital capacity (FVC) and forced expiratory volume in 1 second (FEV1) were performed using a pulmonary function test spirometer (Sensor Medics, Yorba Linda, CA, USA). The results of these tests were used to calculate FEV1/FVC. Body fat was measured using multifre- quency bioelectrical impedance analysis using an inBody720 (Biospace, Seoul, Korea). Average blood pressure was calculated from two measurements taken with the subject in a seated po-
sition, following 5 minutes of rest. Body weight was measured with subjects wearing light clothing provided by the testing center. Body mass index (BMI) was calculated as weight in kilo- grams divided by the square of patient height in meters, and waist circumference (WC) was measured at the level of the umbilicus. The revised National Cholesterol Education Pro- gram’s Adult Treatment Panel (NCEP-ATP III) criteria was used for definition of MetS, in which the presence of three or more of the following five components of MetS were consid- ered a positive indicator for MetS [15]: 1) WC: a modified cut- off point of 90 cm for men and 80 cm for women, which is con- sistent with recommendations from the International Diabetes Federation for Asian individuals [16]; 2) blood pressure: a sys- tolic blood pressure (SBP) ≥ 130 mm Hg and/or a diastolic blood pressure (DBP) ≥85 mm Hg; 3) triglycerides ≥ 150 mg/dL; 4) HDL-C < 40 mg/dL in men and < 50 mg/dL in women; and 5) fasting serum glucose ≥ 100 mg/dL. Subjects who were being treated with antihypertensive agents or hypoglycemic medica- tions at the time of the study were considered to be positive for the respective component of the criteria described above. In ad- dition, subjects were considered as having diabetes if their fast- ing serum glucose was greater than or equal to 126 mg/dL and/
or if the subject was being treated with hypoglycemic medica- tion at the time of evaluation. Subjects were considered posi- tive for hypertension if they had already been prescribed med- ication for hypertension or if their blood pressure measured SBP ≥ 140 mm Hg and/or DBP ≥ 90 mm Hg. Likewise, hyper- triglyceridemia was defined as a serum triglyceride concentra- tion of more than 150 mg/dL or if a subject was taking a pre- scribed lipid-lowering agent at the time of evaluation. Obesity was defined as a BMI greater than 25 kg/m2, while central obe- sity was defined as a WC greater than 90 cm. Insulin resistance was estimated according to the homeostasis model assessment (HOMA) [17]. Subjects with a HOMA index greater than 2.52 (75th percentile value for this study group) were defined as hav- ing insulin resistance. Before initiating this study, approval was received from the Ethical Committee of Samsung Medical Cen- ter at Sungkyunkwan University in Seoul, Korea.
Statistical analysis
Components of MetS and other clinical characteristics were compared between subjects with and without MetS. Subjects were divided into quartiles based on their FVC values (< 87, 87-96, 96-104, ≥ 104%) and were further subdivided into non- obese (BMI < 25 kg/m2) and obese (BMI ≥ 25 kg/m2) groups.
MetS risk factors, prevalence of diabetes, presence of MetS, and other characteristics were compared between subjects in the lowest and highest FVC quartiles in both the non-obese and obese groups. Partial correlation coefficients between FVC and MetS components were calculated for all subjects. The number of MetS components was evaluated and categorized into six groups: group 0 (n = 439), group 1 (n = 500), group 2 (n = 389), group 3 (n = 326), group 4 (n = 219), and group 5 (n = 78), ac- cording to the number of MetS components.
The data obtained from the subjects were analyzed such that a multilinear regression analysis was performed, in which FVC was the dependent variable and MetS components were the independent variables. In addition, logistic regression analy- sis was performed to estimate the odds ratio for the presence
of MetS components, where a 12% (1 SD) decrease in FVC was assumed. Statistical analysis was performed using PASW 17.0 software (SPSS Inc., Chicago, IL, USA), and values of P <
0.05 were considered statistically significant.
RESULTS
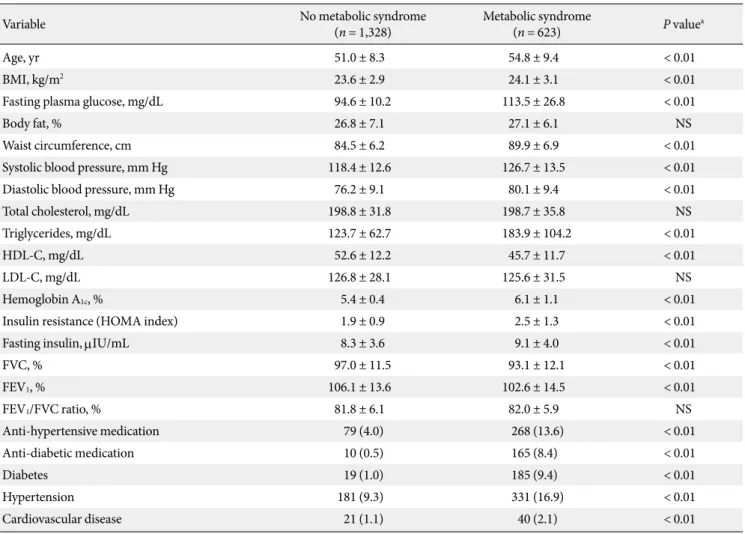
The mean subject age was 52.2 ± 8.8 years, and the mean BMI and WC of the subjects were 23.8 ± 3.0 kg/m2 and 86.2 ± 6.9 cm, respectively. The prevalences of diabetes, MetS, hypertension, and cardiovascular diseases were 10.4%, 31.9%, 26.1%, and 3.1%, respectively. Basal characteristics and MetS components for MetS and non‐MetS subjects are shown in Table 1. With the exception of HDL‐C, all MetS components were significant-
Table 1. Baseline characteristics of the subjects according to metabolic syndrome status
Variable No metabolic syndrome
(n = 1,328) Metabolic syndrome
(n = 623) P valuea
Age, yr 51.0 ± 8.3 54.8 ± 9.4 < 0.01
BMI, kg/m2 23.6 ± 2.9 24.1 ± 3.1 < 0.01
Fasting plasma glucose, mg/dL 94.6 ± 10.2 113.5 ± 26.8 < 0.01
Body fat, % 26.8 ± 7.1 27.1 ± 6.1 NS
Waist circumference, cm 84.5 ± 6.2 89.9 ± 6.9 < 0.01
Systolic blood pressure, mm Hg 118.4 ± 12.6 126.7 ± 13.5 < 0.01
Diastolic blood pressure, mm Hg 76.2 ± 9.1 80.1 ± 9.4 < 0.01
Total cholesterol, mg/dL 198.8 ± 31.8 198.7 ± 35.8 NS
Triglycerides, mg/dL 123.7 ± 62.7 183.9 ± 104.2 < 0.01
HDL-C, mg/dL 52.6 ± 12.2 45.7 ± 11.7 < 0.01
LDL-C, mg/dL 126.8 ± 28.1 125.6 ± 31.5 NS
Hemoglobin A1c, % 5.4 ± 0.4 6.1 ± 1.1 < 0.01
Insulin resistance (HOMA index) 1.9 ± 0.9 2.5 ± 1.3 < 0.01
Fasting insulin, mIU/mL 8.3 ± 3.6 9.1 ± 4.0 < 0.01
FVC, % 97.0 ± 11.5 93.1 ± 12.1 < 0.01
FEV1, % 106.1 ± 13.6 102.6 ± 14.5 < 0.01
FEV1/FVC ratio, % 81.8 ± 6.1 82.0 ± 5.9 NS
Anti-hypertensive medication 79 (4.0) 268 (13.6) < 0.01
Anti-diabetic medication 10 (0.5) 165 (8.4) < 0.01
Diabetes 19 (1.0) 185 (9.4) < 0.01
Hypertension 181 (9.3) 331 (16.9) < 0.01
Cardiovascular disease 21 (1.1) 40 (2.1) < 0.01
Data are presented as number (%) or mean ± standard deviation unless otherwise indicated.
BMI, body mass index; HDL-C, high density lipoprotein cholesterol; LDL-C, low density lipoprotein cholesterol; FVC, forced vital capacity;
FEV1, forced expiratory volume in 1 second; HOMA, homeostasis model assessment; NS, not significant.
aP values were calculated using the t-test (continuous variables) or chi-square test (categorical variables).
ly higher in the MetS subjects than in the non‐MetS subjects. A significantly greater number of subjects with MetS were found to be taking anti‐hypertensive medication or oral hypoglyce- mic agents or were diagnosed with cardiovascular diseases than those in the non‐MetS group. Likewise, FVC and FEV1
were significantly lower in the MetS group compared with those of subjects in the non‐MetS group; however, the FEV1/FVC ratios did not differ significantly between the MetS and non–
MetS groups (Table 1). The FVC, FEV1, and FEV1/FVC were also compared between the diabetes and non‐diabetes groups.
Values of FVC and FEV1 were significantly lower in the diabetic subjects than they were in the non‐diabetic subjects (92.0 ± 11.2% vs. 96.2 ± 11.8%, 101.2 ± 13.3% vs. 105.5 ± 13.9%, respec- tively; P < 0.05); however the FEV1/FVC did not differ signifi- cantly (81.7 ± 6.2% vs. 81.9 ± 5.9%; P = NS).
After adjusting for age and height, FVC values were nega- tively correlated with MetS components such as fasting serum glucose, triglycerides, SBP, WC, and HOMA index. Conversely, FVC was positively correlated with BMI and HDL‐C (Table 2).
In non‐obese subjects, fasting serum glucose, WC, HbA1C, insulin resistance index, SBP, and HDL‐C, as well as the preva- lences of diabetes, hypertension, and MetS were significantly higher; however, BMI was lower in subjects in the lowest FVC quartile compared to that of those in the highest FVC quartile (Table 3). In obese subjects, fasting serum glucose, body fat, WC, HbA1C, insulin resistance, fasting serum insulin level, SBP, BMI, and the prevalences of diabetes, hypertension, and MetS
were significantly higher in subjects in the lowest FVC quartile compared to those of individuals in the highest FVC quartile (Table 4).
The FVC and FEV1 results according to the number of MetS components were as follows: group 0 (97.6 ± 12.0%, 106.5 ± 14.5%, respectively), group 1 (96.5 ± 11.4%, 105.9 ± 12.9%), group 2 (96.3 ± 11.3%, 105.2 ± 13.4%), group 3 (94.3 ± 12.1%, 103.4 ± 14.6%), group 4 (93.4 ± 11.9%, 104.1 ± 14.7%), and group 5 (90.7 ± 12.3%, 99.8 ± 13.9%). Based on these results, there appears to be a trend for FVC and FEV1 to decrease with an increasing number of MetS components. While there was no significant difference between groups 1 and 2, a significant difference between groups 2 and 3 was observed. Thus, having three or more MetS components appeared to be related to sig- nificant declines in FVC and FEV1.
The results of our multi‐variable linear regression analysis, all metabolic components were entered into the model, using FVC as dependent variables are shown in Table 5. The HOMA index, SBP, and WC appeared to be negatively correlated with FVC after adjusting for age and height; however, fasting serum glucose and triglycerides did not appear to be correlated with FVC.
In our logistic regression analysis, after adjusting for age and height, an FVC decrease of 12% (1 SD) appeared to be as- sociated with increases in type 2 diabetes mellitus (odds ratio [OR], 1.39 [1.19 to 1.62]), hypertension (OR, 1.22 [1.10 to 1.36]), insulin resistance (OR, 1.31 [1.18 to 1.46]), abdominal obesity (OR, 1.21 [1.10 to 1.34]), and hypertriglyceridemia (OR, 1.21 [1.10 to 1.32]). However, obesity and cardiovascular disease did not appear to be associated with a decrease in FVC.
DISCUSSION
The present study showed a cross-sectional relationship be- tween lung function and MetS in both obese and non-obese males. In the MetS group, both FVC and FEV1 values, but not the FVC/FEV1 ratio, were lower than those of subjects in the non-MetS group. The present study also showed that having three or more MetS components result in a significant decrease in FVC.
Currently, it is thought that there is a common mechanism underlying MetS, such as insulin resistance and/or obesity [18,19]. Previous studies have reported that fasting serum in- sulin levels and insulin resistance are inversely correlated with FVC and FEV1 [3,20]. Our study showed that fasting serum Table 2. Partial correlations between percentage of forced vital
capacity (FVC) and metabolic risk factors
Variable FVC (n = 1,951)
Correlation coefficient P value
Fasting glucose -0.10 < 0.01
Triglyceride -0.06 < 0.05
HDL-C 0.05 < 0.05
Systolic blood pressure -0.08 < 0.01
Waist circumference -0.10 < 0.01
HOMA index -0.12 < 0.01
Fasting insulin -0.10 < 0.01
Body mass index 0.07 < 0.01
Body fat -0.09 < 0.01
HbA1C -0.11 < 0.01
The model was adjusted for age and height.
HDL-C, high density lipoprotein cholesterol; HOMA, homeostasis model assessment.
insulin and insulin resistance (HOMA) are also inversely cor- related with FVC and FEV1. In addition, obesity has been shown to be inversely related to lung function [21]. Consistent with previous studies, we observed that WC appears to be negatively correlated with FVC and FEV1 in both obese and non-obese males, but BMI appears to be positively correlated with FVC and FEV1. However, in individuals with a BMI greater than 25 kg/m2, a negative correlation with FVC and FEV1 was observed (data not shown), also in agreements with the results of previ- ous studies [12]. Based on these results, we suggest that, in general, a higher BMI may be associated with a higher body fat percentage; however, in the case of subjects whose BMI is less than 25 kg/m2, a higher BMI may arise from increased levels of lean tissue, such as muscle mass. Together, central obesity and insulin resistance, rather than BMI alone, may play an im-
portant role in decreases in lung function, especially with re- spect to FVC. Recently, Oda and Kawai [11] reported that a lower vital capacity is associated with diabetes but not with MetS in non-obese subjects. Specifically, they found that a lower vital capacity was associated with a lower BMI in non-obese Japanese, and that the association between lower vital capacity and diabetes in non-obese Japanese may involve factors other than MetS or insulin resistance. However, in our study, we found that lower FVC values were associated with MetS and diabetes in non-obese individuals, despite the lower BMI in the lowest FVC quartile compared to that in the highest FVC quartile. In the non-obese group, fasting serum glucose, HbA1C
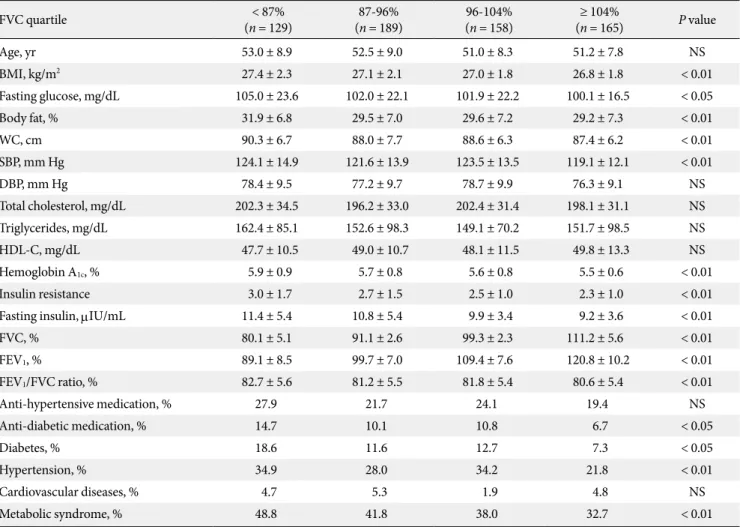
level, SBP, insulin resistance index, and the prevalences of dia- betes, hypertension, and MetS were significantly higher in sub- jects in the lowest FVC quartile compared to those of subjects Table 3. Basal characteristics and metabolic components of the subjects according to quartile of forced vital capacity (FVC) in the non-obese group (< 25 kg/m2)
FVC quartile < 87%
(n = 129) 87-96%
(n = 189) 96-104%
(n = 158) ≥ 104%
(n = 165) P value
Age, yr 52.3 ± 9.3 53.5 ± 8.9 51.6 ± 9.0 52.1 ± 8.5 NS
BMI, kg/m2 21.6 ± 2.1 22.1 ± 2.0 22.5 ± 1.7 22.4 ± 1.6 < 0.01
Fasting glucose, mg/dL 103.5 ± 23.1 99.9 ± 19.1 98.9 ± 15.6 97.4 ± 15.1 < 0.05
Body fat, % 25.4 ± 5.6 25.4 ± 6.2 24.6 ± 6.1 25.6 ± 6.0 NS
WC, cm 86.2 ± 7.2 84.9 ± 6.6 84.8 ± 6.4 84.4 ± 6.4 < 0.01
SBP, mm Hg 122.9 ± 12.9 119.9 ± 13.9 120.8 ± 14.1 120.0 ± 12.2 < 0.01
DBP, mm Hg 78.4 ± 9.1 76.5 ± 9.6 77.5 ± 9.9 77.4 ± 8.5 NS
Total cholesterol, mg/dL 197.9 ± 35.1 199.0 ± 32.8 196.2 ± 34.1 200.3 ± 31.7 NS
Triglycerides, mg/dL 148.9 ± 23.2 135.5 ± 69.6 133.4 ± 77.3 134.3 ± 79.6 < 0.05
HDL-C, mg/dL 49.6 ± 12.8 51.1 ± 12.4 51.8 ± 12.7 52.1 ± 13.3 < 0.05
Hemoglobin A1c, % 5.8 ± 1.0 5.6 ± 0.7 5.6 ± 0.7 5.4 ± 0.6 < 0.01
Insulin resistance 2.0 ± 0.9 2.0 ± 0.9 1.9 ± 0.8 1.8 ± 0.8 < 0.01
Fasting insulin, mIU/mL 7.7 ± 3.1 8.1 ± 3.0 7.7 ± 2.7 7.4 ± 2.8 NS
FVC, % 80.0 ± 5.3 91.2 ± 2.6 99.4 ± 2.3 110.9 ± 5.4 < 0.01
FEV1, % 89.1 ± 9.1 100.2 ± 7.4 108.5 ± 7.9 120.1 ± 9.7 < 0.01
FEV1/FVC ratio, % 84.1 ± 7.2 82.1 ± 6.3 81.7 ± 5.9 80.7 ± 4.9 NS
Anti‐hypertensive medication, % 19.0 13.8 14.0 14.0 NS
Anti‐diabetic medication, % 13.4 7.5 8.5 3.7 < 0.05
Diabetes, % 14.1 8.4 9.6 5.8 < 0.05
Hypertension, % 30.5 24.0 23.6 20.7 < 0.05
Cardiovascular diseases, % 3.0 3.3 1.5 2.7 NS
Metabolic syndrome, % 40.7 24.6 26.5 21.3 < 0.01
BMI, body mass index; WC, waist circumference; SBP, systolic blood pressure; DBP, diastolic blood pressure; HDL-C, high density lipoprotein cholesterol; FEV1, forced expiratory volume in 1 second; NS, not significant.
in the highest FVC quartile. These differences may be explained by studying the high prevalence of MetS in our study group (21.3 to 40.3%) as compared to that of the Oda and Kawai study group (4.7 to 4.8%). Likewise, WC values also were higher in our group (84.0 to 86.0 cm) than they were in the Oda and Kawai group (80.0 to 81.9 cm) [11,22]. As in previous reports [12], our study also suggested that a lower FVC may be associ- ated with characteristics of metabolically obese subjects who are of normal weight [13].
Abdominal obesity was a better predictor of pulmonary function than BMI is. This association may result from the me- chanical effects of abdominal obesity, which may mechanically affect compliance of the diaphragm and chest wall [23]. Fur- ther, abdominal obesity is linked to the metabolic effects of obesity, in that adiposity is a low-grade inflammatory condi- Table 5. Multivariable linear regression analysis of the rela-
tionships between forced vital capacity (FVC) and metabolic risk factors
Variable FVC (n = 1,951)
B P valuea
Insulin resistance (HOMA index) ‐1.82 < 0.01
Waist circumference ‐0.18 < 0.01
Systolic blood pressure ‐0.05 < 0.01
Fasting glucose ‐0.01 NS
Triglyceride ‐0.00 NS
Body mass index 0.61 < 0.01
The model was adjusted for age and height.
B Standard regression coefficient.
HOMA, homeostasis model assessment; NS, not significant.
aP values were calculated using multiple regression analysis.
Table 4. Basal characteristics and metabolic components of the subjects according to quartile of forced vital capacity (FVC) in the obese group (≥ 25 kg/m2)
FVC quartile < 87%
(n = 129) 87-96%
(n = 189) 96-104%
(n = 158) ≥ 104%
(n = 165) P value
Age, yr 53.0 ± 8.9 52.5 ± 9.0 51.0 ± 8.3 51.2 ± 7.8 NS
BMI, kg/m2 27.4 ± 2.3 27.1 ± 2.1 27.0 ± 1.8 26.8 ± 1.8 < 0.01
Fasting glucose, mg/dL 105.0 ± 23.6 102.0 ± 22.1 101.9 ± 22.2 100.1 ± 16.5 < 0.05
Body fat, % 31.9 ± 6.8 29.5 ± 7.0 29.6 ± 7.2 29.2 ± 7.3 < 0.01
WC, cm 90.3 ± 6.7 88.0 ± 7.7 88.6 ± 6.3 87.4 ± 6.2 < 0.01
SBP, mm Hg 124.1 ± 14.9 121.6 ± 13.9 123.5 ± 13.5 119.1 ± 12.1 < 0.01
DBP, mm Hg 78.4 ± 9.5 77.2 ± 9.7 78.7 ± 9.9 76.3 ± 9.1 NS
Total cholesterol, mg/dL 202.3 ± 34.5 196.2 ± 33.0 202.4 ± 31.4 198.1 ± 31.1 NS
Triglycerides, mg/dL 162.4 ± 85.1 152.6 ± 98.3 149.1 ± 70.2 151.7 ± 98.5 NS
HDL-C, mg/dL 47.7 ± 10.5 49.0 ± 10.7 48.1 ± 11.5 49.8 ± 13.3 NS
Hemoglobin A1c, % 5.9 ± 0.9 5.7 ± 0.8 5.6 ± 0.8 5.5 ± 0.6 < 0.01
Insulin resistance 3.0 ± 1.7 2.7 ± 1.5 2.5 ± 1.0 2.3 ± 1.0 < 0.01
Fasting insulin, mIU/mL 11.4 ± 5.4 10.8 ± 5.4 9.9 ± 3.4 9.2 ± 3.6 < 0.01
FVC, % 80.1 ± 5.1 91.1 ± 2.6 99.3 ± 2.3 111.2 ± 5.6 < 0.01
FEV1, % 89.1 ± 8.5 99.7 ± 7.0 109.4 ± 7.6 120.8 ± 10.2 < 0.01
FEV1/FVC ratio, % 82.7 ± 5.6 81.2 ± 5.5 81.8 ± 5.4 80.6 ± 5.4 < 0.01
Anti‐hypertensive medication, % 27.9 21.7 24.1 19.4 NS
Anti‐diabetic medication, % 14.7 10.1 10.8 6.7 < 0.05
Diabetes, % 18.6 11.6 12.7 7.3 < 0.05
Hypertension, % 34.9 28.0 34.2 21.8 < 0.01
Cardiovascular diseases, % 4.7 5.3 1.9 4.8 NS
Metabolic syndrome, % 48.8 41.8 38.0 32.7 < 0.01
BMI, body mass index; WC, waist circumference; SBP, systolic blood pressure; DBP, diastolic blood pressure; HDL-C, high density lipoprotein cholesterol; FEV1, forced expiratory volume in 1 second; NS, not significant.
tion that is linked to insulin resistance. Visceral adipose tissue influences adipokines and cytokines, such as interleukine 6 and tumor necrosis factor-α. These cytokines may cause sys- temic inflammation, which is thought to be involved in the as- sociation between central obesity and/or insulin resistance and pulmonary function [24].
In our multi-linear regression analysis, insulin resistance, as measured by the HOMA index, appeared to be independently associated with FVC after adjusting for age, height, and MetS components. This result suggests that the relationship between insulin resistance and FVC is independent of abdominal obe- sity, which is itself a risk factor for the development of insulin resistance and a mechanical factor that may lead to impaired lung function. As shown in other reports, there are additional known factors that correlate with insulin resistance, such as hypertension and diabetes, all of which are inversely correlat- ed with FVC [3,5,6]. However, the underlying mechanism of decreased lung function may be multi-factorial. Our study was not controled for several potential confounding factors, such as physical activity, socio-economic status, or alcohol intake.
These potential confounding factors may explain our low cor- relation coefficient.
Previous reports have shown that impaired lung function can predict the developments of diabetes, insulin resistance, hypertension, and cardiovascular disease [4,6,20]. In our study, we inferred that a decrease in FVC was associated with increased risks of type 2 diabetes, hypertension, insulin resistance, hyper- triglyceridemia, and central obesity; however, unlike other stud- ies, no relationship between decreased lung function and cardio- vascular disease was found. The reason for this lack of an asso- ciation may have been due to the low incidence of cardiovas- cular disease in our study subjects. Our study also found no in- crease in the risk of obesity with decreased lung function. To- gether, these results suggest that it is not simply obesity, but rather insulin resistance and/or central obesity are more im- portant causes of decreased lung function.
Our study was performed on a limited cross-section of the population, using only male subjects, and was not controlled for potential biases from physical activity and alcohol consump- tion. Thus, a longitudinal prospective study that includes fe- male subjects will be needed to establish the relationship be- tween lung function and MetS.
In summary, insulin resistance and certain components of MetS (type 2 diabetes mellitus, hypertension, central obesity, and hypertriglyceridemia) appear to be related to vital capaci-
ty, irrespective of obesity, in Korean males. These findings sug- gest that there is a relationship between a lower FVC and MetS in non-obese subjects, which may also be associated with met- abolically obese subjects of normal weight.
ACKNOWLEDGMENT
No authors have any significant conflicts of interest.
REFERENCES
1. Nakajima K, Kubouchi Y, Muneyuki T, Ebata M, Eguchi S, Mu- nakata H. A possible association between suspected restrictive pattern as assessed by ordinary pulmonary function test and the metabolic syndrome. Chest 2008;134:712-8.
2. Davis WA, Knuiman M, Kendall P, Grange V, Davis TM; Fre- mantle Diabetes Study. Glycemic exposure is associated with reduced pulmonary function in type 2 diabetes: the Fremantle Diabetes Study. Diabetes Care 2004;27:752-7.
3. Lawlor DA, Ebrahim S, Smith GD. Associations of measures of lung function with insulin resistance and type 2 diabetes: find- ings from the British Women’s Heart and Health Study. Diabe- tologia 204;47:195-203.
4. Yeh HC, Punjabi NM, Wang NY, Pankow JS, Duncan BB, Bran- cati FL. Vital capacity as a predictor of incident type 2 diabetes:
the Atherosclerosis Risk in Communities study. Diabetes Care 2005;28:1472-9.
5. Engstrom G, Wollmer P, Valind S, Hedblad B, Janzon L. Blood pressure increase between 55 and 68 years of age is inversely related to lung function: longitudinal results from the cohort study ‘Men born in 1914’. J Hypertens 2001;19:1203-8.
6. Engström G, Hedblad B, Nilsson P, Wollmer P, Berglund G, Jan- zon L. Lung function, insulin resistance and incidence of car- diovascular disease: a longitudinal cohort study. J Intern Med 2003;253:574-81.
7. Fimognari FL, Pasqualetti P, Moro L, Franco A, Piccirillo G, Pastorelli R, Rossini PM, Incalzi RA. The association between metabolic syndrome and restrictive ventilatory dysfunction in older persons. J Gerontol A Biol Sci Med Sci 2007;62:760-5.
8. Lin WY, Yao CA, Wang HC, Huang KC. Impaired lung func- tion is associated with obesity and metabolic syndrome in adults. Obesity (Silver Spring) 2006;14:1654-61.
9. Ochs-Balcom HM, Grant BJ, Muti P, Sempos CT, Freudenheim JL, Trevisan M, Cassano PA, Iacoviello L, Schünemann HJ.
Pulmonary function and abdominal adiposity in the general
population. Chest 2006;129:853-62.
10. Leone N, Courbon D, Thomas F, Bean K, Jego B, Leynaert B, Guize L, Zureik M. Lung function impairment and metabolic syndrome: the critical role of abdominal obesity. Am J Respir Crit Care Med 2009;179:509-16.
11. Oda E, Kawai R. Lower vital capacity is associated with diabe- tes but not with metabolic syndrome in nonobese Japanese men.
Diabetes Care 2009;32:e69.
12. Nakajima K, Saito M. Lower vital capacity is associated with diabetes but not with metabolic syndrome in nonobese Japa- nese men: response to Oda and Kawai. Diabetes Care 2009;32:
e135.
13. Conus F, Rabasa-Lhoret R, Peronnet F. Characteristics of meta- bolically obese normal-weight (MONW) subjects. Appl Physi- ol Nutr Metab 2007;32:4-12.
14. Paek YJ, Jung KS, Hwang YI, Lee KS, Lee DR, Lee JU. Associa- tion between low pulmonary function and metabolic risk fac- tors in Korean adults: the Korean National Health and Nutri- tion Survey. Metabolism 2010;59:1300-6.
15. Expert Panel on Detection, Evaluation, and Treatment of High Blood Cholesterol in Adults. Executive Summary of The Third Report of The National Cholesterol Education Program (NCEP) Expert Panel on Detection, Evaluation, and Treatment of High Blood Cholesterol In Adults (Adult Treatment Panel III). JAMA 2001;285:2486-97.
16. Grundy SM, Cleeman JI, Daniels SR, Donato KA, Eckel RH, Franklin BA, Gordon DJ, Krauss RM, Savage PJ, Smith SC Jr, Spertus JA, Costa F; American Heart Association; National Heart, Lung, and Blood Institute. Diagnosis and management
of the metabolic syndrome: an American Heart Association/
National Heart, Lung, and Blood Institute Scientific Statement.
Circulation 2005;112:2735-52.
17. Matthews DR, Hosker JP, Rudenski AS, Naylor BA, Treacher DF, Turner RC. Homeostasis model assessment: insulin resis- tance and beta-cell function from fasting plasma glucose and insulin concentrations in man. Diabetologia 1985;28:412-9.
18. Cheal KL, Abbasi F, Lamendola C, McLaughlin T, Reaven GM, Ford ES. Relationship to insulin resistance of the adult treat- ment panel III diagnostic criteria for identification of the met- abolic syndrome. Diabetes 2004;53:1195-200.
19. Alberti KG, Zimmet P, Shaw J. Metabolic syndrome--a new world-wide definition. A Consensus Statement from the Inter- national Diabetes Federation. Diabet Med 2006;23:469-80.
20. Lazarus R, Sparrow D, Weiss ST. Impaired ventilatory function and elevated insulin levels in nondiabetic males: the Normative Aging Study. Eur Respir J 1998;12:635-40.
21. Lazarus R, Gore CJ, Booth M, Owen N. Effects of body com- position and fat distribution on ventilatory function in adults.
Am J Clin Nutr 1998;68:35-41.
22. Oda E, Kawai R. Lower vital capacity is associated with diabe- tes but not with metabolic syndrome in nonobese Japanese men:
response to Nakajima and Saito. Diabetes Care 2009;32:e136.
23. Crummy F, Naughton MT, Elborn JS. Obesity and the respira- tory physician. Thorax 2008;63:576-7.
24. Rajala MW, Scherer PE. Minireview: the adipocyte--at the cross- roads of energy homeostasis, inflammation, and atherosclero- sis. Endocrinology 2003;144:3765-73.