Comparison of CAD/CAM abutment and prefabricated abutment in Morse taper internal type implant after cyclic loading:
Axial displacement, removal torque, and tensile removal force
Yuseung Yi, Seong-Joo Heo*, Jai-Young Koak, Seong-Kyun Kim
Department of Prosthodontics, Seoul National University Dental Hospital & Dental Research Institute, College of Dentistry, Seoul National University, Seoul, Republic of Korea
PURPOSE. The purpose of this study was to compare computer-aided design/computer-aided manufacturing (CAD/CAM) abutment and prefabricated abutment in Morse taper internal connection type implants after cyclic loading. MATERIALS AND METHODS. The study was conducted with internal type implants of two different manufacturers (Group Os, De). Fourteen assemblies were prepared for each manufacturer group and divided into 2 groups (n=7): prefabricated abutments (Os-P, De-P) and CAD/CAM abutments (Os-C, De-C). The amount of axial displacement and the removal torque values (RTVs) were measured before and after cyclic loading (106 cycles, 3 Hz with 150 N), and the tensile removal force to dislodge the abutments was measured after cyclic loading. A repeated measures ANOVA and a pattern analysis based on the logarithmic regression model were conducted to evaluate the effect of cyclic loading on the axial displacement. The Wilcoxon signed-rank test and the Mann- Whitney test was conducted for comparison of RTV reduction% and tensile removal forces. RESULTS. There was no significant difference between CAD/CAM abutments and prefabricated abutments in axial displacement and tensile removal force; however, significantly greater RTV reduction% after cyclic loading was observed in CAD/
CAM abutments. The correlation among the axial displacement, the RTV, and the tensile removal force was not significant. CONCLUSION. The use of CAD/CAM abutment did not significantly affect the amount of axial displacement and tensile removal force, but presented a significantly greater removal torque reduction% than prefabricated abutments. The connection stability due to the friction at the abutment-implant interface of CAD/
CAM abutments may not be different from prefabricated abutment. [J Adv Prosthodont 2019;11:305-12]
KEYWORDS: CAD/CAM abutment; Axial displacement; Removal torque; Tensile removal force; Cyclic loading
INTRODUCTION
The internal connection type implants have been reported to have more reliable connection stability than the external con- nection type implants. In external connection type, only the screw secures the abutment to the implant when mechanical load is applied. On the other hand, friction and locking of the tapered interface between the abutment and the implant mainly provide stable retention in internal tapered connection type.1 In two-piece dental implant systems, a microgap is avoidable at the implant-abutment interface and the dimen- sion of this microgap could be influenced by external load applied on the abutment.2 A microgap was significantly decreased in a Morse taper implant connection after mechan-
Corresponding author:
Seong-Joo Heo
Department of Prosthodontics, Seoul National University Dental Hospital
& Dental Research Institute, College of Dentistry, Seoul National University, Seoul, Republic of Korea
101 Daehak-ro, Jongno-gu, Seoul, 03080, Republic of Korea Tel. +82220722661: e-mail, [email protected]
Received February 22, 2019 / Last Revision September 24, 2019 / Accepted December 11, 2019
© 2019 The Korean Academy of Prosthodontics
This is an Open Access article distributed under the terms of the Creative Commons Attribution Non-Commercial License (http://creativecommons.
org/licenses/by-nc/4.0) which permits unrestricted non-commercial use, distribution, and reproduction in any medium, provided the original work is properly cited.
This work was supported by the Seoul National University Dental Hospital (SNUDH) research fund (#032014-0034). The authors reported no conflicts of interest related to this study.
ical cyclic loading, which was caused by settling of the abut- ment and deformation of the interface.3,4 Seol et al.5 showed that the total length of the implant-abutment assembly was significantly decreased in internal tapered implant and no sig- nificant axial displacement occurred in external connection type implant. The amount of axial displacement in internal connection type implant can be affected by a variety of fac- tors including interface design, the abutment materials, and surface condition associated to the coefficient of friction.6,7 As axial displacement occurs, the preload between the screw and the abutment is reduced and the risk of screw loosening increases. If the interface between the abutment and the implant becomes too small, it is anticipated that the connec- tion stability increases by the increased frictional force.8,9
The computer-aided design/computer aided manufactur- ing (CAD/CAM) system, which has been used in various restorative treatments ranging from a simple prosthesis to extensive implant prostheses, offers the advantage of ensur- ing constant results and productivity.10 In particular, the use of CAD/CAM customized abutments can reproduce the anatomically ideal abutment shape and produce prostheses with a more aesthetic and natural emergence profile at the gingival region.11 In recent years, many companies have pro- duced CAD/CAM customized abutments, but the accuracy and the stability of CAD/CAM abutments are not well-doc- umented. Also, there is still lack of long-term clinical research and experimental study.
The purpose of this study was to evaluate the mechanical stability of the CAD/CAM customized abutments com- pared to prefabricated abutment in Morse taper internal con- nection type implant system. In this study, the same form of CAD/CAM customized abutments and prefabricated abut- ment were connected to the same kinds of implants. The amount of axial displacement and the removal torque values (RTVs) were measured before and after cyclic loading, and the tensile removal force to dislodge the abutments was mea- sured after cyclic loading.
The null hypothesis was that no significant difference would be found in the axial displacement, the removal torque reduction, and the tensile removal force between the
prefabricated abutments and the CAD/CAM abutments.
MATERIALS AND METHODS
The study was conducted using implant-abutment assemblies manufactured by two different manufacturers (Group Os:
Osstem TS II R4.0 × 10 mm, Osstem Implant, Seoul, Korea;
Group De: Implantium 4.0 × 10 mm, Dentium Implant, Seoul, Korea). Fourteen implant-abutment assemblies were prepared for each manufacturer group. They were divided into two groups (n = 7) of prefabricated abutments (Os-P, De-P) and CAD/CAM customized abutments (Os-C, De-C), which were connected to the same kinds of implants.
All the assemblies included conical-hex internal connection with 11° Morse taper. CAD/CAM abutments were designed to the same form of the prefabricated abutment (Os-C: D 4.5 mm, G/H 2.0 mm, H 7.0 mm, Taper angle 6°; De-C: D 4.5 mm, G/H 2.5 mm, H 5.5 mm, Taper angle 6°) and fabri- cated by CNC milling of premilled cylinder grade 5 titanium alloy (Ti-6Al-4V) with ARUM 5X-200 (Arum Europe GmbH, Frankfurt, Germany) : number of axis 5; accuracy 5 μm;
spindle power DC 3.0 KW; spindle speed 2,000 - 60,000 rpm; ATC (automatic tool changer) number of tools 15. The prefabricated abutments used in group Os-P were also made of grade 5 titanium alloy, and they were pure grade 4 titani- um (CP-Ti grade 4) in group De-P. The same kinds of screws were used in prefabricated abutments and CAD/
CAM abutments (Table 1, Fig. 1).
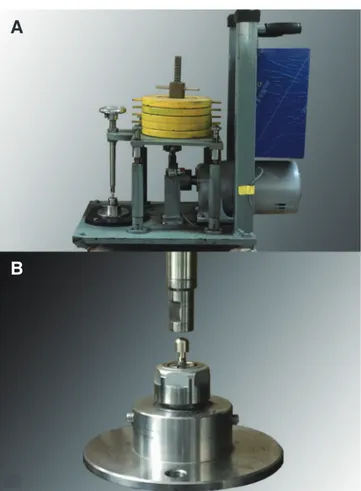
The custom-made cyclic loading device simulating verti- cal loads of human mastication was manufactured for this experiment (Hatis, Hwasung, Korea) (Fig. 2(A)).5,12 Implants were clamped into the holder (Nikken, Tokyo, Japan) with a torque wrench (230DB3, Tohnichi Co., Tokyo, Japan) at a torque of 300 Ncm. A hemispherical metal cap, which has been designed to mimic the presence of crown and prevent deformation of the abutment from the external load, was applied onto the abutment (Fig. 2(B)). Tightening torques of 30 Ncm were applied to the abutment screw according to the manufacturers’ recommendation, twice at 10 minutes intervals with a digital torque gauge (MGT50, Mark-10
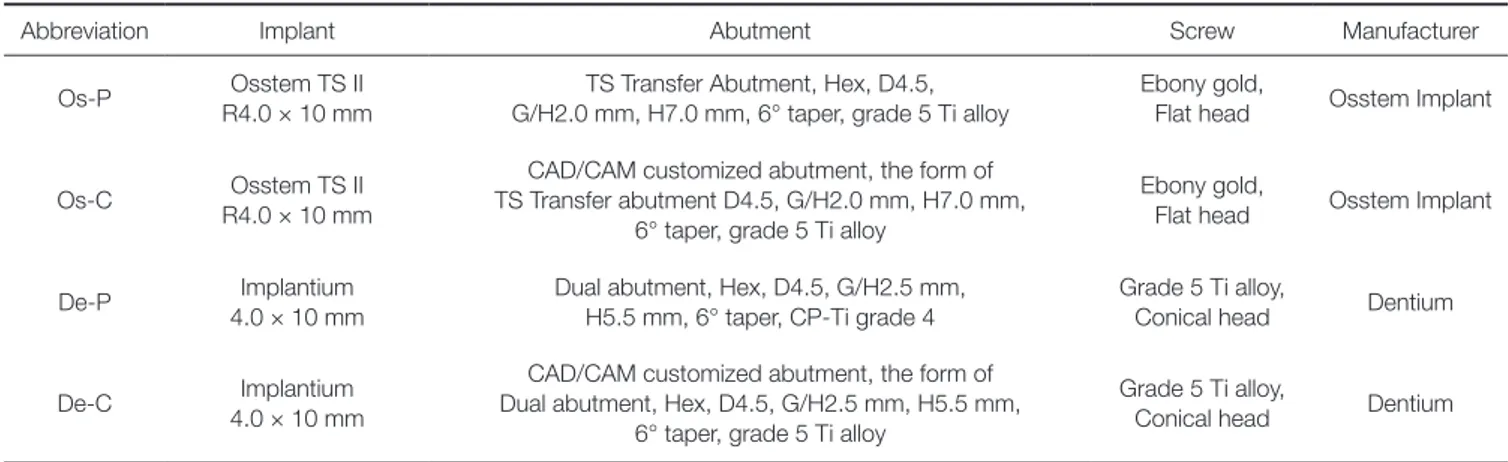
Table 1. The implant-abutment assemblies used
Abbreviation Implant Abutment Screw Manufacturer
Os-P Osstem TS II
R4.0 × 10 mm
TS Transfer Abutment, Hex, D4.5, G/H2.0 mm, H7.0 mm, 6° taper, grade 5 Ti alloy
Ebony gold,
Flat head Osstem Implant
Os-C Osstem TS II
R4.0 × 10 mm
CAD/CAM customized abutment, the form of TS Transfer abutment D4.5, G/H2.0 mm, H7.0 mm,
6° taper, grade 5 Ti alloy
Ebony gold,
Flat head Osstem Implant
De-P Implantium
4.0 × 10 mm
Dual abutment, Hex, D4.5, G/H2.5 mm, H5.5 mm, 6° taper, CP-Ti grade 4
Grade 5 Ti alloy,
Conical head Dentium
De-C Implantium
4.0 × 10 mm
CAD/CAM customized abutment, the form of Dual abutment, Hex, D4.5, G/H2.5 mm, H5.5 mm,
6° taper, grade 5 Ti alloy
Grade 5 Ti alloy,
Conical head Dentium
Corp., Copiague, NY, USA). Loads of 150 N, which was considered as the physiological occlusal force on the single posterior tooth,13-15 were applied at a frequency of 3 Hz for 106 cycles, simulating 1 year of function.5,16 Calibration was performed before each measurement using a load cell (MNC-500L, CAS Korea, Seongnam, Korea) and a strain analysis program (STT-200P, CAS Korea, Seongnam, Korea).
The total length of implant-abutment assembly was mea- sured with an electronic digital micrometer (No. 293-240, Mitutoyo) with accuracy up to 1 µm. As a reference point, the length of the implant-abutment assembly after tightening the abutment screw with 5 Ncm was measured.12 The length of each assembly was measured after initial with 30 Ncm.
Applying the vertical cyclic load, the length of the assembly was measured after 10, 102, 103, 104, 105, 5 × 10⁵ and 106 cycles and the change between the cycles were calculated (Fig. 3).5
After initial tightening with 30 Ncm twice at 10 minutes intervals, a digital torque gauge was used to measure the removal torque values.5,12,17 Then, after 106 cyclic loading, the removal torque was measured again in the same way. The reduction rate% was also calculated to compare among the groups: RTV reduction rate% = ((30 - RTV) / 30) × 100.12
After 106 cyclic loading, the abutment screw was removed to measure the removal torque value, and the tensile force required to dislodge the abutments from the implants was measured in a universal testing machine (Instron). Each abutment had a 1.2 mm diameter hole 3.5 mm below the top, through which a metal wire was passed to pull it. The implant was fixed at the bottom part of the machine, and then tensile force was applied at a speed of 0.5 mm/min until the abutment was dislodged.18
Fig. 1. Implant-abutment assemblies. In order from left to right: Os-P (Osstem TS II implant - Prefabricated TS trans- fer abutment, Osstem Implant), Os-C (Osstem TS II implant - CAD/CAM customized abutment, Osstem Implant), De-P (Implantium implant - Prefabricated Dual abutment, Dentium), De-C (Implantium implant - CAD/
CAM customized abutment, Dentium).
Fig. 2. (A) Custom-made cyclic loading device designed to simulate vertical cyclic loads of human mastication (B) Implant-abutment assembly clamped into the implant holder.
A
B
Fig. 3. Illustration of each measurement point of axial displacement value, RTV and tensile removal force.
5 Ncm tightening Initial tightening 30 Ncm After 10 min. Retightening 30 Ncm Tightening 30 Ncm twice, 10-min interval
After cyclic loading Before cyclic loading
Cyclic loading 150 N, 3 Hz10
102 103 104 105
5 × 10⁵ 106
Measuring length of assembly (Base line)
Axial displacement measurement RTV measurement
Axial displacement measurement Axial displacement measurement Axial displacement measurement Axial displacement measurement Axial displacement measurement Axial displacement measurement
Axial displacement measurement RTV measurement
Tensile removal force measurement
A repeated measures analysis of variance (ANOVA) and a pattern analysis based on the regression model with loga- rithmic transformation were performed to evaluate the effect of cyclic loading on the axial displacement of the abutment.
The Wilcoxon signed-rank test was conducted to compare before and after RTVs within each group. The Mann- Whitney U test was used to compare the RTV reduction rates before and after cyclic loading and the tensile removal force after cyclic loading between the groups. Pearson corre- lation analysis was performed to analyze the relationship between the axial displacement value, the RTV reduction rate and the tensile removal torque. Statistical analyses were performed with SPSS statistical software (IBM SPSS ver.
22.0, IBM Corp, Armonk, NY, USA). The P value of less than 0.05 was considered statistically significant.
RESULTS
The length assembly at 5 Ncm tightening was determined as the baseline,16 and the axial displacement of the abutment after initial tightening with 30 Ncm was measured. The axial displacement value after initial tightening was significantly greater in CAD/CAM abutments (Os-C) in group Os, but it was greater in prefabricated abutments (De-P) in group De (P < .05). After 106 cyclic loading, there was no significant difference between prefabricated abutments and CAD/CAM abutments in both group Os and group De (Table 2).
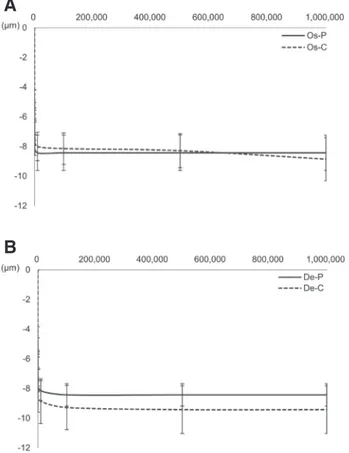
The axial displacements after various cyclic loadings are shown in Table 2 and Fig. 4. After cyclic loading, the axial displacement values were significantly increased up to 104 cycles (P < .05), but after that, no significant increase was observed. No significant difference was found between the
prefabricated abutments and the CAD/CAM abutments at any number of cycles (P > .05). After 106 cyclic loading, no significant difference was found between the prefabricated abutments and the CAD/CAM abutments (P > .05).
To analyze the estimated effect, the regression model was constructed with logarithmic transformation of both the axi- al displacement values and the number of cycles (Table 3, Fig. 5). In all groups, the linearity on logarithmic transforma- tion was observed (P < .05).
The RTVs and the RTV reduction rate% before and after cyclic loading are presented in Table 4. The RTVs after 106 cyclic loading were significantly lower than those before cyclic loading in all groups (P < .05). There was no signifi- cant difference in RTV reduction rate% between the prefab- ricated abutments and the CAD/CAM abutments before cyclic loading. However, after 106 cyclic loading, it was great- er in the CAD/CAM abutments than the prefabricated abut- ments in both manufacturer groups (P < .05).
After 106 cyclic loading, the abutment screws were removed measuring RTVs. Even after that, all the abutments were sustained in implants and only after tensile force was applied, they were removed from the implants. Mann- Whitney U test revealed no significant difference between the prefabricated abutments and the CAD/CAM abutments in both manufacturer groups (Table 4).
Pearson correlation analysis was performed for demon- strating the relationship between the axial displacement, the removal torque reduction, and the tensile removal force after cyclic loading (Table 5). In Os group, the significant relation- ship between these three values was observed, whereas no significant relationship was found between any values in De group.
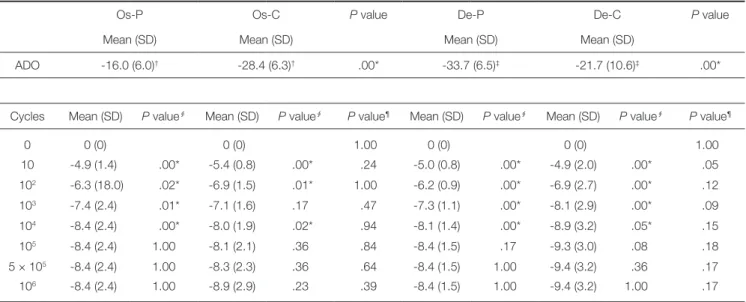
Table 2. Mean (standard deviation) axial displacement (µm) after initial tightening with 30 Ncm and after cyclic loading
Os-P Os-C P value De-P De-C P value
Mean (SD) Mean (SD) Mean (SD) Mean (SD)
ADO -16.0 (6.0)† -28.4 (6.3)† .00* -33.7 (6.5)‡ -21.7 (10.6)‡ .00*
Cycles Mean (SD) P value∮ Mean (SD) P value∮ P value¶ Mean (SD) P value∮ Mean (SD) P value∮ P value¶
0 0 (0) 0 (0) 1.00 0 (0) 0 (0) 1.00
10 -4.9 (1.4) .00* -5.4 (0.8) .00* .24 -5.0 (0.8) .00* -4.9 (2.0) .00* .05
102 -6.3 (18.0) .02* -6.9 (1.5) .01* 1.00 -6.2 (0.9) .00* -6.9 (2.7) .00* .12
103 -7.4 (2.4) .01* -7.1 (1.6) .17 .47 -7.3 (1.1) .00* -8.1 (2.9) .00* .09
104 -8.4 (2.4) .00* -8.0 (1.9) .02* .94 -8.1 (1.4) .00* -8.9 (3.2) .05* .15
105 -8.4 (2.4) 1.00 -8.1 (2.1) .36 .84 -8.4 (1.5) .17 -9.3 (3.0) .08 .18
5 × 10⁵ -8.4 (2.4) 1.00 -8.3 (2.3) .36 .64 -8.4 (1.5) 1.00 -9.4 (3.2) .36 .17
106 -8.4 (2.4) 1.00 -8.9 (2.9) .23 .39 -8.4 (1.5) 1.00 -9.4 (3.2) 1.00 .17
Negative value means the decrease of total lengths of implant-abutment. ADO: the axial displacement after initial tightening from the base line (5 Ncm tightening).
* : significant differences were found (< .05). Symbols (†, ‡) indicate significant differences between the values (P < .05, Mann-Whitney U test). A repeated measures ANOVA revealed significant increase only up to 104 cyclic loading (P value∮< .05), and no significant difference was found between the prefabricated abutments and the CAD/CAM abutments at any number of cycle (P value¶ > .05). P value∮: compared with the axial displacement value of previous cycle, P value¶: compare CAD/
CAM abutments to prefabricated abutments
Table 4. Mean (standard deviation) RTVs (Ncm) and RTV reduction rate% before and after 106 cyclic loading and ten- sile removal force (N) after 106 cyclic loading
RTV (Ncm) (Mean (SD))
RTV reduction rate%
(Mean (SD))
Tensile removal force (N) (Mean (SD)) before after P value† before P value‡ after P value‡ Tensile force P value∮
Os-P 24.57 (0.61) 16.71 (0.81) .02 18.10 (2.02) .16 44.29 (2.70) .01 47.03 (3.47) .85
Os-C 23.71 (1.29) 14.36 (1.65) .02 20.95 (4.29) 52.14 (5.50) 47.39 (7.66)
De-P 23.50 (0.58) 17.79 (0.64) .00 21.67 (1.92) .52 40.71 (2.12) .00 49.71 (5.47) .75
De-C 23.57 (1.79) 13.29 (2.58) .00 21.43 (5.97) 55.71 (8.60) 50.53 (6.81)
P value†: calculated by comparing the values before and after RTVs using Wilcoxon signed-rank test. P value‡: calculated by comparing the RTV reduction rates of prefabricated abutments and CAD/CAM abutments (Os-P vs Os-C; De-P vs De-C) using Mann-Whitney U test. P value∮: Mann-Whitney U test revealed no significant difference of tensile removal force between prefabricated abutments and CAD/CAM abutments. RTV = Removal torque values; RTV reduction rate% = (30 - RTV) / 30.
Fig. 4. Axial displacements of the abutments after various cyclic loading. (A) Os group, (B) De group.
A
B
Fig. 5. Estimated effects of the number of cyclic loading to the axial displacement in logarithmic regression mod- el. The coefficients of regression are presented in Table 3.
(A) Os group, (B) De group.
A
B
Table 3. Logarithmic regression as a linear model
B1 B2 R2 P value
Os-P 4.87 0.30 0.84 .01
Os-C 5.31 0.25 0.92 .00
De-P 4.82 0.29 0.90 .00
De-C 4.90 0.37 0.88 .01
The linearity was obtained in all groups (P < .05). X = B1 + B2 ln (Y) (X = the values of axial displacement; Y = the number of cycles). R2: coefficient of determination.
DISCUSSION
The null hypothesis was rejected because a significant differ- ence was found in the RTV reduction rate% between prefab- ricated abutments and CAD/CAM abutments (P < .05), even though no significant differences were found in the axi- al displacement and the tensile removal force (P > .05).
The axial displacement occurred in all groups with initial tightening of the abutment screws. This could be explained by the phenomenon known as ‘settling effect’.19 This phe- nomenon is based on the inherent geometric character of the conical connection structure. When the cone-shaped abutment is placed into the implant lightly, at the first moment, not all areas of the interface between the abutment and the implant are in contact. This uneven contact is inevi- table due to the manufacturing tolerance. After the axial force is transmitted by the abutment screw tightening with manufacturers’ recommended torque, the axial displacement of the abutment into the implant occurs.20-22 The axial dis- placement after initial tightening was greater in Os-C than Oc-P; however, it was greater in De-P than De-C (P < .05) (Table 2). From the results of the group Os, which used pre- fabricated abutments and CAD/CAM abutments, both grade 5 Ti alloy, it could be speculated that more uneven contact occurred at the interface between the abutment and the implant in CAD/CAM abutments than in prefabricated abutments, thus more axial displacement occurred in CAD/
CAM abutments after initial tightening. Since the prefabricat- ed abutments used in group De-P were made of CP-Ti grade 4 and the CAD/CAM abutments used in group De-C were grade 5 Ti alloy, the difference in axial displacement between group De-P and De-C could be due to different abutment materials that could affect the deformation of the surface. Jo et al.23 showed that the settlement of the CP-Ti grade 4 abutments after mechanical loading was greater than that of grade 5 Ti alloy abutments. Additional studies with CAD/CAM abutments made of different materials are needed.
After cyclic loading, the axial displacement occurred in all groups and no significant difference was found between prefabricated abutments and CAD/CAM abutments. The axial displacement values were significantly increased up to 104 cycles (P < .05). After that, no significant increase was
observed. The axial displacement values after 106 cycles of CAD/CAM abutments were not significantly different from prefabricated abutments (Os-P = 8.4 ± 2.4 μm, Os-C = 8.9
± 2.9 μm, De-P = 8.4 ± 1.5 μm, De-C = 9.4 ± 3.2 μm). The linearity on logarithmic transformation was observed in all groups, and this result suggests that the axial displacement occurs continuously even after 106 cyclic loading. Further studies with an increased number of cycles greater than 106 to reflect the longer clinical use are required.
The RTVs were decreased in all groups after initial tight- ening when no mechanical load was applied.18,20,24 It could be explained by ‘settling effect’ mentioned above, which can cause the decrease of preload. This is why it is recommend- ed to retighten the retention screw 10 minutes after the ini- tial tightening.8,24,25 According to the previous study by Breeding et al.,24 the deformation of the interface of compo- nents may cause a loss of preload by 2% to 10%. The torque reduction obtained in the present study was beyond this range (Os-P = 24.57 ± 0.61%, Os-C = 23.71 ± 1.29%, De-P
= 23.50 ± 0.58%, De-C = 23.57 ± 1.79%), similar to the results of Assunção et al.22 There was no significant differ- ence between prefabricated abutments and CAD/CAM abutments. After 106 cyclic loading, however, the RTV reductions were greater in CAD/CAM abutments than in prefabricated abutments (Os-P = 44.29 ± 2.70%, Os-C = 52.14 ± 5.50%, De-P = 40.71 ± 2.12%, De-C = 55.71 ± 8.60%). Preload loss may be influenced by physical properties of the screws, such as materials, design, composition, dimensions, and friction between surfaces.26-29 Since the same type of screws were used in prefabricated abutments and CAD/CAM abutments, the differences of RTV reduction rate due to the abutment properties can be suggested.
Preload loss after cyclic loading might be caused by the axial displacement of the abutment, which allows the tension at the screw thread interface to be reduced.20 After settling effect by initial tightening, microroughness of the interface and friction may still be present. When external load is applied, the tension of the screw head to the abutment base and the thread interface was reduced and removal torque loss occurred.26,27,30 Therefore, it is recommended to retight- en the abutment screw several days after applying external load to the prosthesis. The results of this study indicate that CAD/CAM abutments are more prone to preload loss than Table 5. Pearson correlation coefficient (P value) demonstrating the relationship among the axial displacement, the removal torque reduction and the tensile removal torque
Os-P Os-C De-P De-C
AD / RR 0.925 (0.003)** 0.802 (0.030)* 0.409 (0.363) 0.088 (0.852)
AD / TF 0.942 (0.002)** 0.806 (0.029)* -0.002 (0.997) 0.624 (0.134)
RR / TF 0.824 (0.023)* 0.782 (0.038)* 0.232 (0.616) 0.287 (0.532)
AD: Axial displacement, RR: RTV reduction%, TF: Tensile removal force.
**: The correlation is significant at the 0.01 level, *: The correlation is significant at the 0.05 level.
prefabricated abutments. It may be caused by the greater ten- dency of micromotion of the abutments and microgap between the screw head and the abutment base due to the manufacturing method. Further studies with misfit and microgap of interfaces of CAD/CAM abutments relating to the fabrication methods are needed.
In all groups, even after the abutment screws were removed after cyclic loading, all the abutments remained in implants, and only after the tensile force was applied, the abutments dislodged from the implants. This suggested that the friction increased due to increased surface contact between the interfaces by the axial load.31 In the Morse taper system, lateral loading is resisted mainly by the taper inter- face, known as positive or geometric locking, which is responsible for protecting the abutment threads from exces- sive functional load.1 The results of this study suggest that the micromovement of the abutment generated in abut- ment-implant interface contribute to the connection stability.
That is, the friction at the abutment-implant interface is a major determinant of the connection stability, and the abut- ment screw acts as a supportive role to the abutment reten- tion in Morse taper system. Clinically, this frictional force caused by the micromotion of the abutments after cyclic loading makes it difficult to remove the abutment from the implant when it is necessary.18 Tensile forces measured in this study were not significantly different among the groups (Os-P = 47.03 ± 3.47 N, Os-C = 47.39 ± 7.66 N, De-P = 49.71 ± 5.47 N, De-C = 50.53 ± 6.81 N). This result sug- gests that the connection stability due to the friction at the interface of CAD/CAM abutments may not be different from prefabricated abutments and the abutments may be dislodged from the implants when approximately 50 N is applied.
Theoretically, as the amount of axial displacement increas- es, the contact of interface becomes more intimate resulting in increasing tensile removal force and decreasing removal torque due to the loss of tension of the screw-abutment and the thread interfaces. However, the significant correlation among the axial displacement, the removal torque reduction, and the tensile removal force was observed only in Os group, and there was no significant correlation in De group.
Therefore, additional studies are needed to investigate the effect of fabricating methods.
Considering the limitations of in vitro studies, the experi- mental conditions were limited to hex-indexed abutments of single implant-supported prosthesis placed in a posterior region. It must be considered that the present study has limi- tations to simulate complex biomechanical properties in clin- ical condition. Thus, further in vitro and in vivo studies are necessary to evaluate the behavior of CAD/CAM abutments including the effect of the internal hexagonal index and the effect of the applying force of cyclic loading.
CONCLUSION
Within the limitations of this in vitro study, the following conclusions can be drawn. All groups presented significant
decreases of removal torque before and after cyclic loading compared to the initial torque. CAD/CAM abutments pre- sented a significantly greater removal torque reduction%
than prefabricated abutments after 106 cyclic loading.
However, the use of CAD/CAM abutment did not signifi- cantly affect the amount of axial displacement and tensile removal force after cyclic loading. The friction at the abut- ment-implant interface is a major determinant of the con- nection stability in Morse taper system, and this connection stability due to the friction at the interface of CAD/CAM abutments may not be different from prefabricated abut- ments.
ORCID
Yuseung Yi https://orcid.org/0000-0001-9116-2328 Seong-Joo Heo https://orcid.org/0000-0003-0699-4141 Jai-Young Koak https://orcid.org/0000-0002-0190-0778 Seong-Kyun Kim https://orcid.org/0000-0001-8694-8385 REFERENCES
1. Merz BR, Hunenbart S, Belser UC. Mechanics of the im- plant-abutment connection: an 8-degree taper compared to a butt joint connection. Int J Oral Maxillofac Implants 2000;15:
519-26.
2. Rack T, Zabler S, Rack A, Riesemeier H, Nelson K. An in vi- tro pilot study of abutment stability during loading in new and fatigue-loaded conical dental implants using synchrotron- based radiography. Int J Oral Maxillofac Implants 2013;28:44- 50.
3. Gehrke SA, Pereira Fde A. Changes in the abutment-implant interface in Morse taper implant connections after mechanical cycling: a pilot study. Int J Oral Maxillofac Implants 2014;29:
791-7.
4. Bozkaya D, Müftü S. Mechanics of the tapered interference fit in dental implants. J Biomech 2003;36:1649-58.
5. Seol HW, Heo SJ, Koak JY, Kim SK, Kim SK. Axial displace- ment of external and internal implant-abutment connection evaluated by linear mixed model analysis. Int J Oral Maxillofac Implants 2015;30:1387-99.
6. Norton MR. An in vitro evaluation of the strength of an in- ternal conical interface compared to a butt joint interface in implant design. Clin Oral Implants Res 1997;8:290-8.
7. Hansson S. Implant-abutment interface: biomechanical study of flat top versus conical. Clin Implant Dent Relat Res 2000;2:33- 41.
8. Siamos G, Winkler S, Boberick KG. Relationship between im- plant preload and screw loosening on implant-supported prostheses. J Oral Implantol 2002;28:67-73.
9. Gil FJ, Herrero-Climent M, Lázaro P, Rios JV. Implant- abutment connections: influence of the design on the micro- gap and their fatigue and fracture behavior of dental im- plants. J Mater Sci Mater Med 2014;25:1825-30.
10. Sumi T, Braian M, Shimada A, Shibata N, Takeshita K, Vandeweghe S, Coelho PG, Wennerberg A, Jimbo R.
Characteristics of implant-CAD/CAM abutment connections
of two different internal connection systems. J Oral Rehabil 2012;39:391-8.
11. Lee JH, Park JM, Park EJ, Koak JY, Kim SK, Heo SJ.
Comparison of customized abutments made from titanium and a machinable precious alloy. Int J Oral Maxillofac Implants 2016;31:92-100.
12. Park JM, Baek CH, Heo SJ, Kim SK, Koak JY, Kim SK, Belser UC. An in vitro evaluation of the loosening of differ- ent interchangeable abutments in internal-connection-type implants. Int J Oral Maxillofac Implants 2017;32:350-5.
13. Widmalm SE, Ericsson SG. Maximal bite force with centric and eccentric load. J Oral Rehabil 1982;9:445-50.
14. Richter EJ. In vivo vertical forces on implants. Int J Oral Maxillofac Implants 1995;10:99-108.
15. Rosentritt M, Behr M, Gebhard R, Handel G. Influence of stress simulation parameters on the fracture strength of all- ceramic fixed-partial dentures. Dent Mater 2006;22:176-82.
16. Delben JA, Gomes EA, Barão VA, Assunção WG. Evaluation of the effect of retightening and mechanical cycling on pre- load maintenance of retention screws. Int J Oral Maxillofac Implants 2011;26:251-6.
17. Cerutti-Kopplin D, Rodrigues Neto DJ, Lins do Valle A, Pereira JR. Influence of reverse torque values in abutments with or without internal hexagon indexes. J Prosthet Dent 2014;112:824-7.
18. de Oliveira Silva TS, Mendes Alencar SM, da Silva Valente V, de Moura CDVS. Effect of internal hexagonal index on re- moval torque and tensile removal force of different Morse ta- per connection abutments. J Prosthet Dent 2017;117:621-7.
19. Winkler S, Ring K, Ring JD, Boberick KG. Implant screw me- chanics and the settling effect: overview. J Oral Implantol 2003;29:242-5.
20. Jorge JR, Barao VA, Delben JA, Assuncao WG. The role of implant/abutment system on torque maintenance of reten- tion screws and vertical misfit of implant-supported crowns before and after mechanical cycling. Int J Oral Maxillofac Implants 2013;28:415-22.
21. Delben JA, Gomes EA, Barão VA, Assunção WG. Evaluation of the effect of retightening and mechanical cycling on pre- load maintenance of retention screws. Int J Oral Maxillofac Implants 2011;26:251-6.
22. Assunção WG, Barão VA, Delben JA, Gomes ÉA, Garcia IR Jr. Effect of unilateral misfit on preload of retention screws of implant-supported prostheses submitted to mechanical cy- cling. J Prosthodont Res 2011;55:12-8.
23. Jo JY, Yang DS, Huh JB, Heo JC, Yun MJ, Jeong CM.
Influence of abutment materials on the implant-abutment joint stability in internal conical connection type implant sys- tems. J Adv Prosthodont 2014;6:491-7.
24. Breeding LC, Dixon DL, Nelson EW, Tietge JD. Torque re- quired to loosen single-tooth implant abutment screws before and after simulated function. Int J Prosthodont 1993;6:435-9.
25. Dixon DL, Breeding LC, Sadler JP, McKay ML. Comparison of screw loosening, rotation, and deflection among three im- plant designs. J Prosthet Dent 1995;74:270-8.
26. Theoharidou A, Petridis HP, Tzannas K, Garefis P. Abutment screw loosening in single-implant restorations: a systematic
review. Int J Oral Maxillofac Implants 2008;23:681-90.
27. Burguete RL, Johns RB, King T, Patterson EA. Tightening characteristics for screwed joints in osseointegrated dental implants. J Prosthet Dent 1994;71:592-9.
28. Coelho AL, Suzuki M, Dibart S, DA Silva N, Coelho PG.
Cross-sectional analysis of the implant-abutment interface. J Oral Rehabil 2007;34:508-16.
29. Bernardes SR, da Gloria Chiarello de Mattos M, Hobkirk J, Ribeiro RF. Loss of preload in screwed implant joints as a function of time and tightening/untightening sequences. Int J Oral Maxillofac Implants 2014;29:89-96.
30. Geng JP, Tan KB, Liu GR. Application of finite element anal- ysis in implant dentistry: a review of the literature. J Prosthet Dent 2001;85:585-98.
31. Ricciardi Coppedê A, de Mattos Mda G, Rodrigues RC, Ribeiro RF. Effect of repeated torque/mechanical loading cy- cles on two different abutment types in implants with internal tapered connections: an in vitro study. Clin Oral Implants Res 2009;20:624-32.