I. Introduction
As doctors examine the condition of a patient or implement a physical examination, such a variety of methods are uti- lized, and especially the laboratory studies is widely used as it can produce reliable results within a short time. In labora- tory or examination results, above all, whether the values are within the reference interval should be confirmed to mea- sure the patient’s condition.
For standards similar to the reference interval, any of nor- mal value, predicted value, reference value, etc, used to be adopted to interpret laboratory results, but now the term ref- erence value is mainly defined as reference individuals satis- fying a certain standard or values measured from individuals who were defined as healthy [1-7].
An Improved Auto-Generation System to Obtain Reference Intervals for Laboratory Medicine
Hyung Hoi Kim, MD, PhD1, Hae Sook Hong, RN, PhD2, Shine Young Kim, MD, MS1,4, Tung Tran, PhD3,4, Ji Min Lee, RN, MS2,4, Hwa Sun Kim, RN, PhD3,4, Hune Cho, PhD3,4
1Department of Laboratory Medicine and Biomedical Informatics, College of Medicine, Pusan National University, Busan; 2Department of Nursing, College of Nursing, Kyungpook National University; 3Department of Medical Informatics, College of Medicine, Kyungpook National University; 4MIPTH, Kyungpook National University, Daegu, Korea
Objectives: Reference values are highly required parameters for all tests in the clinical laboratory, and the supplementary provision of reliable reference intervals is an important task for both clinical laboratories and diagnostic test manufactur- ers. Despite the progress that has been made in the conceptual aspects of reference intervals, in practice their use is still not completely satisfactory. Most of the laboratories have used various methods to calculate statistic-based reference intervals, and they have mainly focused on extracted data, yet its use is considerably limited. We had to deal with the inconvenience of using a number of programs (SPSS or SAS, MS Excel) in order to calculate the results of reference intervals. Methods: In order to obtain standardized reference intervals, we developed an integrated program that can calculate, by a nonparametric method, reference intervals with using the Clinical and Laboratory Standards Institute (CLSI) processes as its guideline. We also developed a grouping interface that enables users to customize classification of each group (age, gender, blood group, race, etc) when calculating reference intervals. Results: To verify the developed program, we compared the reference inter- vals of the current data on 281 persons for 8 total areas, and the reference intervals were was already calculated beforehand with by using this new program. As a result, both results perfectly matched. Conclusions: This integrated program will be convenience for calculating reasonable values through continual datainspection at an inspection lab for calculating reference intervals. The newly developed program will improve the consistency and reliability of the statistics on reference intervals.
Keywords: Reference Values, Diagnostic Test
Healthc Inform Res. 2010 March;16(1):15-21.
doi: 10.4258/hir.2010.16.1.15 pISSN 2093-3681 • eISSN 2093-369X
Received for review: June 30, 2009 Accepted for publication: March 16, 2010 Corresponding Author
Hwa Sun Kim, RN, PhD
Department of Medical Informatics, College of Medicine, Kyungpook National University, 101 Dongin-dong 2-ga, Jung-gu, Deagu 700-422, Korea. Tel: +82-53-420-4896, Fax: +82-53-423-1242, E-mail: pu- lala@paran.com
This is an Open Access article distributed under the terms of the Creative Com- mons Attribution Non-Commercial License (http://creativecommons.org/licenses/by- nc/3.0/) which permits unrestricted non-commercial use, distribution, and reproduc- tion in any medium, provided the original work is properly cited.
ⓒ 2010 The Korean Society of Medical Informatics
There was no generalized principle or prototype of a method to collect laboratory results in any laboratory room or healthcare organization until 1980s, and even the use and interpretation of reference values acquired from col- lected specimen were controversial. In addition, the need to introduce a concept to manage the results in all labora- tory rooms for accurate diagnosis and treatment started to be recognized. For this reason, in late 1980s, International Federation of Clinical Chemistry and Laboratory Medicine (IFCC) reference value committee insisted that there should be a generalized method to set reasonable reference values or reference scope, and thereafter, consistent research and development has been in progress.
Although the concept of reference value has yet to be com- plemented and revised, the most important in it is to draw out reference values (health-associated reference value) from people defined as healthy [2]. This is vital since whether the examined one is normal or has any disease, the extent of the disease, if any, and the effects of treatment can be accurately compared and judged only by means of such laboratory re- sults of healthy subjects.
As to the method to set the reference value from subjects defined as healthy, first, the reference population is set, and the reference sample group is selected from them; then a survey or physical examination is conducted for this group;
the specimen of subjects defined as normal in every step was analyzed; a statistical analysis follows through a parametric procedure or nonparametric procedure to achieve the reli- able reference scope [3].
The reference value is necessary for all inspections in medi- cal diagnosis, and it is of great importance for manufactur- ers of devices related to diagnosis laboratory rooms and diagnosis laboratory studies. In spite of such importance of the reference value and efforts taken forth to provide more accurate, convenient, and easier setting method, the cur- rently used reference value and the setting methods are not satisfactory.
So far, various methods have been adopted to calculate reference values in most of laboratory rooms, and mainly by means of such programs as SPSS, SAS, MS Excel, etc, count- less data of results have been manually input and extracted.
Such methods cause not only inconvenience in manually inputting the results to calculate the reference value, but also limitations in setting reference values as the inspector or user (eg, doctor, researcher, etc) desires according to various factors such as age, gender, race, pregnancy, smoking, mea- suring method, measuring, device, etc, that affect the setting of reference values. Though the Clinical and Laboratory
Standards Institute (CLSI) recommends to exclude outliers and to make group of reference interval prior to calculat- ing reference intervals, there is no convenient tool to carry out the task. Therefore, this study aims to achieve the stan- dardized reference value in an easier way, and develop the integrated program including non-parametric methods as well as the methods to exclude outlier and set the reference scope presented in CLSI guideline [3]. Besides, included is the development of a grouping interface that enables users to make groups according to gender, age, race, etc, in calcula- tion of the reference value. By comparing the results from the existing reference value setting methods and those from the newly developed program, the efficiency of the new ref- erence value setting program is investigated.
II. Methods
1. Calculating Non-parametric Confidence Intervals Us- ing Percentiles
The percentile approach makes no assumptions of the data but is less reliable when the data are normally distributed.
The order statistics are X1 ≤ X2 ≤ … ≤ Xn. The median or lower and upper quartiles are the non-parametric confidence intervals. The reference value range is equal to the range of numbers which maximum value minus minimum value.
If the sample size is larger than 120, the confidence interval equals 90%; if the size of the sample is larger than 153, the confidence interval equals 95% [8]. Linnet [9] proposes that up to 700 should be obtained for highly skewed distributions of results. But, CLSI supports the recommended minimum of 120 reference subjects, as a standard for general practice [9]. So, the alarm systems for small samples (less than 120) or for large skewness were developed for reliable results. As- sume that α = (100 confidence interval)/2. The upper value is located at the 100 × (1-α)th percentile, and the lower value is located at (100 × α)th percentile. By CLSI guideline recom- mendation, we calculate the 95% reference interval as the 2.5th and 97.5th percentile.
2. Treatment of Outliers
The process for treatment of outlying observations and par- titioning of reference values were also developed as CLSI recommendation. They recommend use, namely, the ratio D/R, where D is the absolute difference between an extreme observation (large or small) and the next largest (or smallest) observation, and R is the range of all observations, including extremes [10]. And 1/3 is suggested as the cut-off value [8].
When any outlier was rejected, the excluding outlier pro-
cess by the D/R rule was performed until no outlier was present. Nonparametrically estimated reference limits based on at least 120 observations, even if an extreme value were deleted. After excluding outliers, the sample size would be recounted automatically to ensure that it would be more than 120 or not.
3. Partitioning of Reference Values
It is generally assumed that as long as the difference be- tween the observed means of two subclasses is statistically significant, then each subclass should have its own reference interval. But, if any observed difference has no clinical im- portance, the difference between the sub class means which is at least 25% as large as the 95% reference interval from the combined sample of reference subject, is recommended as cut-off to partitioning [11]. Also, CLSI recommended con- sider the possibility of subclass reference intervals with re- spect to the analytes concerned, before the actual calculating
of reference intervals, and all subclass should have at least 120 samples.
We developed pre-partitioning and post-partitioning pro- cess. Pre-partitioning process enabled user to define the pos sible subclass before calculating of reference intervals.
Post-partitioning process is to find subclass exist. It was di- vided in two stages according to CLSI guideline. First stage is beginning with a pilot sample in each subclass, and for two subclasses, the statistical significance of the difference between subclass means was tested by the standard normal deviate test. More than three subclasses were not considered in this study.
4. Checking Skewness and Kurtosis
Skewness characterizes the degree of asymmetry of a dis- tribution around its mean. Positive skewness indicates a distribution with an asymmetric tail extending toward more positive values, whereas negative skewness indicates a distri-
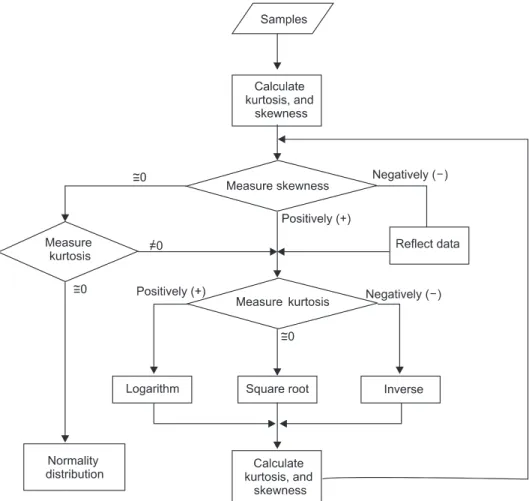
Figure 1. The flowchart to check skewness and kurtosis. Skewness is the degree of departure from symmetry of a distribution. A posi- tively skewed distribution has a tail reaching in the positive direction, whereas a negatively skewed distribution has a tail reaching in the negative direction. Kurtosis is the degree of peakedness of a distribution. The three types of peakedness are normal distribution, flat distribution (negative kurtosis), and peaked distribution (positive kurtosis).
bution with an asymmetric tail extending toward more nega- tive values. Kurtosis characterizes the relative peakedness or flatness of a distribution compared to a normal distribution.
Positive kurtosis indicates a relatively peaked distribution, and negative kurtosis indicates a relatively flat distribution.
In nonparametric method according to CLSI guideline, large skewness or kurtosis influence reliability of reference intervals. The larger skewness of sample claims the larger sample size [9]. The skewness and kurtosis were calculated and high values of them were alarmed for user to ensure that the sample size is large enough or not.
5. The Flowchart to Check Skewness and Kurtosis
We used an algorithm described in Figure 1 to transform the data, because large skewness or kurtosis result poor reliabil- ity of reference intervals. This processing was only applied for rare case that the reference distribution had not adequate number of reference sample for their skewness or kurtosis and it was not possible to gather more reference sample.
The application first calculates kurtosis and skewness. If skewness is negative, the application corrects the data and then check kurtosis. If skewness is positive, the application checks kurtosis. After checking kurtosis, the application se- lects the relevant transformation method to transform data to bring the distribution closer to normal.
If skewness is close to zero, the application checks kurtosis.
If kurtosis is nonzero, the application selects the relevant method to transform the data. If kurtosis is close to zero, the sample data are normally or near-normally distributed.
The application checks whether the sample data are nor- mally or near-normally distributed after transformation. If not, the application repeats the process until skewness and kurtosis values approach zero.
III. Results
We developed software to calculate reference rank values from excel files. We used visual studio .NET 2005 C# (Mi- crosoft Corp., Redmond, WA, USA) to develop the software.
The application is suitable for Dot Net Framework 2.0.
In hospitals, many old laboratory test devices cannot au- tomatically generate data. We manually collected the data in excel files and then calculated the reference values. This method was convenient because we have to apply numerous statistical functions. We developed the software to program- matically open and process the collected data. We developed the non-parametric method for cases in which the sample size is greater than 120 and the sample data are normally distributed. Once the excel file with the collected data is opened, the software presents the collected data as shown in Figure 2.
After loading the data, the user can use the descriptive menu to review data characteristics. The software can detect whether the data are normally or non-normally distributed using the skewness and kurtosis checks. The alarm screen was applied for small samples (less than 120) or for large skewness with insufficient sample size for reliable reference intervals.
1. Descriptive Data
In this method, the user selects the kind of data presented.
The user can select sub-groups such as age and gender.
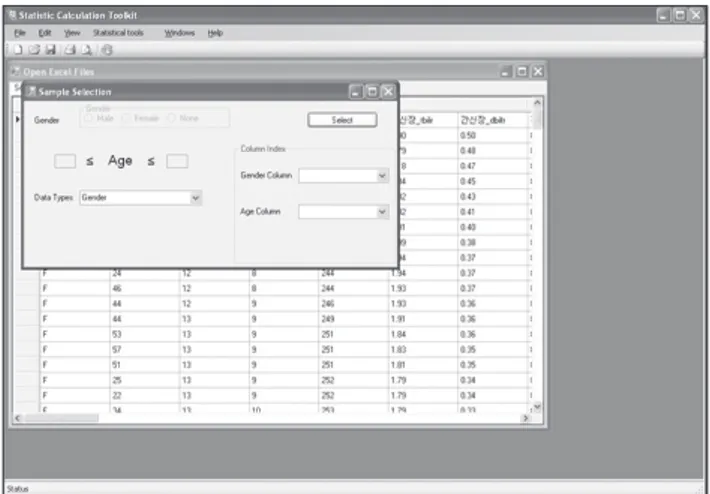
Within the age subgroup, the user can select a range of ages by inputting minimum and maximum age limits (Figure 3).
The software displays data according to the selection con- ditions. The software represents the selection data in a grid table and also calculates mean, standard deviation, and quartiles after checking sample size and dismissing outli-
Figure 2. Loading collected data from Excel file. Figure 3. Selection condition for data.
ers. In Figure 4, the application displays the mean, standard deviation, quartiles, 2.5th percentile, and 97.5th percentile for selected data. Additionally, the application provides graphic charts of data characteristics. Four types of graphic charts are available, and the user can check radio buttons to select among them.
2. Reference Value
The user opens the excel file and then selects the reference value menu in the toolbar. A selection-condition user inter- face appears, and the user sets age and gender. The interface loads all types of data and processes them in the group box, and the user can check boxes to select which data are dis- played. If the user does not input age limits, the application uses the default range of 1 to 100 years old.
After subgroup data are selected, the application calculates kurtosis and skewness to measure the degrees of peakedness and departure from symmetry of the distribution.
If the skewness or peakedness is large enough to claim more samples and no more observation acquisition is avail- able, the data transformation is used to bring the distribution closer to normal. Transformation is a remedy for outliers and failures of normality.
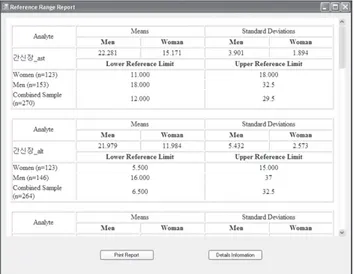
We use an algorithm described in Figure 1 to transform the data. After transformation, the application calculates quar- tiles to remove outliers and then determines the 2.5th percen- tile and 97.5th percentile reference values. Figure 5 shows the printable results for the sample data.
3. Program Test
We attempted to compare the reference result values gener- ated by doctors in hospitals previously using excel and SPSS program in person with the result values generated by using the program developed. To obtain the data of the reference result values, 281 patients were randomly extracted among
the group of people that received a comprehensive medical testing at the examination center of Busan National Univer- sity Hospital during one year from 2007 until 2008. The data were composed as below.
The blood section included 13 sub menus– wbc, mcv, mch, mchc, plt, neut, lym, mono, eosin, baso, rbc, hgb and hct;
urine examination had four– sg, ph, rbc, and wbc; cancer markers contained alpha-fetoprotein and carcinoembryonic antigen; thyroid gland examination had two– free and tsh;
CPR and blood glucose included two– gluc and ins; the lipid section had five– chol, trig, hdl, ffa, and ldl; and liver exami- nation included 15– ast, alt, ldh, t bil, d bil, tp, alb, bun, cr, ua, gtt, phos, calc, alp, and cys. The data have total 8 sections and 43 sub menus.
To verify the developed program, we compared reference intervals result of current data on 281 persons of total of 8 areas which was already calculated before with the result of using this program. As a result, both results perfectly matched.
IV. Discussion
It is universally obvious that more than a thousand labora- tory tests are performed daily in most tertiary care hospitals.
One of the primary roles for the laboratory physician is to evaluate and determine reference interval for each test. The auto-generation program is found to efficiently enhance reference interval for clinical laboratory. According to CLSI guideline, the non-parametric method is recommended for defining reference interval because it is far simpler than parametrical methods. The determination of clinically re- liable reference intervals depends upon multiple factors:
Figure 4. Represent data graphic user interface.
Figure 5. Print report screen.
proper selection of reference subjects, testing an adequate number of subjects, and avoidance of pre-analytical source of errors, and so on. Therefore, conventional methods such as rudimentary statistical estimates from the observed data should be eliminated [3].
In this study, we have developed an automated software tools to help generate reference intervals based on non- parametric method that automates outlier entry with easy process.
There is room for doubt that the reference intervals cur- rently used in many hospitals or health institutions are appropriate, because some scientists do not agree that the selections of reference individuals were valid universally. If we adopt the inappropriate reference intervals in the deci- sion making of examinees’ health status, we are liable to lead to false-negatives or false-positives. Despite progress in the conceptual aspects of reference values [12-16], in practice their use is still not entirely satisfactory [17].
What is important in interpreting diagnosis result using the reference range is how healthy the person is; however, measured values can differ by the entity’s biological or so- cioeconomic status or the patient’s condition from whom the sample is extracted. It includes the patient’s age, gender, place of origin, race, smoking, dietary state, or posture of the time the sample is extracted. Therefore, in such case, refer- ence values should be subdivided by age, gender, race, place of origin, dietary state, and the state of the sample extracted.
Moreover, it should be considered when the subdivision is necessary to set reference values, and when the mean values of the sub groups have large difference, it needs to be subdi- vided.
Conflict of Interest
No potential conflict of interest relevant to this article was reported.
Acknowledgements
This article is based on research supported by the R&D Pro- gram of MKE/KEIT (KI10033576, KI10033545). The authors also thank Roche Diagnostics Korea for their support on this article.
References
1. Lee JC, Kim SK, Lee CK, Lee SG, Lee HS, Cho KJ. Estab- lishment of reference value using Korean adult medical
checkup data and interpretation of test results. J Lab Med Qual Assur 2006; 28: 229-237.
2. Sasse EA. Objective evaluation of data in screening for disease. Clin Chim Acta 2002; 315: 17-30.
3. Clinical and Laboratory Standards Institute. How to define and determine reference intervals in the clinical laboratory: approved guidelines. 2nd ed. Wayne (PA):
Clinical and Laboratory Standards Institute; 2000. p1- 36.
4. PetitClerc C, Wilding P. International Federation of Clinical Chemistry (IFCC), Scientific Committee, Clinical Section. The theory of reference values. Part 2.
Selection of individuals for the production of reference values. J Clin Chem Clin Biochem 1984; 22: 203-208.
5. Alstrom T, Grasbeck R, Hjelm M, Skandsen S. Recom- mendations concerning the collection of reference val- ues in clinical chemistry and activity report by the Com- mittee on Reference Values of the Scandinavian Society for Clinical Chemistry and Clinical Physiology. Scand J Clin Lab Invest Suppl 1975; 144: 1-44.
6. Berg B, Solberg HE, Nilsson JE, Tryding N. Practical experience in the selection and preparation of reference individuals: empirical testing of the provisional Scandi- navian recommendations. In: Solberg HE, Grasbeck R, Alstrom T, eds. Reference values in laboratory medicine.
Chichester (UK): John Wiley & Sons; 1981. p55-64.
7. Statland BE, Winkel P. Reference values: are they useful?
Clin Lab Med 1984; 4: 61-70.
8. Reed AH, Henry RJ, Mason WB. Influence of statistical method used on the resulting estimate of normal range.
Clin Chem 1971; 17: 275-284.
9. Linnet K. Two-stage transformation systems for normal- ization of reference distributions evaluated. Clin Chem 1987; 33: 381-386.
10. Dixon WJ. Processing data for outliers. Biometrics 1953;
9: 74-89.
11. Sinton TJ, Cowley DM, Bryant SJ. Reference intervals for calcium, phosphate, and alkaline phosphatase as derived on the basis of multichannel-analyzer profiles.
Clin Chem 1986; 32: 76-79.
12. Grasbeck R. The evolution of the reference value con- cept. Clin Chem Lab Med 2004; 42: 692-697.
13. PetitClerc C, Wilding P. International Federation of Clinical Chemistry (IFCC), Scientific Committee, Clinical Section. The theory of reference values. Part 2.
Selection of individuals for the production of reference values. J Clin Chem Clin Biochem 1984; 22: 203-208.
14. Solberg HE, PetitClerc C. Approved recommendation
(1988) on the theory of reference values. Part 3. Prepa- ration of individuals and collection of specimens for the production of reference values. Clin Chim Acta 1988;
177: S3-S11.
15. Dybkaer R. International federation of clinical chem- istry (IFCC)1),2) the theory of reference values. Part 6.
Presentation of observed values related to reference val- ues. J Clin Chem Clin Biochem 1982; 20: 841-845.
16. Grossi E, Colombo R, Cavuto S, Franzini C. The RE- ALAB project: a new method for the formulation of ref- erence intervals based on current data. Clin Chem 2005;
51: 1232-1240.
17. Henny J, Petitclerc C, Fuentes-Arderiu X, Petersen PH, Queraltó JM, Schiele F, Siest G. Need for revisiting the concept of reference values. Clin Chem Lab Med 2000;
38: 589-595.