Introduction
Manganese (Mn) is an essential nutrients for normal metab- olism of protein, fat and carbohydrate. This micronutrient also intervenes with regulation of various physiological processes such as immune function, energy metabolism, reproduction, digestion and skeletal development [1]. Previous animals stud- ies reported that Mn deficit conditions impair normal growth, reproductive function, insulin sensitivity, lipid metabolism and lower blood HDL cholesterol [1,2]. Mn deficiency was associat- ed with erythematous rash, emotional changes and pain dur- ing the pre-menstruation period in clinical and epidemiological studies [1-3]. Such metabolic disorders and diseases under Mn deficiency are attributed to loss of regulation in oxidative stresses.
Clin Nutr Res 2012;1:30-36
http://dx.doi.org/10.7762/cnr.2012.1.1.30 pISSN 2287-3732 ∙ eISSN 2287-3740
Daily Manganese Intake Status and Its Relationship with Oxidative Stress Biomarkers under Different Body
Mass Index Categories in Korean Adults
So-Young Bu
1, Mi-Kyeong Choi
2*
1
Division of Food Science, Kyungil University, Gyeongsan 712-701, Korea
2
Division of Food Science, Kongju National University, Yesan 340-702, Korea
Manganese (Mn) is an essential micronutrient for human and plays an important role as a cofactor for several enzymes involv- ing fatty acid synthesis, hepatic gluconeogenesis, and oxidative stresses. Also, Mn intake status has been reported to have ben- eficial effects in reversing metabolic dysfunction including obesity and nonalcoholic steatosis which is linked to mitochondrial dysfunction and oxidative stresses, however, information on dietary Mn intake in Koreans are limited. Hence we investigated the relationship between dietary Mn intake and antioxidant defense factors in healthy and obese subjects. Total of 333 healthy subjects were recruited in the study and were assigned to one of three study groups: a normal group (18.5-22.9), a overweight group (23-24.9), and a obesity group (>25) according to their body mass index (BMI). We assessed Mn intakes (24-hr recall method) and several indicators for antioxidative defenses such as glutathione (GSH), glutathione peroxidase (GPx) and urinary malonaldehyde (MDA). Results showed that body weight and blood pressure of study subjects were increased in dependent of their BMI (p < 0.01). However dietary Mn intakes and oxidative stress biomarkers (GSH, GPx, and MDA) were not significantly different by groups defined by BMI. In correlation analysis adjusting for age, sex and energy intake, dietary Mn intake of the subjects in different BMI categories were not significantly correlated with GSH, GPx, MDA and showed a weak or no associa- tion with these oxidative stress markers. In conclusion dietary Mn intake at least in this study has a little or no influence on markers of oxidative status in both healthy and obese subjects.
Key Words: Manganese, Glutathione, Glutathione peroxidase, Malondialdehyde, Body mass index
*Corresponding author Mi-Kyeong Choi
Address Division of Food Science, Kongju National University, 54 Daehak-ro, Yesan-eup, Yesan-gun, Chungnam 340-702, Korea Tel +82-41-330-1462 Fax +82-41-330-1469
E-mail [email protected] Received May 5, 2012 Revised June 13, 2012 Accepted June 14, 2012
This is an Open Access article distributed under the terms of the Creative Commons Attribution Non-Commercial License (http://creativecommons.org/licenses/by-nc/3.0/) which permits unrestricted non-commercial use, distribution, and reproduction in any medium, provided the original work is properly cited.
© 2012 The Korean Society of Clinical Nutrition
Mn mediates many physiological changes through regula- tion of oxidative stress related proteins such as glutathione peroxidase (GPx), reduced glutathione (GSH), Mn-dependent superoxide dismutase (MnSOD). At the same time these oxi- dation modulating enzymes are regarded as indicators for physiological Mn status. MnSOD is reported to protect cells from various carcinogens such as toxic chemical substances and radioactive materials, oxidative stresses and inflammatory responses [3]. The activation of these oxidation modulating factors including SOD have been reported to be regulated by several dietary factors [4-7]. Mn deficit reduces Mn-SOD activation and leads accumulation of superoxide anion in mitochondria which produce continuous lipid peroxides and membrane damage and cellular dysfunction [4]. Mn depletion in animals reduces Mn concentration of tissue and decreases MnSOD activity in heart and liver [5]. Zidenberg-Cherr et al. [6]
reported that the lack of Mn in a 2 month old female Sprague Dawley rats presented lower GPx, SOD activity than the con- trast group of animals and Mn deficiency increased thiobarbi- turic acid reactive substance (TBARS), which augmented oxi- dative stresses in those animals. On the other hand, although the rat without Mn supplement presented lower Mn content than the rat provided with Mn supplement, differences were not found in SOD activity [7]. Furthermore, Mn was reported to protect lipid oxidation induced tissue oxidation which was evidenced by decrease level of TBARS [8,9]. Mn inhibits oxida- tive stress induced growth of cancer cells [10], and the lifespan was extended by attenuation of oxidative process in each tis- sue [11]. In a study conducted with 47 young women (average age: 24), the level of oxidative stress was higher in subjects without Mn supplement (1.7 mg/day) than women with Mn supplement (15 mg/day) [3].
Such Mn related anti-oxidative protection factors were re- ported to be decreased in fatty liver and diabetes [12,13] which is closely related with obese condition. Higdon & Frei [14] de- fined obesity as the condition of oxidative stress and reported that imbalance between free radical production and physi- ological anti-oxidative system under obese condition triggered obesity-related symptoms, such as arteriosclerosis, diabetes and arthritis [15]. Additionally Vincent et al. [16] reported that a high correlation exist between obesity and oxidative stress.
Although Mn was reported to control oxidative stresses main- ly through the regulation of SOD activity, studies conducted for estimating accurate Mn intake requirement and assessing daily Mn intake were limited. In particular, among various diet
control factors, there have been no research to investigate the direct relationship between intake of Mn and metabolic syndromes such as obesity, diabetes and hypertension. Thus, this study evaluated the daily intake of Mn of Korean men and women in different degree of obesity and compared oxidative stress markers among study subject. Also this study attempt- ed to define the relationship between Mn intake and oxidative stress indicators by correlation analysis.
Materials and Methods
Subjects
The survey was conducted on 333 subjects who agreed to participate in the survey after receiving sufficient explanation on the purpose and content of research. Age range of study subjects were in between 19-87 year olds. This study was con- ducted after an approval by the Institutional Review Board (IRB) of College of Medicine at Chung-Ang University. All study subjects who participate this study signed consent forms with explanatory details of the study.
Anthropometic measurement
For classification of the degree of obesity in study subjects body mass index (BMI) was calculated by measuring heights and body weights. Height was measured by a standard stadi- ometer and weight in kilograms was measured on a calibrated Inbody (Biospace, Seoul, Korea) system. The mean value was calculated after carrying out all measurements 2 times. After calculating the BMI based on the height and weight measure- ment values, subjects were classified into three groups: normal group - 18.5 ≤ BMI ≤ 22.9 (105 subjects), overweight group - 23 ≤ BMI ≤ 24.9 (88 subjects) and obese group - at 25 ≤ BMI (140 subjects). Male subject in each group was composed of 42 subjects (40.0%) in normal group, 39 subjects (44.3%) in overweight group, and 60 subjects (42.9%) in obese group. In this regard, significant difference was not presented in gender distribution by each group.
Dietary intake survey
Dietary intake survey was carried out through the 24-hour recall method by individual interviews with trained research- ers. Thus, this study surveyed the type and amount of food and food materials ingested by subjects through their break- fast, lunch, dinner and snacks on the day before the survey.
The researchers presented food models and pictures to help
subjects accurately memorize the amount of ingested food.
The results of the meal intake survey was subjected to Can- Pro 3.0 (The Korean Nutrition Society, 2005) to extract the intake quantity of Mn and other nutrients of each subject. The amount of Mn ingested through food was calculated by using data of precedent studies [17] and food composition table [18]
indicating Mn content in food.
Blood and urine collection
The vacuum tube for blood test and the EDTA-coating vacuum tube for blood test were used to collect 15 ml of ve- nous blood of fasting subjects in the morning after the dietary intake survey. Spot urine was collected afterward. The blood collected in the vacuum tube was centrifuged for 15 minutes in ×400 g to separate the serum. The serum and blood col- lected in the EDTA-coating vacuum tube were stored until the examination was carried out in -20°C. Furthermore, the col- lected samples were refrigerated in -20°C until the spot urine was separated and analyzed according to analysis items.
Analysis of blood oxidative indicators Blood GSH analysis
Erythrocytic GSH was analyzed by using the method pre- sented by van Klaveren et al. [19] Thus, 500 μL of whole blood was collected and centrifuged for 5 minutes at 4°C, ×2500 g.
The supernatant liquid was eliminated and distilled water was added into the remaining red blood cells to achieve hemolysis.
Three hundreds μL of TCA was added to 100 μL of red blood cells in hemolytic fluid, mixed for 15 seconds and centrifuged for 5 minutes at ×10,000 g. Supernatant (20 μL) was mixed with daily buffer (0.248 mg/mL NADPH in 143 mM sodium phosphate, 6.3 mM Na4-EDTA at pH 7.5, 6 mM DTNB) and distilled water (7:1:1.8) and incubated for 15 minutes at 35°C.
10 μL of GSSG reductase (5 U/mL) was added in reaction mix for 20 minutes at 35°C. The color change was measured by the spectrophotometer (UVIKON, Kontron Inc.) at 412 nm. The content of GSH in the red blood cells was expressed as μmol/g Hb.
Blood GPx analysis
Blood GPx was analyzed by using the method presented by Aydin et al. [20]. 980 μL liquid mixed with 50 mM tris buffer (pH 7.6), 1 mM Na2EDTA, 2 mM NADPH, 4 mM sodium azide, 1 unit/mL glutathione reductase was mixed with 20 μL of the red blood cell hemolytic liquid gained through the method
mentioned above and reacted for 5 minutes at 37°C. After- ward, 8.8 mmol/L H2O2 was injected and spectrophotometer (UVIKON, Kontron Inc.) was used to measure optical density of the sample for 3 minutes at 340 nm. The GPx activity within the red blood cells was presented U/g Hb.
Analysis of urinary oxidation-related indicator
Urinary TBARS, urinary lipid peroxidation indicator, was ana- lyzed according to the method presented by Tagesson et al. [21].
TBARS was measured by mixing 300 μL of 0.5 M phosphoric acid with 50 μL of 23 mmol TBA reagent in the glass test tube and heated the liquid in 95°C for an hour. After cooling the liquid, 100 μL of methanol was added and analyzed by HPLC (Waters, 501). The concentration of mal onaldehyde (MDA), the peroxide of TBA, was presented by modifying the concentra- tion as mg/g creatinine (Cr) [22].
Statistical analysis
The results gained from this experiment were st atistically anlayzed by the SAS program (version 9.2; SAS Institute Inc., Cary, NC). The comparison among different BMI groups used the ANOVA test and Duncan’s multiple range test to verify the significance of differences. The correlation analysis adjusted for age, gender, body mass index and energy intake quantity was conducted by using Pearson’s correlation coefficient. The significance test was implemented at p < 0.05.
Results
General characteristics
Results of general measurement of subjects by different categories of obese condition were shown in Table 1. The aver- age age of subjects was 54.7 year old and age distribution in each BMI group was not significantly different. The average height was 158.9 cm and significant difference was not pre- sented by different BMI group. The weight was significantly high in the order of the obese group (69.6 kg), overweight group (61.3 kg) and normal group (54.5 kg) (p < 0.001). The blood pressure was significantly high in the order of the obese group (131.5/76.7 mmHg), overweight group (125.9/75.1 mmHg) and normal group (119.7/71.7 mmHg) (p < 0.01).
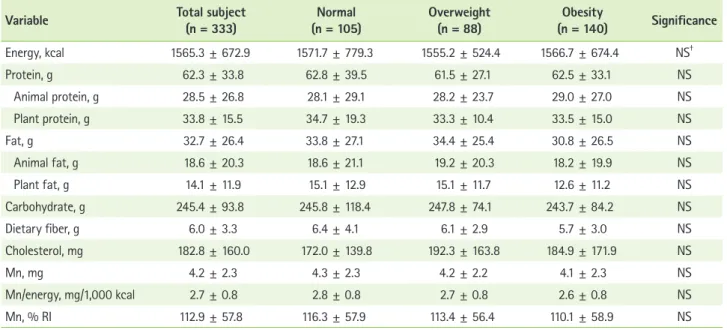
Nutrients and Mn intake status
The average of daily energy intake of subjects was 1565.3 kcal (Table 2). Energy intake of each different group catego-
rized by different obese condition was not significantly dif- ferent. Significant difference was not presented between the three groups in the daily intake of protein, fat, carbohydrate, dietary fiber cholesterol. The daily Mn intake was not signifi- cantly different among normal group (4.3 mg, 2.8 mg/1,000 kcal, 116.3% of recommended intake), overweight group (4.2 mg, 2.7 mg/1,000 kcal, 113.4% of recommended intake) and obese group (4.1 mg, 2.6 mg/1,000 kcal, 110.1% of recom- mended intake).
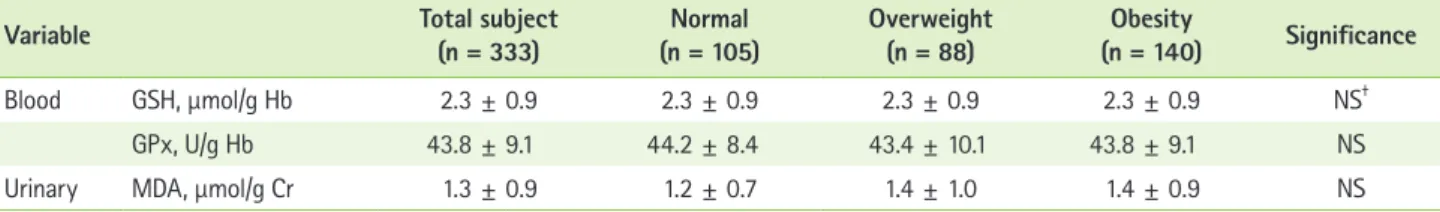
Biochemical indicators for oxidative stress
The level of blood GSH and GPx of total subjects were 2.3 μmol/g Hb and 43.8 U/g Hb, respectively (Table 3). The blood
level of GSH and GPx in each different BMI group was not significantly different. The average of MDA concentration in urine was measured as 1.3 μmol/g Cr in total subject and not significantly different with the values obtained from each dif- ferent BMI group.
Correlation between Mn intake and indices of oxidative stress
Table 4 presents the results for the correlation between indices of oxidative stress and the Mn intake adjusted for age, gender, body mass index and energy intake. The correlation value between the dietary Mn intake and blood GPx/GSH and urinary MDA of subjects was mostly low and was below 0.01.
Table 1. General characteristics of the subjects*
Variables Total subject
(n = 333) Normal
(n = 105) Overweight
(n = 88) Obesity
(n = 140) Significance
Age, yr 54.7 ± 13.5 54.1 ± 15.4 53.1 ± 14.0 56.3 ± 11.2 NS†
Height, cm 158.9 ± 8.8 159.2 ± 9.1 159.4 ± 9.7 158.3 ± 8.0 NS
Weight, kg 62.6 ± 9.7 54.5 ± 6.7c‡ 61.3 ± 7.4b 69.6 ± 7.5a p < 0.001
BMI, kg/m2 24.8 ± 3.1 21.4 ± 1.1c 24.0 ± 0.5b 27.8 ± 2.2a p < 0.001
Systolic BP, mmHg 126.3 ± 20.1 119.7 ± 20.1c 125.9 ± 18.3b 131.5 ± 19.8a p < 0.001 Diastolic BP, mmHg 74.7 ± 11.6 71.7 ± 11.5b 75.1 ± 11.0a 76.7 ± 11.6a p < 0.01 BMI: body mass index.
*Data are presented as mean ± SD; †Not significant; ‡Values followed by different letters within a row are significantly different at α < 0.05 as determined by Duncan’s multiple range test.
Table 2. Mean daily energy and manganese intake of the subjects*
Variable Total subject
(n = 333) Normal
(n = 105) Overweight
(n = 88) Obesity
(n = 140) Significance
Energy, kcal 1565.3 ± 672.9 1571.7 ± 779.3 1555.2 ± 524.4 1566.7 ± 674.4 NS†
Protein, g 62.3 ± 33.8 62.8 ± 39.5 61.5 ± 27.1 62.5 ± 33.1 NS
Animal protein, g 28.5 ± 26.8 28.1 ± 29.1 28.2 ± 23.7 29.0 ± 27.0 NS
Plant protein, g 33.8 ± 15.5 34.7 ± 19.3 33.3 ± 10.4 33.5 ± 15.0 NS
Fat, g 32.7 ± 26.4 33.8 ± 27.1 34.4 ± 25.4 30.8 ± 26.5 NS
Animal fat, g 18.6 ± 20.3 18.6 ± 21.1 19.2 ± 20.3 18.2 ± 19.9 NS
Plant fat, g 14.1 ± 11.9 15.1 ± 12.9 15.1 ± 11.7 12.6 ± 11.2 NS
Carbohydrate, g 245.4 ± 93.8 245.8 ± 118.4 247.8 ± 74.1 243.7 ± 84.2 NS
Dietary fiber, g 6.0 ± 3.3 6.4 ± 4.1 6.1 ± 2.9 5.7 ± 3.0 NS
Cholesterol, mg 182.8 ± 160.0 172.0 ± 139.8 192.3 ± 163.8 184.9 ± 171.9 NS
Mn, mg 4.2 ± 2.3 4.3 ± 2.3 4.2 ± 2.2 4.1 ± 2.3 NS
Mn/energy, mg/1,000 kcal 2.7 ± 0.8 2.8 ± 0.8 2.7 ± 0.8 2.6 ± 0.8 NS
Mn, % RI 112.9 ± 57.8 116.3 ± 57.9 113.4 ± 56.4 110.1 ± 58.9 NS
*Data are presented as mean ± SD; †Not significant.
Any significant correlation was not found in total subjects and in different BMI groups.
Discussion
This study investigated the Mn intake and the blood and urinary oxidation indices in normal adults and obese subjects in South Korea and analyzed the correlation between oxidative stress and Mn intake. Mn intake and oxidation indicators was not significantly different by different BMI. Also, significant correlation was not presented between dietary Mn intake and blood GPx/GSH and urinary MDA, and even after adjusting for age, gender, body mass index and energy intake the correlation was not found. There are only limited number of studies which evaluate Mn intake of Koreans due to the lack of database regarding Mn content in food. Sung & Yoon [23] reported that the daily Mn intake of female college students between age of 21-26 was 3.8 mg, whereas Gwag et al. [24] reported that the daily Mn intake of the elderly in certain region in Korea was 5.5-6.0 mg. Our data indicated that the daily Mn intake of total study subjects was 4.2 mg without significant difference between different BMI groups. This amount is higher than that of people from Western countries and similar to previous re- ports in Korea. The adequate Mn intake of Korean adults was 4.0 mg/day and 3.5 mg/day for men and women, respectively.
The upper intake level was set as 11 mg/day for both men and women [25]. The Mn intake of research subjects in this study slightly exceeded the adequate intake and was lower than the upper intake level. On the other hand, the fact that this study did not present significant differences in Mn intake in differ- ent BMI groups was attributed to similar energy intake in each groups. As the average body mass index of the obese group was measured as 27.8 kg/m2 which is lower BMI than the BMI of common obese subjects in Western country (>30 kg/m2) only subtle or no differences exists in meal intake between the obese groups and normal group.
Greger [26] reported that the daily Mn intake was 0.7-10.9 mg which is remarkable variations among people in Western countries with different dietary patterns (e.g. regular meals vs. vegetarian meals). Thus, various meal patterns may affect the actual intake of Mn in diet. Nkwenkeu et al. [27] reported the daily Mn intake was estimated 2.0-8.8 mg worldwide. In particular, the daily Mn intake of subjects ingesting the tra- ditional American diet composed of high amount of meat, refined food, milk and sugar and low amount of whole grains and vegetables was 2-5 mg, the lower limit of the Estimated Safe and Adequate Daily Dietary Intake (ESADDI). The daily Mn intake in many country was shown as follows: U.S. - 2.4 mg, Germany - 2.7 mg, Belgium - 2.6 mg, England - 4.6 mg, Aus- tralia - 2.9 mg, India - 2.2 mg, Canada - 2.9 mg [27]. On the other hand, Rubio et al. [28] reported that the average daily in- take of Mn of subjects who commonly consumed plant based foods reached as high of 13-20 mg. Since traditional Korean diet are mostly composed of plant based foods the Mn intake shown in this study implicate that Korean adults maintain ad- equate Mn intake suggested by the Korean Nutrition Society [25].
Biochemical indices of blood and urinary oxidative stress, which are reported to closely related with Mn intake condi- tion, were compared by the degree of obesity (i.e. the normal group, overweight group and obese group). In blood oxidized lipid species (e.g. Oxidized-LDL) produces oxidative damage in Table 3. Oxidative stress biomarkers of the subjects*
Variable Total subject
(n = 333) Normal
(n = 105) Overweight
(n = 88) Obesity
(n = 140) Significance
Blood GSH, μmol/g Hb 2.3 ± 0.9 2.3 ± 0.9 2.3 ± 0.9 2.3 ± 0.9 NS†
GPx, U/g Hb 43.8 ± 9.1 44.2 ± 8.4 43.4 ± 10.1 43.8 ± 9.1 NS
Urinary MDA, μmol/g Cr 1.3 ± 0.9 1.2 ± 0.7 1.4 ± 1.0 1.4 ± 0.9 NS
*Data are presented as mean ± SD; †Not significant.
Table 4. Correlations between manganese intake and oxida- tive stress biomarkers adjusted for age, sex, BMI, and energy intake*
Variable
Daily Mn intake Total subject
(n = 333) Normal
(n = 105) Overweight
(n = 88) Obesity (n = 140)
Blood GSH 0.0128 -0.0064 -0.0234 0.0736
GPx 0.0162 -0.0652 -0.0080 0.0990
Urinary MDA 0.0189 -0.0547 0.0644 0.0089
*Data are presented as Pearson’s correlation coefficient.
cellular membranes and induce abnormal signal transduction and trigger inflammatory responses [29-31]. SOD, catalase (CAT) and GPx are main antioxidative enzymes and effectively eliminate oxidative radicals generated by diet or disease condi- tions [14,19]. Obese subjects with high body fat were reported to present a high level of oxidative stress caused by lipid metabolites and inflammatory mediators derived from body fat. However, anti-oxidative defense ability of obese subjects, such as GPx activity or GSH was reported to be lower than normal subjects [14]. Olusi [32] reported that the SOD activity of red blood cells was presented 41% lower in obese subjects with BMI above 30 kg/m2, even GPx activity was reported to be 22% lower than normal subjects. Constantin et al. [33] re- ported that oxidative stress was getting worse with increase of age. Unlike precedent studies, this study did not present significant differences in blood GSH/GPx and urinary MDA concentration by different BMI groups. These results may due to the low degree of obesity of obese subjects as mentioned above.
As Mn is the main component of MnSOD, the deficit of Mn reduces enzyme activity and further generates cascade ef- fects in other antioxidative enzymes such as GPx and continu- ous formation of lipid peroxidants to damage systemic anti- oxidative defense of our body. Thus, the deficit of Mn causes changes fatty acid composition of the cellular membrane, damages cellular stability and reduces the response to the oxygen radicals [34]. Previous studies reported that oxidative damage of DNA in several tissue was increased in animals by Mn deficiency [35], along with suppressed contraction [36]
and consistently low SOD activity in cardiac muscle [37]. SOD activity of the lymphoid was increased by supplementing 15 mg/day of Mn in women for more than 90 days [3]. However, this study did not present significant correlation between Mn intake and oxidative stress in different BMI. When considering the fact that most precedent studies [3,5,6,8,9,37] reported the significant correlation with oxidative stress-related indica- tors in Mn deficit or supplementation, the result in this study implicates that, under sufficient level of Mn intake, antioxida- tive defence is well maintained even in obese conditions.
In human Mn deficiency is rare as various food sources for Mn exist and overconsumption is unlikely to happen as the absorption rate of Mn is below 5% [25]. Hence our present study would be a meaningful study to establish the relation- ship between oxidative stress markers and Mn intake under the level of daily Mn intake rather than under extreme deficit
or excess of Mn conditions. In addition to the relationship between Mn intake and oxidative stresses, biochemical Mn marker which reflect body Mn status and its role in oxidative stress should be investigated in next study. As previous stud- ies do not suggest accurate biochemical indicators which sen- sitively reflect physiological Mn status, future research is war- ranted to develop reliable markers for Mn status. Go et al. [38]
reported that no signifiant difference was found in the serum Mn concentration of normal subjects and cataract patients by analyzing the concentration of several minerals related to oxidative stresses in serum of cataract patients. As this study did not analyze biochemical indicators such as the serum Mn concentration, it presents limitations in carrying out in-depth discussions about the relationship between the Mn intake and indicators for oxidative stresses. As this study concluded that there was no correlation between oxidative stress indicators and the daily Mn intake in different level of obesity, follow- up studies must conduct in-depth biochemical assessment of body Mn status and also investigate subjects with various Mn intake to further extend our understanding of the relationship between Mn intake and oxidative stress indicators.
Conclusion
This study evaluated the daily Mn intake of 333 Korean men and women according to the BMI of study subjects and compared indicators related with oxidative stress to analyze the relationship between Mn intake and oxidative stresses.
The results can be summarized as the following. Although the weight and blood pressure of research subjects were signifi- cantly higher according to the increase of BMI (p < 0.01), no significant difference was found in Mn intake and oxidation indicators (GSH, GPx and MDA) by different BMI groups. Also, blood GSH/GPx and urinary MDA was not significantly cor- related with dietary Mn intake and adjusted Mn intake for age, gender, BMI and energy intake. In conclusion Mn intake in the level of daily consumption was not significantly correlation with oxidative stresses in Korean adults with different degree of obesity.
References
1. Aschner JL, Aschner M. Nutritional aspects of manganese homeostasis.
Mol Aspects Med 2005;26:353-62.
2. Greger JL, Davis CD, Suttie JW, Lyle BJ. Intake, serum concentrations, and urinary excretion of manganese by adult males. Am J Clin Nutr 1990;51:457-61.
3. Davis CD, Greger JL. Longitudinal changes of manganese-dependent superoxide dismutase and other indexes of manganese and iron status in women. Am J Clin Nutr 1992;55:747-52.
4. Welsh JJ, Narbaitz R, Begin-Heick N. Metabolic effects of dietary man- ganese supplementation in ob/ob mice. J Nutr 1985;115:919-28.
5. Davis CD, Ney DM, Greger JL. Manganese, iron and lipid interactions in rats. J Nutr 1990;120:507-13.
6. Zidenberg-Cherr S, Keen CL, Lönnerdal B, Hurley LS. Superoxide dis- mutase activity and lipid peroxidation in the rat: developmental cor- relations affected by manganese deficiency. J Nutr 1983;113:2498-504.
7. Malecki EA, Lo HC, Yang H, Davis CD, Ney DM, Greger JL. Tissue man- ganese concentrations and antioxidant enzyme activities in rats given total parenteral nutrition with and without supplemental manganese.
JPEN J Parenter Enteral Nutr 1995;19:222-6.
8. de Rosa G, Keen CL, Leach RM, Hurley LS. Regulation of superoxide dismutase activity by dietary manganese. J Nutr 1980;110:795-804.
9. Malecki EA, Greger JL. Manganese protects against heart mitochondrial lipid peroxidation in rats fed high levels of polyunsaturated fatty acids.
J Nutr 1996;126:27-33.
10. Davis CD, Feng Y. Dietary copper, manganese and iron affect the for- mation of aberrant crypts in colon of rats administered 3,2’-dimethyl- 4-aminobiphenyl. J Nutr 1999;129:1060-7.
11. Kayali R, Cakatay U, Uzun H, Genc H. Gender difference as regards myocardial protein oxidation in aged rats: male rats have increased oxidative protein damage. Biogerontology 2007;8:653-61.
12. Noeman SA, Hamooda HE, Baalash AA. Biochemical study of oxidative stress markers in the liver, kidney and heart of high fat diet induced obesity in rats. Diabetol Metab Syndr 2011;3:17.
13. Youssef H, Groussard C, Pincemail J, Moussa E, Jacob C, Lemoine S, Zind M, Defraigne JO, Cillard J, Delamarche P, Gratas-Delamarche A.
Exercise-induced oxidative stress in overweight adolescent girls: roles of basal insulin resistance and inflammation and oxygen overconsump- tion. Int J Obes (Lond) 2009;33:447-55.
14. Higdon JV, Frei B. Obesity and oxidative stress: a direct link to CVD?
Arterioscler Thromb Vasc Biol 2003;23:365-7.
15. Crepaldi G, Maggi S. Epidemiologic link between osteoporosis and car- diovascular disease. J Endocrinol Invest 2009;32:2-5.
16. Vincent HK, Innes KE, Vincent KR. Oxidative stress and potential inter- ventions to reduce oxidative stress in overweight and obesity. Diabetes Obes Metab 2007;9:813-39.
17. Choi MK, Kim EY. Analysis of manganese content in frequently con- sumed foods by Koreans. Korean J Nutr 2007;40:769-78.
18. Rural Development Administration. Food composition tables. 7th ed.
Seoul: Hyoil; 2006.
19. van Klaveren RJ, Hoet PH, Pype JL, Demedts M, Nemery B. Increase in gamma-glutamyltransferase by glutathione depletion in rat type Ⅱ pneumocytes. Free Radic Biol Med 1997;22:525-34.
20. Aydin A, Orhan H, Sayal A, Ozata M, Sahin G, Isimer A. Oxidative stress and nitric oxide related parameters in type Ⅱ diabetes mellitus: effects of glycemic control. Clin Biochem 2001;34:65-70.
21. Tagesson C, Källberg M, Wingren G. Urinary malondialdehyde and 8-hydroxydeoxyguanosine as potential markers of oxidative stress in industrial art glass workers. Int Arch Occup Environ Health 1996;69:5- 13.
22. Bayrak O, Seckiner I, Solakhan M, Karakok M, Erturhan SM, Yagci F. Ef- fects of intravesical dexpanthenol use on lipid peroxidation and bladder histology in a chemical cystitis animal model. Urology 2012;79:1023-6.
23. Sung CJ, Yoon YH. The study of Zn, Cu, Mn, Ni contents of serum, hair, nail and urine for female college students. J Korean Soc Food Sci Nutr 2000;29:99-105.
24. Gwag EH, Lee SL, Yun JS, Lee HS, Kwon JS, Kwon IS. Macronutrient, mineral and vitamin intakes in elderly people in rural area of north Kyungpook province in South Korea. Korean J Nutr 2003;36:1052-60.
25. The Korean Nutrition Society. Dietary reference intakes for Koreans.
Seoul: Hanarum Publishers; 2010.
26. Greger JL. Dietary standards for manganese: overlap between nutri- tional and toxicological studies. J Nutr 1998;128:368S-71S.
27. Nkwenkeu SF, Kennedy G, Philippe S, Zayed J. Oral manganese intake estimated with dietary records and with direct chemical analysis. Sci Total Environ 2002;287:147-53.
28. Rubio C, Gutiérrez AJ, Revert C, Reguera JI, Burgos A, Hardisson A.
Daily dietary intake of iron, copper, zinc and managanese in Spanish population. Int J Food Sci Nutr 2009;60:590-600.
29. Ferretti G, Bacchetti T, Moroni C, Savino S, Liuzzi A, Balzola F, Bic- chiega V. Paraoxonase activity in high-density lipoproteins: a com- parison between healthy and obese females. J Clin Endocrinol Metab 2005;90:1728-33.
30. Yesilbursa D, Serdar Z, Serdar A, Sarac M, Coskun S, Jale C. Lipid perox- ides in obese patients and effects of weight loss with orlistat on lipid peroxides levels. Int J Obes (Lond) 2005;29:142-5.
31. Haszon I, Papp F, Kovács J, Bors M, Németh I, Bereczki C, Túri S. Plate- let aggregation, blood viscosity and serum lipids in hypertensive and obese children. Eur J Pediatr 2003;162:385-90.
32. Olusi SO. Obesity is an independent risk factor for plasma lipid peroxi- dation and depletion of erythrocyte cytoprotectic enzymes in humans.
Int J Obes Relat Metab Disord 2002;26:1159-64.
33. Constantin A, Constantinescu E, Dumitrescu M, Calin A, Popov D. Ef- fects of ageing on carbonyl stress and antioxidant defense in RBCs of obese Type 2 diabetic patients. J Cell Mol Med 2005;9:683-91.
34. Bhat KS. Plasma calcium and trace metals in human subjects with ma- ture cataract. Nutr Rep Int 1988;37:157-63.
35. Adachi S, Takemoto K, Hirosue T, Hosogai Y. Spontaneous and 2-nitro- propane induced levels of 8-hydroxy-2’-deoxyguanosine in liver DNA of rats fed iron-deficient or manganese- and copper-deficient diets.
Carcinogenesis 1993;14:265-8.
36. Miller KB, Caton JS, Finley JW. Manganese depresses rat heart muscle respiration. Biofactors 2006;28:33-46.
37. Davis CD, Zech L, Greger JL. Manganese metabolism in rats: an im- proved methodology for assessing gut endogenous losses. Proc Soc Exp Biol Med 1993;202:103-8.
38. Go YS, Park JU, Lee SH, Lee YJ, Hong YJ. Serum concentration of antioxidant minerals in cataract patients. J Korean Ophthalmol Soc 2003;44:2358-63.