Hee-Yeon Jung ,1 Su-Hee Kim ,1 Min-Young Seo ,1 Sun-Young Cho ,1 Youngae Yang ,1 Ji-Young Choi ,1 Jang-Hee Cho ,1 Sun-Hee Park ,1 Yong-Lim Kim ,1 Hyung-Kee Kim ,2 Seung Huh ,2 Dong Il Won ,3 and Chan-Duck Kim 1
1 Department of Internal Medicine, School of Medicine, Kyungpook National University, Kyungpook National University Hospital, Daegu, Republic of Korea
2 Department of Surgery, School of Medicine, Kyungpook National University, Kyungpook National University Hospital, Daegu, Republic of Korea
3 Department of Clinical Pathology, School of Medicine, Kyungpook National University, Kyungpook National University Hospital, Daegu, Republic of Korea
Original Article
Received: Jan 26, 2018 Accepted: May 16, 2018 Address for Correspondence:
Chan-Duck Kim, MD, PhD
Department of Internal Medicine, School of Medicine, Kyungpook National University, Kyungpook National University Hospital, 130 Dongdeok-ro, Jung-gu, Daegu 41944, Republic of Korea.
E-mail: drcdkim@knu.ac.kr
© 2018 The Korean Academy of Medical Sciences.
This is an Open Access article distributed under the terms of the Creative Commons Attribution Non-Commercial License (https://
creativecommons.org/licenses/by-nc/4.0/) which permits unrestricted non-commercial use, distribution, and reproduction in any medium, provided the original work is properly cited.
ORCID iDs Hee-Yeon Jung
https://orcid.org/0000-0003-0232-7202 Su-Hee Kim
https://orcid.org/0000-0003-2488-8350 Min-Young Seo
https://orcid.org/0000-0002-2801-6755 Sun-Young Cho
https://orcid.org/0000-0002-4265-1210 Youngae Yang
https://orcid.org/0000-0003-1225-908X
Characteristics and Clinical
Significance of De Novo Donor-Specific Anti-HLA Antibodies after Kidney
Transplantation
ABSTRACT
Background: The association of de novo donor-specific anti-human leukocyte antigens (HLA) antibodies (DSA) and development of antibody-mediated rejection (AMR) in kidney transplant recipients (KTRs) is still undetermined.
Methods: We prospectively screened de novo DSA in 167 KTRs during 32 months after kidney transplantation (KT). Timing of DSA detection was at 3, 6, and 12 months post-transplant and annually thereafter and when clinically indicated. DSA levels were determined by Luminex assays and expressed as mean fluorescence intensity (MFI). We evaluated the incidence, characteristics of DSA, and association between DSA and tacrolimus trough levels or AMR.
Results: De novo DSA developed in 16 KTRs (9.6%) and acute AMR occurred more commonly in KTRs with de novo DSA compared to KTRs without de novo DSA (18.8% vs.
0%, P < 0.001). All de novo DSA were against class II antigens. The mean number of DSA was 1.8 ± 1.2 and the average MFI of DSA was 7,399 ± 5,470. Tacrolimus trough level during the first 0–2 months after KT was an independent predictor of DSA development (hazard ratio, 0.70; 95% confidence interval, 0.50–0.99; P = 0.043). No differences were found in the number of DSA, average MFI of DSA, and tacrolimus levels during the first year between de novo DSA-positive KTRs with AMR and those without AMR.
Conclusion: The results of our study suggest that monitoring of DSA and maintaining proper tacrolimus levels are essential to prevent AMR during the initial period after KT.
Keywords: Antibodies; Graft Rejection; Kidney Transplantation; Survival
INTRODUCTION
Although recent advances in immunosuppressive regimens after kidney transplantation (KT) have reduced the incidence and consequences of T-cell-mediated rejection (TCMR) and have improved short-term outcomes, long-term allograft loss attributable to antibody-mediated
Cell Therapy &
Organ Transplantation
rejection (AMR) is still responsible for substantial medical and socioeconomic burdens in kidney transplant recipients (KTRs).1,2 Therefore, clarifying and monitoring the most important contributing factors to immunologic mechanisms associated with allograft loss, as well as defining their characteristics, is crucial.
Numerous studies have shown that de novo donor-specific anti-human leukocyte antigens (HLA) antibodies (DSA) after KT are associated with AMR, which leads to allograft loss.3-9 As not all KTRs with de novo DSA develop AMR, previous studies have tried to address the characteristics of de novo DSA in terms of pathogenic capacity. It was reported that DSA against class II HLA are associated with a poor prognosis3,10-12 and that mean fluorescence intensity (MFI) values13,14 and complement fixing activity of DSA are correlated with the risk of AMR and allograft loss in KTRs.15,16 However, the exact properties of de novo DSA that are directly linked to AMR and allograft loss still remain to be established.
The goal of this study was to investigate the incidence and associated factors of de novo DSA and the effect of de novo DSA on AMR, and to clarify the characteristics of DSA leading to AMR in KTRs which can be easily and readily accessible in clinical practice.
METHODS
Patients
A total of 203 KTRs aged > 18 years who underwent KT at Kyungpook National University Hospital between January 2010 and December 2013 were enrolled. We excluded patients with pre-transplant anti-HLA antibodies (n = 31) and those with missing data regarding pre- transplant anti-HLA antibodies (n = 5). Finally, 167 KTRs were included in this study.
Anti-HLA antibody detection and DSA identification
All enrolled KTRs were prospectively screened for the development of de novo DSA at 3, 6, and 12 months post-transplant and annually thereafter, and when clinically indicated.
Measurement timings of DSA detection varied with a mean of 0.5 months during the first year post-transplant and of 2.5 months after more than 2 years post-transplant, depending on the variation in the dates when patients visited a transplant outpatient clinic. The panel- reactive antibody (PRA)-identification (ID) was carried out using Lifecodes Class I and Class II ID kits (Immucor, Stamford, CT, USA). Multiple class I or II antigen-coated Luminex beads were incubated with recipient serum samples. The sensitized beads were then washed to remove the unbound antibody. A phycoerythrin-conjugated anti-human IgG was then added to the wells. After incubation in the dark on a rotating platform, test samples were analyzed by the Luminex instrument. The signal intensity from each bead was compared with that of beads treated with negative control sera, and positivity was determined according to the manufacturer's instructions. DSA were expressed as MFI, and MFI values > 500 were regarded as positive.17,18
Tacrolimus (TAC) trough levels
Post-transplant time points were divided into 0–2 months, 3–6 months, and 7–12 months after KT. Low-level (LL) and standard-level (SL) TAC groups were defined based on mean TAC trough level at each period as 4–7 and 7–12 ng/mL for 0–2 months, 3–6 and 6–10 ng/mL for 3–6 months, and 2–5 and 5–8 ng/mL for 7–12 months, respectively. The coefficient of variation (CV, %) was defined as standard deviation/mean TAC trough level at each period × 100 to Ji-Young Choi
https://orcid.org/0000-0002-9774-3665 Jang-Hee Cho
https://orcid.org/0000-0002-7031-5214 Sun-Hee Park
https://orcid.org/0000-0002-0953-3343 Yong-Lim Kim
https://orcid.org/0000-0002-1344-3455 Hyung-Kee Kim
https://orcid.org/0000-0002-4436-7424 Seung Huh
https://orcid.org/0000-0002-0275-4960 Dong Il Won
https://orcid.org/0000-0002-1983-2515 Chan-Duck Kim
https://orcid.org/0000-0002-4648-0324 Funding
This research was supported by a grant from the Korea Health Technology R&D Project through the Korea Health Industry Development Institute (KHIDI), which is funded by the Ministry of Health & Welfare, Republic of Korea (HI13C1232, HC15C1129).
Disclosure
The authors have no potential conflicts of interest to disclose.
Author Contributions
Conceptualization: Jung HY, Kim CD. Data curation: Jung HY, Kim SH, Seo MY, Cho SY, Yang Y, Won DI. Formal analysis: Jung HY, Kim CD. Methodology: Jung HY, Kim SH, Seo MY, Cho SY, Yang Y, Choi JY, Cho JH, Park SH, Kim YL, Kim HK, Huh S, Won DI, Kim CD. Writing - original draft: Jung HY. Writing - review &
editing: Jung HY, Kim CD.
determine within-patient variability in TAC trough levels.19 TAC trough levels were measured using the Architect TAC assay (Abbott Diagnostics, Lake Forest, IL, USA).
Follow-up and outcome ascertainment
All KTRs were followed-up for the occurrence of TCMR, AMR, and allograft loss. Kidney allograft biopsies were performed in the event of allograft dysfunction, defined as more than a 30% rise in serum creatinine, and/or the presence of BK viremia, and/or clinical suspicion of BK virus nephropathy. All biopsies were obtained before treatment for the presumptive diagnosis and reviewed according to the Banff 2013 classification. Histologic evidence of acute tissue injury, evidence of current/recent antibody interaction with the vascular endothelium, and serologic evidence of DSA must be present for diagnosis of AMR. Histologic evidence of acute tissue injury includes microcirculation inflammation (MI), defined as the sum of the glomerulitis and peritubular capillaritis scores, intimal or transmural arteritis, acute thrombotic microangiopathy, or acute tubular injury, in the absence of any other apparent cause. Evidence of current/recent antibody interaction with the vascular endothelium include linear C4d staining in peritubular capillaries, at least moderate MI, or increased expression of gene transcripts in biopsy tissue indicative of endothelial injury.20 In the setting of de novo DSA, AMR can be diagnosed with MI ≥ 2.
Statistical analysis
Continuous variables were expressed as means ± standard deviation for normally distributed data and as median with range when the values were not normally distributed. The
differences between the groups were tested by independent sample t-test or χ2 test, as appropriate. The Mann-Whitney U test was used when parameters exhibited a non-normal distribution. The Cox regression model has been used to analyze the factors associated with the development of de novo DSA. The cumulative incidences of TCMR, AMR, and death- censored allograft loss were analyzed according to the HLA antibody and DSA status using Kaplan-Meier analysis. Statistical analysis was performed using SPSS version 21.0 (SPSS, Chicago, IL, USA). P values < 0.05 were considered statistically significant.
Ethics statement
The Institutional Review Board of Kyungpook National University Hospital reviewed and approved the study protocol (No. 2017-09-005). All clinical investigations were conducted in accordance with the guidelines of the 2008 Declaration of Helsinki.
RESULTS
Incidence of de novo DSA and patient characteristics
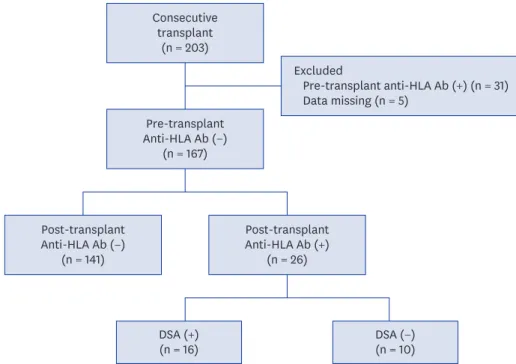
Of 167 KTRs, 26 (15.6%) developed de novo anti-HLA antibodies during a mean follow-up of 32.1 ± 13.2 months. Among 26 KTR with de novo anti-HLA antibodies, 16 developed DSA and 10 had non-DSA (Fig. 1). The average time till the first detection of de novo DSA was 24.0 months after KT.
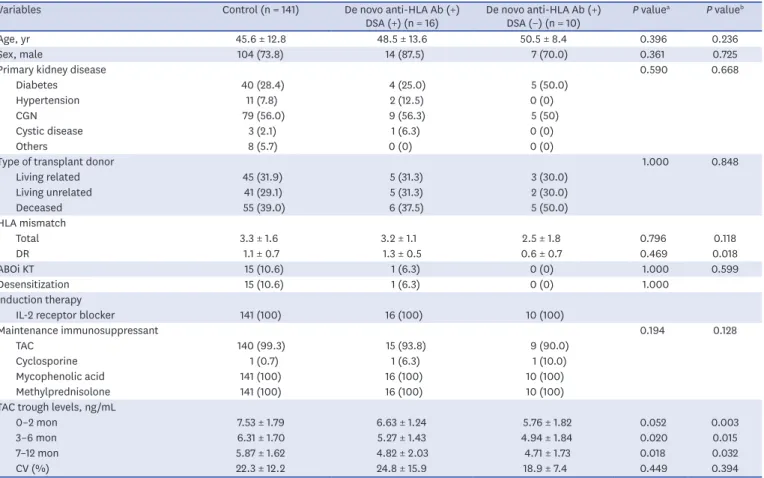
Baseline characteristics of included KTRs are detailed in Table 1. The mean age of KTRs with de novo DSA was 48.5 years, and 87.5% of them were male. The mean number of total HLA mismatch was 3.2. One patient (6.3%) underwent ABO-incompatible KT and received desensitization prior to KT. All KTRs received calcineurin inhibitors, mycophenolic acid, and methylprednisolone as maintenance immunosuppressants. A total of 15 patients with
de novo DSA (93.8%) received TAC-based immunosuppressant therapy. No significant differences in clinical and immunological characteristics, except for TAC trough levels within 1 year post-transplant, were observed between patients without de novo DSA and anti-HLA antibodies (n = 141) and patients with de novo DSA (n = 16). Patients with anti- HLA antibodies (+) DSA (+) and KTRs with anti-HLA antibodies (+) DSA (−) (n = 10) had significantly lower TAC trough levels during the first year after KT compared to the control group. No significant differences in CV were observed between the groups.
Factors associated with the development of de novo DSA
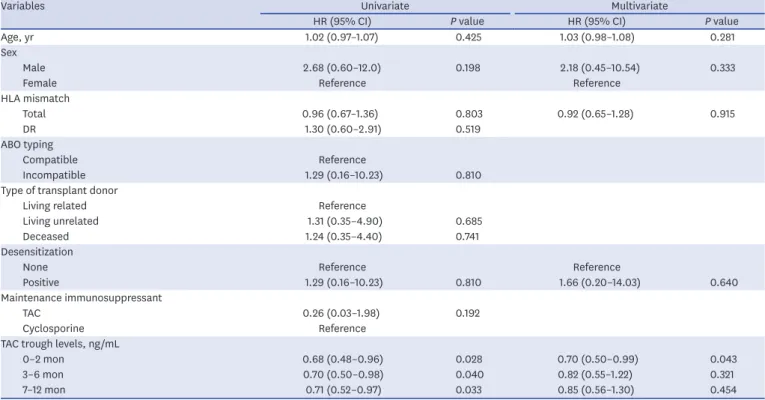
Univariate Cox regression analysis showed that age, sex, number of HLA mismatches, ABO compatibility, type of transplant donor, desensitization, and maintenance
immunosuppressant therapy were not significantly associated with de novo DSA; however, lower TAC trough levels during the first year after KT were significantly associated with de novo DSA (0–2 months, hazard ratio [HR], 0.68; 95% confidence interval [CI], 0.48–0.96;
P = 0.028; 3–6 months, HR, 0.70; 95% CI, 0.50–0.98; P = 0.040; 7–12 months, HR, 0.71;
95% CI, 0.52–0.97; P = 0.033). Multivariate Cox regression analysis demonstrated that lower TAC trough levels for 0–2 months after KT were significant independent predictors for the development of de novo DSA (HR, 0.70; 95% CI, 0.50–0.99; P = 0.043) (Table 2).
Kaplan-Meier analysis for the development of DSA according to TAC trough levels during the three different periods also confirmed that the LL-TAC group for 0–2 months after KT was associated with a significantly increased risk of DSA development after 1 day post-transplant compared to the SL-TAC group (P = 0.021) (Fig. 2). However, there were no significant associations between the TAC trough levels at 3–6 months and 7–12 months and DSA development after 6 and 12 months post-transplant, respectively (Fig. 2).
Excluded
Pre-transplant anti-HLA Ab (+) (n = 31) Data missing (n = 5)
DSA (−) (n = 10) DSA (+)
(n = 16)
Post-transplant Anti-HLA Ab (+)
(n = 26) Post-transplant
Anti-HLA Ab (−) (n = 141)
Pre-transplant Anti-HLA Ab (−)
(n = 167) Consecutive
transplant (n = 203)
Fig. 1. Flow chart of patients. A total of 203 KTRs were enrolled. After excluding 31 patients with pre-transplant anti-HLA Ab and 5 patients with missing data regarding pre-transplant anti-HLA Ab, 167 KTRs were included in this study. Of 167 KTRs, 26 KTRs developed de novo anti-HLA Ab (16 were DSA and 10 were non-DSA).
KTRs = kidney transplant recipients, HLA = human leukocyte antigens, DSA = donor-specific anti-human leukocyte antigens antibodies, anti-HLA Ab = anti-human leukocyte antigens antibodies.
Effect of de novo DSA on rejection
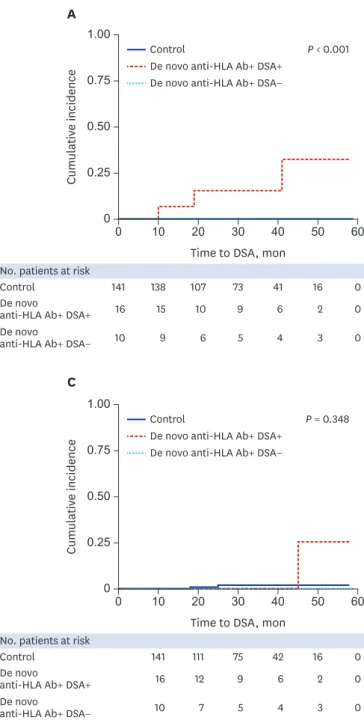
Fig. 3 shows the clinical outcomes of the control group, anti-HLA+ DSA+ group, and anti- HLA+ DSA group. In the KTRs with acute AMR, allograft biopsy was performed 108.3 ± 95.5 days after the development of de novo DSA. A significantly higher cumulative incidence of AMR was detected in the DSA group compared to the control and anti-HLA+ DSA− groups (P < 0.001). However, the cumulative incidences of TCMR and death-censored allograft loss were not significantly different between the three groups.
Characteristics of DSA leading to AMR
The characteristics of de novo DSA are shown in Table 3. The mean number of DSA was 1.8 ± 1.2, ranging from 1 to 5, and the average MFI of DSA was 7,399.3 ± 5,470.4. All de novo DSA were against class II antigens (10 against HLA-DQ, 1 against HLA-DR, and 5 against both).
Among 16 KTRs with de novo DSA, 3 patients were screened for the development of de novo DSA when the patients were not under routine surveillance. Two, 4, and 7 KTRs had de novo DSA at the timepoints of 6, 12, ≥ 24 months post-transplant, respectively, with some variation in the exact time period. The detailed results of development of de novo DSA according to the time of detection are shown in Table 3. Of 16 KTRs with de novo DSA, AMR occurred only in 3 patients. No differences were detected in the number of DSA (2.3 ± 1.2 vs. 1.7 ± 1.3;
P = 0.364), the average MFI of DSA (10,461.3 ± 1,917.4 vs. 6,692.6 ± 5,823.1; P = 0.364), the Table 1. Baseline characteristics of KTRs
Variables Control (n = 141) De novo anti-HLA Ab (+)
DSA (+) (n = 16) De novo anti-HLA Ab (+)
DSA (−) (n = 10) P valuea P valueb
Age, yr 45.6 ± 12.8 48.5 ± 13.6 50.5 ± 8.4 0.396 0.236
Sex, male 104 (73.8) 14 (87.5) 7 (70.0) 0.361 0.725
Primary kidney disease 0.590 0.668
Diabetes 40 (28.4) 4 (25.0) 5 (50.0)
Hypertension 11 (7.8) 2 (12.5) 0 (0)
CGN 79 (56.0) 9 (56.3) 5 (50)
Cystic disease 3 (2.1) 1 (6.3) 0 (0)
Others 8 (5.7) 0 (0) 0 (0)
Type of transplant donor 1.000 0.848
Living related 45 (31.9) 5 (31.3) 3 (30.0)
Living unrelated 41 (29.1) 5 (31.3) 2 (30.0)
Deceased 55 (39.0) 6 (37.5) 5 (50.0)
HLA mismatch
Total 3.3 ± 1.6 3.2 ± 1.1 2.5 ± 1.8 0.796 0.118
DR 1.1 ± 0.7 1.3 ± 0.5 0.6 ± 0.7 0.469 0.018
ABOi KT 15 (10.6) 1 (6.3) 0 (0) 1.000 0.599
Desensitization 15 (10.6) 1 (6.3) 0 (0) 1.000
Induction therapy
IL-2 receptor blocker 141 (100) 16 (100) 10 (100)
Maintenance immunosuppressant 0.194 0.128
TAC 140 (99.3) 15 (93.8) 9 (90.0)
Cyclosporine 1 (0.7) 1 (6.3) 1 (10.0)
Mycophenolic acid 141 (100) 16 (100) 10 (100)
Methylprednisolone 141 (100) 16 (100) 10 (100)
TAC trough levels, ng/mL
0–2 mon 7.53 ± 1.79 6.63 ± 1.24 5.76 ± 1.82 0.052 0.003
3–6 mon 6.31 ± 1.70 5.27 ± 1.43 4.94 ± 1.84 0.020 0.015
7–12 mon 5.87 ± 1.62 4.82 ± 2.03 4.71 ± 1.73 0.018 0.032
CV (%) 22.3 ± 12.2 24.8 ± 15.9 18.9 ± 7.4 0.449 0.394
Values are shown as mean ± standard deviation (range) or number (%).
Ab = antibodies, ABOi = ABO incompatible, CGN = chronic glomerulonephritis, CV = coefficient of variation, DSA = donor-specific anti-human leukocyte antigens antibodies, HLA = human leukocyte antigens, IL = interleukin, KT = kidney transplantation, KTRs = kidney transplant recipients, TAC = tacrolimus.
aSignificance of the difference between control and de novo anti-HLA Ab (+) DSA (+); bSignificance of the difference between control and de novo anti-HLA Ab (+) DSA (−).
peak MFI of DSA (12,399.3 ± 1,300.9 vs. 7,737.3 ± 7,039.6; P = 0.364), the value obtained after multiplication by the number of DSA and the average MFI of DSA (24,112.0 ± 12,747.6 vs. 13,089.1 ± 16,581.0; P = 0.189), and TAC trough levels and CV during the first year after KT between de novo DSA positive KTRs with AMR and de novo DSA positive KTRs without AMR. When the characteristics of DSA were analyzed according to type of DSA, the average MFI of DSA against HLA-DQ was higher than that of DSA against HLA-DR in terms of development of AMR, although this difference did not reach statistical significance (11,600.0
± 978.6 vs. 7,448.1 ± 6,812.6; P = 0.060).
Table 4 shows pathologic correlations of de novo DSA. No significant positive correlation was found between the sum score of MI and the number of DSA, the average MFI of DSA, and the value obtained after multiplication by the number of DSA and the average MFI of DSA.
Results of indication biopsies based on the Banff 2013 scheme are detailed in Table 5.
DISCUSSION
This study demonstrated that de novo DSA occurred in 9.6% of KTRs with an average time till first detection of 24.0 months after KT. During a mean follow-up of 32.1 ± 13.2 months, the incidence of AMR, but not of TCMR or the risk of allograft loss, was significantly increased with the development of de novo DSA. The risk of de novo DSA was significantly higher in KTRs with lower TAC trough levels during the initial 2 months after KT. In our transplant center, de novo DSA leading to AMR did not have distinguishable characteristics in terms of the number and strength of DSA compared to de novo DSA which did not result in AMR.
Table 2. Univariate and multivariate Cox regression analysis for the development of de novo donor-specific antibodies
Variables Univariate Multivariate
HR (95% CI) P value HR (95% CI) P value
Age, yr 1.02 (0.97–1.07) 0.425 1.03 (0.98–1.08) 0.281
Sex
Male 2.68 (0.60–12.0) 0.198 2.18 (0.45–10.54) 0.333
Female Reference Reference
HLA mismatch
Total 0.96 (0.67–1.36) 0.803 0.92 (0.65–1.28) 0.915
DR 1.30 (0.60–2.91) 0.519
ABO typing
Compatible Reference
Incompatible 1.29 (0.16–10.23) 0.810
Type of transplant donor
Living related Reference
Living unrelated 1.31 (0.35–4.90) 0.685
Deceased 1.24 (0.35–4.40) 0.741
Desensitization
None Reference Reference
Positive 1.29 (0.16–10.23) 0.810 1.66 (0.20–14.03) 0.640
Maintenance immunosuppressant
TAC 0.26 (0.03–1.98) 0.192
Cyclosporine Reference
TAC trough levels, ng/mL
0–2 mon 0.68 (0.48–0.96) 0.028 0.70 (0.50–0.99) 0.043
3–6 mon 0.70 (0.50–0.98) 0.040 0.82 (0.55–1.22) 0.321
7–12 mon 0.71 (0.52–0.97) 0.033 0.85 (0.56–1.30) 0.454
Values are presented as number (%).
CI = confidence interval, HLA = human leukocyte antigens, HR = hazard ratio, TAC = tacrolimus.
Over the past decades, the main focus in the field of KT has shifted from T-cell-mediated processes, calcineurin inhibitor toxicity, and chronic allograft nephropathy to humoral rejection that is primarily responsible for the allograft loss. Therefore, insights regarding post-transplant development of anti-HLA antibodies and DSA have been extended. We know that de novo DSA can occur at any time in 20%–30% of patients after transplantation.3 A considerable variation in the incidence and time of appearance of de novo anti-HLA antibodies was detected after KT.
A prospective study performed on 2,231 KTRs found that 21.4% of patients developed anti-HLA antibodies by 1 year after KT.21 Another study that included 1,014 KTRs from deceased donors has reported that 29% of included subjects developed anti-HLA antibodies and 31% of these antibodies were DSA.22 Another study performed on 315 KTRs with low immunologic risk showed that 15% of included patients developed de novo DSA by 4.6 ± 3.0 years after KT.10 In the current study, the incidence of development of de novo DSA was relatively low compared to No. patients at risk
LL-TAC for 0–2 mon SL-TAC for 0–2 mon
78 73 53 20 0
89 89 71 28
5 13 32
52 0
Time to DSA, mon A
0.50
0.25
00 10 20 30 60
Cumulative incidence
0.75
40 50
1.00
LL-TAC for 3–6 mon SL-TAC for 3–6 mon No. patients at risk
85 82 62 27 0
81 80 62 21
12 6 45
39 0
Time to DSA, mon B
0.50
0.25
00 10 20 30 60
Cumulative incidence
0.75
40 50
1.00 P = 0.021
LL-TAC for 0–2 mon SL-TAC for 0–2 mon
P = 0.812 LL-TAC for 3–6 mon
SL-TAC for 3–6 mon
LL-TAC for 7–12 mon SL-TAC for 7–12 mon No. patients at risk
53 51 35 19 0
111 110 88 29
7 11 28
55 0
Time to DSA, mon C
0.50
0.25
00 10 20 30 60
Cumulative incidence
0.75
40 50
1.00
P = 0.056 LL-TAC for 7–12 mon
SL-TAC for 7–12 mon
Fig. 2. Kaplan-Meier analysis for DSA development according to TAC trough levels after KT. (A) TAC trough levels at 0–2 months and DSA development after 1 day post-transplant, (B) TAC trough levels at 3–6 months and DSA development after 6 months post-transplant, (C) TAC trough levels at 7–12 months and DSA development after 12 months post-transplant. LL-TAC group for 0–2 months after KT showed significantly increased risk for the development of DSA compared to SL-TAC group (P = 0.021).
DSA = donor-specific anti-human leukocyte antigens antibodies, TAC = tacrolimus, KT = kidney transplantation, LL = low-level, SL = standard-level.
previous studies. Considering that previous studies included a greater proportion of deceased KTRs22 and African-Americans,10 who are known to present higher immunologic risk factors,23 this finding might be related to the differences in the immunologic risk of the included patients. The difference in detection methods of anti-HLA antibodies might also influence the detected incidence of development of DSA. There is a possibility that previous studies10,22 using single-antigen bead assays, which have higher sensitivity and specificity for identifying DSA, showed a higher incidence of DSA than our study using polyspecific identification.
Control
De novo anti-HLA Ab+ DSA+
De novo anti-HLA Ab+ DSA−
Time to DSA, mon Control
No. patients at risk
141 111 75 42 16 0
De novo
anti-HLA Ab+ DSA+ 16 12 9 6 2 0
De novo
anti-HLA Ab+ DSA− 10 7 5 4 3 0
C
0.50
0.25
00 10 20 30 60
Cumulative incidence
0.75
40 50
1.00
P = 0.348 Time to DSA, mon
A
0.50
0.25
00 10 20 30 60
Cumulative incidence
0.75
40 50
1.00
Time to DSA, mon B
0.50
0.25
00 10 20 30 60
Cumulative incidence
0.75
40 50
1.00 P < 0.001
Control
De novo anti-HLA Ab+ DSA+
De novo anti-HLA Ab+ DSA−
Control
De novo anti-HLA Ab+ DSA+
De novo anti-HLA Ab+ DSA−
P = 0.681
Control
No. patients at risk
141 138 107 73 41 16 0
De novo
anti-HLA Ab+ DSA+ 16 15 10 9 6 2 0
De novo
anti-HLA Ab+ DSA− 10 9 6 5 4 3 0
Control
No. patients at risk
141 138 107 73 41 16 0
De novo
anti-HLA Ab+ DSA+ 16 15 10 9 6 2 0
De novo
anti-HLA Ab+ DSA− 10 9 6 5 4 3 0
Fig. 3. The cumulative incidences of (A) AMR, (B) TCMR, and (C) death-censored allograft loss according to the presence of DSA. Acute AMR occurred more commonly in KTRs with de novo DSA compared to KTRs without de novo DSA (P < 0.001). No significant differences were found in the cumulative incidence of TCMR and death-censored allograft loss between groups.
AMR = antibody-mediated rejection, TCMR = T-cell medicated rejection, DSA = donor-specific anti-human leukocyte antigens antibodies, KTRs = kidney transplant recipients.
In this study, the average MFI of de novo DSA was 7,399.3 ± 5,470.4 and only 18.8% of KTRs with de novo DSA experienced AMR. In our opinion, this result can be interpreted in three ways. First, although complement-binding assays were not performed in this study, we could speculate that the complement binding capacity of de novo DSA, regardless of DSA intensity, Table 3. Characteristics of de novo donor-specific antibodies leading to AMR in KTRs according to detection timing
De novo DSA Entire
(n = 16)DSA
6 months (n = 2)DSA
12 months (n = 4)DSA
≥ 24 months (n = 7)DSA
Clinically indicated (n = 3)
DSA (+) AMR (−)
(n = 13)
DSA (+) AMR (+)
(n = 3)
P value
Mean No. 1.8 ± 1.2 1.0 1.0 2.4 ± 1.5 2.0 ± 1.0 1.7 ± 1.3 2.3 ± 1.2 0.364
Average MFI 7,399.3 ± 5,470.4 2,016.0 ± 732.6 8,531.8 ± 8,119.2 7,773.9 ± 4,515.4 8,604.0 ± 5,468.8 6,692.6 ± 5,823.1 10,461.3 ± 1,917.4 0.296 DQ 7,174.3 ± 6,520.9 2,016.0 ± 732.6 8,531.8 ± 8,119.2 6,451.7 ± 5,269.7 12,234.6 ± 8,471.5 7,448.1 ± 6,812.6 11,600.0 ± 978.6 0.060
DR 5,169.0 ± 4,992.7 0 0 3,614.5 ± 5,427.0 1,904.0 ± 1,717.9 4,600.5 ± 4,212.9 6,306.0 ± 8,216.6 0.738
Peak MFI 8,611.4 ± 6,588.0 2,016.0 ± 732.6 8,531.8 ± 8,119.2 8,949.0 ± 5,408.8 12,327.0 ± 8,601.1 7,737.3 ± 7,039.6 12,399.3 ± 1,300.9 0.364 DQ 8,174.9 ± 6,614.8 2,016.0 ± 732.6 8,531.8 ± 8,119.2 6,783.3 ± 5,649.5 12,327.0 ± 8,601.1 7,725.5 ± 7,028.7 11,095.5 ± 265.2 0.111
DR 5,810.0 ± 5,961.3 0 0 4,164.0 ± 6,351.8 1,904.0 ± 1,717.9 5,343.8 ± 5,687.4 6,742.5 ± 8,833.9 0.819
Number × Average MFI 15,155.9 ± 16,166.5 2,016.0 ± 732.6 8,531.8 ± 8,119.2 20,255.0 ± 18,800.9 20,850.0 ± 20,013.5 13,089.1 ± 16,581.0 24,112.0 ± 12,747.6 0.189 DQ 11,722.0 ± 12,076.2 2,016.0 ± 732.6 8,531.8 ± 8,119.2 11,485.9 ± 11,996.8 18,945.3 ± 19,127.3 10,761.8 ± 12,463.6 17,746.0 ± 9,670.4 0.467
DR 11,071.2 ± 14,840.7 0 0 8,673.6 ± 14,681.4 1,904.0 ± 1,717.9 7,313.3 ± 9,612.5 18,587.0 ± 25,584.5 0.644
The average time
to first detection, mon 24.0 ± 14.8 6.5 ± 0.7 12.3 ± 1.9 33.1 ± 11.8 30.0 ± 17.3 24.5 ± 15.1 22.0 ± 16.6 0.636 Type of DSA (No.) DQ (10), DR (1),
DQ + DR (5) DQ (2) DQ (4) DQ (3), DR (1),
DQ + DR (3) DQ (1),
DQ + DR (2) DQ (9), DR (0),
DQ + DR (4) DQ (1), DR (1), DQ + DR (1) TAC trough levels,
ng/mL
0–2 mon 6.63 ± 1.29 6.61 ± 1.23 0.978
3–6 mon 4.98 ± 1.38 6.54 ± 0.98 0.090
7–12 mon 4.63 ± 2.18 5.66 ± 0.99 0.446
CV (%) 26.4 ± 17.3 17.6 ± 1.1 0.093
Values are shown as mean ± standard deviation. P value shows significance of the difference in values between DSA (+) AMR (−) and DSA (+) AMR (+).
KTRs = kidney transplant recipients, DSA = donor-specific anti-human leukocyte antigens antibodies, AMR = antibody-mediated rejection, MFI = mean fluorescence intensity, TAC = tacrolimus, CV = coefficient of variation.
Table 4. Correlation between MI score and de novo DSA characteristics leading to AMR in KTRs
MI Coefficient of correlation P value
Average MFI 0.000 1.000
Peak MFI 0.816 0.221
Mean number × Average MFI 0.866 0.333
MI = microcirculation inflammation, AMR = antibody-mediated rejection, DSA = donor-specific anti-human leukocyte antigens antibodies, KTRs = kidney transplant recipients, MFI = mean fluorescence intensity.
Table 5. Results of indication biopsies in KTRs with AMR and TCMR based on the Banff 2013 classification system
Variables No. DSA status Stage g ptc i t v ci ct cv ah cg mm c4d in
ptc
AMR 1 De novo anti-HLA Ab (+) DSA (+) II 3 3 2 1 1 1 1 0 0 0 0 3
2 De novo anti-HLA Ab (+) DSA (+) II 3 2 2 1 0 2 2 1 2 0 0 2
3 De novo anti-HLA Ab (+) DSA (+) II 3 3 3 3 1 2 2 1 0 0 0 3
TCMR 1 De novo anti-HLA Ab (+) DSA (+) III 1 0 1 1 3 2 2 1 0 0 0 0
2 De novo anti-HLA Ab (+) DSA (−) IIA 0 0 3 2 1 1 1 1 0 0 0 0
3 Control IIA 0 0 2 2 1 1 1 1 0 0 0 0
4 Control IB 0 1 2 3 0 1 1 1 0 0 0 0
5 Control IA 0 1 2 2 0 1 1 0 2 0 0 1
6 Control IA 0 1 2 2 0 3 2 1 0 0 0 0
7 Control IA 0 0 2 2 0 1 1 0 0 0 0 0
8 Control IA 0 0 2 2 0 2 2 0 1 0 0 2
Banff scoring categories: g = glomerulitis, ptc = peritubular capillary inflammation, I = interstitial inflammation, t = tubulitis, v = vascular inflammation, ci = interstitial fibrosis, ct = tubular atrophy, cv = arterial fibrointimal thickening, ah = arteriolar hyaline thickening, cg = transplant glomerulopathy, mm = mesangial matrix increase.
KTRs = kidney transplant recipients, AMR = antibody-mediated rejection, TCMR = T-cell medicated rejection, DSA = donor-specific anti-human leukocyte antigens antibodies, anti-HLA Ab = anti-human leukocyte antigens antibodies.
might determine the development of AMR. Second, although information regarding altered strength of immunosuppression at the time of appearance of DSA was not collected, there is a possibility that the degree of intensity of immunosuppressant treatment given by transplant physicians could affect the incidence of AMR. Third, relatively short follow-up duration after the occurrence of DSA might contribute to low incidence of AMR.
The most notable finding of this study was that lower TAC levels during 0–2 months post- transplant were an independent risk factor for the development of de novo DSA. Few studies have tried to investigate the association between TAC trough levels and the risk of de novo DSA. TAC trough levels of < 7 ng/mL between 4 and 12 months after KT24 or < 8 ng/mL during the first year after KT25 were associated with de novo DSA. With respect to the post- transplant periods, the association between TAC trough levels and the development of de novo DSA was different from the results of previous studies. Similar to previous studies, in our study, TAC trough levels of < 7 ng/mL during the first 2 months after KT increased the risk of de novo DSA. We speculate that a lower intensity of immunosuppressive therapy during the initial post-transplant period might play a negative role in terms of long-term immunologic consequences. Therefore, it could be an important task for transplant physicians to keep KTRs from experiencing lower TAC exposure in the therapeutic range so as to prevent the appearance of de novo DSA. However, TAC trough levels of < 7 ng/mL between 3 and 12 months after KT were not associated with the occurrence of de novo DSA in our study. This discrepancy could be explained by differences in induction therapy between the patients included between our study and previous ones. Since a previous study25 included more than 40% of KTRs who did not receive induction therapy, these patients might require relatively higher TAC concentrations for longer durations to prevent the development of DSA than our study population in which all KTRs received induction therapy.
Another important matter for transplant physicians is the detection of de novo DSA that are associated with destructive consequences, as the pathogenic capacity of de novo DSA is not equal. Although it is well known that complement binding capacity of DSA is a crucial factor which influences the pathogenic capacity of DSA,15,16 this indicator is not easily and readily accessible in real-world clinical practice. Therefore, we tried to address the characteristics of DSA leading to AMR which can be quickly available in clinical practice. In this study, contrary to our expectation, de novo DSA resulting in AMR was not detrimental enough in terms of the number and the average MFI values, to be distinguishable from silent de novo DSA. This result might be explained by the prozone effect. The prozone effect refers to false-negative results which arise from factors that interfere with the binding of the secondary detection reagent.26 The factors include high antibody titers leading to complement activation and deposition of C1 complexes on beads, IgM antibody, or other serum factors.26 We speculate that the actual titer of de novo DSA leading to AMR in this study might be higher than what was measured.
The lack of differences in DSA features between KTRs with and without AMR might be because of a small number of patients with DSA leading to AMR. However, considering that higher average MFI of DSA against HLA-DQ showed a trend, albeit not significant, for increased development of AMR, transplant clinicians should be alert regarding the formation of DSA against HLA-DQ with high affinity and increase the intensity of immunosuppressant therapy to the extent that no opportunistic infection occurs because the risk of AMR was significantly increased in the de novo DSA group compared to the persistently non-sensitized group.
To understand the detrimental effects of circulating de novo DSA on intragraft damage, the correlation between DSA in peripheral blood and histopathological lesions in renal allografts
should be defined. Among the histopathological findings, the MI sum score of the renal allograft was reported to be significantly associated with immune activation in peripheral blood.27 Similarly, previous studies have demonstrated that the detection of de novo DSA was significantly associated with microvascular lesions or peritubular capillaritis scores,28 but not with scarring lesions.10,11 Contrary to previous evidences, in our experience, we could not find any pathologic correlation with de novo DSA. No significant association was detected between MI sum score and the number and intensity of DSA. This might be because of fewer acute rejection episodes in this study.
This study has some limitations. First, as this was a single center study, we included a relatively small number of subjects. Second, longer follow-up duration is needed to compare allograft survival according to the presence of de novo DSA. Third, we did not perform complement- binding assays, such as binding to C1q or C3d, which might have yielded more useful results.
Fourth, we did not perform renal allograft biopsies for KTRs with de novo DSA and stable renal function to exclude subclinical AMR. Therefore, we cannot completely exclude the possibility that subclinical humoral lesions can be present in those KTRs. Further and larger controlled studies are needed to provide confirmative and definitive conclusions regarding the clinical significance of early diagnosis and treatment in subclinical AMR in KTRs.
In conclusion, maintaining proper TAC trough levels during the initial period after KT to prevent the development of DSA, and regular immunological monitoring to detect DSA, are needed in KTRs because de novo DSA can increase the incidence of acute AMR. Close clinical monitoring and prompt interventions are imperative in KTRs with de novo DSA to reduce allograft damage induced by AMR.
REFERENCES
1. Loupy A, Hill GS, Jordan SC. The impact of donor-specific anti-HLA antibodies on late kidney allograft failure. Nat Rev Nephrol 2012;8(6):348-57.
PUBMED | CROSSREF
2. Einecke G, Sis B, Reeve J, Mengel M, Campbell PM, Hidalgo LG, et al. Antibody-mediated microcirculation injury is the major cause of late kidney transplant failure. Am J Transplant 2009;9(11):2520-31.
PUBMED | CROSSREF
3. Heilman RL, Nijim A, Desmarteau YM, Khamash H, Pando MJ, Smith ML, et al. De novo donor-specific human leukocyte antigen antibodies early after kidney transplantation. Transplantation 2014;98(12):1310-5.
PUBMED | CROSSREF
4. Campos EF, Tedesco-Silva H, Machado PG, Franco M, Medina-Pestana JO, Gerbase-DeLima M. Post- transplant anti-HLA class II antibodies as risk factor for late kidney allograft failure. Am J Transplant 2006;6(10):2316-20.
PUBMED | CROSSREF
5. Mohan S, Palanisamy A, Tsapepas D, Tanriover B, Crew RJ, Dube G, et al. Donor-specific antibodies adversely affect kidney allograft outcomes. J Am Soc Nephrol 2012;23(12):2061-71.
PUBMED | CROSSREF
6. Sun Q, Cheng Z, Cheng D, Chen J, Ji S, Wen J, et al. De novo development of circulating anti-endothelial cell antibodies rather than pre-existing antibodies is associated with post-transplant allograft rejection.
Kidney Int 2011;79(6):655-62.
PUBMED | CROSSREF
7. Mao Q, Terasaki PI, Cai J, Briley K, Catrou P, Haisch C, et al. Extremely high association between appearance of HLA antibodies and failure of kidney grafts in a five-year longitudinal study. Am J Transplant 2007;7(4):864-71.
PUBMED | CROSSREF
8. Li X, Ishida H, Yamaguchi Y, Tanabe K. Poor graft outcome in recipients with de novo donor-specific anti- HLA antibodies after living related kidney transplantation. Transpl Int 2008;21(12):1145-52.
PUBMED | CROSSREF
9. DeVos JM, Patel SJ, Burns KM, Dilioglou S, Gaber LW, Knight RJ, et al. De novo donor specific antibodies and patient outcomes in renal transplantation. Clin Transpl 2011:351-8.
PUBMED
10. Wiebe C, Gibson IW, Blydt-Hansen TD, Karpinski M, Ho J, Storsley LJ, et al. Evolution and clinical pathologic correlations of de novo donor-specific HLA antibody post kidney transplant. Am J Transplant 2012;12(5):1157-67.
PUBMED | CROSSREF
11. Hidalgo LG, Campbell PM, Sis B, Einecke G, Mengel M, Chang J, et al. De novo donor-specific antibody at the time of kidney transplant biopsy associates with microvascular pathology and late graft failure. Am J Transplant 2009;9(11):2532-41.
PUBMED | CROSSREF
12. Ntokou IS, Iniotaki AG, Kontou EN, Darema MN, Apostolaki MD, Kostakis AG, et al. Long-term follow up for anti-HLA donor specific antibodies postrenal transplantation: high immunogenicity of HLA class II graft molecules. Transpl Int 2011;24(11):1084-93.
PUBMED | CROSSREF
13. Reed EF, Rao P, Zhang Z, Gebel H, Bray RA, Guleria I, et al. Comprehensive assessment and
standardization of solid phase multiplex-bead arrays for the detection of antibodies to HLA-drilling down on key sources of variation. Am J Transplant 2013;13(11):3050-1.
PUBMED | CROSSREF
14. Yamamoto T, Watarai Y, Takeda A, Tsujita M, Hiramitsu T, Goto N, et al. De novo anti-HLA DSA characteristics and subclinical antibody-mediated kidney allograft injury. Transplantation 2016;100(10):2194-202.
PUBMED | CROSSREF
15. Sicard A, Ducreux S, Rabeyrin M, Couzi L, McGregor B, Badet L, et al. Detection of C3d-binding donor- specific anti-HLA antibodies at diagnosis of humoral rejection predicts renal graft loss. J Am Soc Nephrol 2015;26(2):457-67.
PUBMED | CROSSREF
16. Loupy A, Lefaucheur C, Vernerey D, Prugger C, Duong van Huyen JP, Mooney N, et al. Complement- binding anti-HLA antibodies and kidney-allograft survival. N Engl J Med 2013;369(13):1215-26.
PUBMED | CROSSREF
17. Wehmeier C, Hönger G, Cun H, Amico P, Hirt-Minkowski P, Georgalis A, et al. Donor specificity but not broadness of sensitization is associated with antibody-mediated rejection and graft loss in renal allograft recipients. Am J Transplant 2017;17(8):2092-102.
PUBMED | CROSSREF
18. Salvadé I, Aubert V, Venetz JP, Golshayan D, Saouli AC, Matter M, et al. Clinically-relevant threshold of preformed donor-specific anti-HLA antibodies in kidney transplantation. Hum Immunol 2016;77(6):483-9.
PUBMED | CROSSREF
19. Rodrigo E, Segundo DS, Fernández-Fresnedo G, López-Hoyos M, Benito A, Ruiz JC, et al. Within-patient variability in tacrolimus blood levels predicts kidney graft loss and donor-specific antibody development.
Transplantation 2016;100(11):2479-85.
PUBMED | CROSSREF
20. Haas M, Sis B, Racusen LC, Solez K, Glotz D, Colvin RB, et al.Banff meeting report writing committee.
Banff 2013 meeting report: inclusion of c4d-negative antibody-mediated rejection and antibody- associated arterial lesions. Am J Transplant 2014;14(2):272-83.
PUBMED | CROSSREF
21. Terasaki PI, Ozawa M. Predictive value of HLA antibodies and serum creatinine in chronic rejection:
results of a 2-year prospective trial. Transplantation 2005;80(9):1194-7.
PUBMED | CROSSREF
22. Lachmann N, Terasaki PI, Budde K, Liefeldt L, Kahl A, Reinke P, et al. Anti-human leukocyte antigen and donor-specific antibodies detected by luminex posttransplant serve as biomarkers for chronic rejection of renal allografts. Transplantation 2009;87(10):1505-13.
PUBMED | CROSSREF
23. Pratschke J, Dragun D, Hauser IA, Horn S, Mueller TF, Schemmer P, et al. Immunological risk assessment:
the key to individualized immunosuppression after kidney transplantation. Transplant Rev (Orlando) 2016;30(2):77-84.
PUBMED | CROSSREF
24. Gatault P, Kamar N, Büchler M, Colosio C, Bertrand D, Durrbach A, et al. Reduction of extended-release tacrolimus dose in low-immunological-risk kidney transplant recipients increases risk of rejection and appearance of donor-specific antibodies: a randomized study. Am J Transplant 2017;17(5):1370-9.
PUBMED | CROSSREF
25. Davis S, Gralla J, Klem P, Tong S, Wedermyer G, Freed B, et al. Lower tacrolimus exposure and time in therapeutic range increase the risk of de novo donor-specific antibodies in the first year of kidney transplantation. Am J Transplant 2017;18(4):907-15.
PUBMED | CROSSREF
26. Konvalinka A, Tinckam K. Utility of HLA antibody testing in kidney transplantation. J Am Soc Nephrol 2015;26(7):1489-502.
PUBMED | CROSSREF
27. Jung HY, Kim YJ, Choi JY, Cho JH, Park SH, Kim YL, et al. Increased circulating T lymphocytes expressing HLA-DR in Kidney transplant recipients with microcirculation inflammation. J Korean Med Sci 2017;32(6):908-18.
PUBMED | CROSSREF
28. Chung BH, Kim JH, Choi BS, Park CW, Kim JI, Moon IS, et al. Clinical significance of the presence of anti-human leukocyte antigen-donor specific antibody in kidney transplant recipients with allograft dysfunction. Korean J Intern Med 2018;33(1):157-67.
PUBMED | CROSSREF