ABSTRACT
Background: Although vitamin D deficiency is prevalent in patients with chronic obstructive pulmonary disease (COPD), the influence of vitamin D deficiency on COPD has not
been fully established. Moreover, the inflammation process is associated with vitamin D deficiency in the general population. Therefore, this study aimed to determine whether clinical phenotypes, comorbidities, and exacerbation rates are affected by the level of plasma fibrinogen, well studied by an inflammatory marker in COPD patients, and 25-hydroxy (25- OH) vitamin D.
Methods: This retrospective study analyzed patients with COPD whose inflammatory marker levels, especially plasma fibrinogen and 25-OH vitamin D levels, had been examined. A correlation analysis was conducted for inflammatory markers and 25-OH vitamin D. Clinical characteristics, comorbidities and exacerbation rates were compared among four groups based on plasma fibrinogen concentrations (threshold, 350 mg/dL) and 25-OH vitamin D levels (threshold, 20 ng/mL).
Results: Among 611 patients with COPD, 236 were included in the study. The levels of inflammatory markers had no statistical correlation with the serum 25-OH vitamin D levels. The four groups showed no statistically significant differences in age, sex, smoking history, inhaler use, and severity of comorbidities. Patients with high plasma fibrinogen concentrations and low 25-OH vitamin D levels had lower lung function, higher severity index, and higher annual rate of severe exacerbations 12 months before (0.23/year) and after (0.41/year) the measurement of 25-OH vitamin D levels than did the other patients.
Conclusion: Our findings suggested an interaction between vitamin D deficiency and COPD. The measurement of plasma fibrinogen concentrations could help identify a severe phenotypic group among patients with vitamin D deficiency.
Keywords: COPD; Fibrinogen; Vitamin D; Deficiency; Phenotype
Original Article
Received: May 3, 2019 Accepted: Jul 2, 2019 Address for Correspondence:
Jae Seung Lee, MD, PhD
Department of Pulmonary and Critical Care Medicine, Asan Medical Center, University of Ulsan College of Medicine, 88 Olympic-ro 43-gil, Songpa-gu, Seoul 05505, Korea.
E-mail: [email protected]
© 2019 The Korean Academy of Medical Sciences.
This is an Open Access article distributed under the terms of the Creative Commons Attribution Non-Commercial License (https://
creativecommons.org/licenses/by-nc/4.0/) which permits unrestricted non-commercial use, distribution, and reproduction in any medium, provided the original work is properly cited.
ORCID iDs Dong-gon Hyun
https://orcid.org/0000-0001-5434-2223 Yeon-mok Oh
https://orcid.org/0000-0003-0116-4683 Sei Won Lee
https://orcid.org/0000-0003-4814-6730 Sang Do Lee
https://orcid.org/0000-0001-8189-4509 Jae Seung Lee
https://orcid.org/0000-0003-4130-1486 Funding
This study was supported by University of Ulsan College of Medicine in 2019.
Dong-gon Hyun , Yeon-mok Oh , Sei Won Lee , Sang Do Lee , and Jae Seung Lee
Department of Pulmonary and Critical Care Medicine, Asan Medical Center, University of Ulsan College of Medicine, Seoul, Korea
Clinical Phenotypes, Comorbidities, and Exacerbations according
to Serum 25-OH Vitamin D and
Plasma Fibrinogen Levels in Chronic Obstructive Pulmonary Disease
Respiratory Diseases
Disclosure
The authors have no potential conflicts of interest to disclose.
Author Contributions
Conceptualization: Lee JS, Oh YM, Lee SD. Data curation: Hyun DG, Lee JS.
Formal analysis: Hyun DG, Lee JS, Lee SW.
Methodology: Lee JS, Lee SW, Oh YM, Lee SD. Writing - original draft: Hyun DG, Lee JS.
Writing - review & editing: Oh YM, Lee SW, Lee SD.
INTRODUCTION
Patients with chronic obstructive pulmonary disease (COPD) exhibit various phenotypes.1 Comorbidities are often regarded as a part of these phenotypes2 and promote a decline in daily activity,3 reduction of pulmonary function,4 and development of exacerbations.5 In addition, these comorbidities result in a vicious cycle of deterioration.6 Therefore, the evaluation and management of comorbidities are important parts of the treatment strategy for COPD.
Vitamin D deficiency is highly prevalent in COPD.7 Recently, the relationship between vitamin D deficiency and COPD has garnered increasing interest.8 However, the influence of vitamin D deficiency on COPD has not been fully elucidated. Some studies reported that vitamin D levels were associated with COPD risk and disease severity in patients with COPD.9 However, other studies found no association between vitamin D and lung function decline or the development of exacerbations.10 The inflammation process can provide an important clue to the relationship between vitamin D deficiency and COPD.11 In the general population, the relationship between inflammatory markers and vitamin D deficiency has been well studied.12 The levels of many inflammatory biomarkers were inversely associated with vitamin D levels. Because COPD is considered a systemic inflammatory disease rather than just a pulmonary disease, we could consider that the inflammation accelerated by vitamin D deficiency affects the clinical phenotypes of COPD. However, no studies have evaluated the interaction between vitamin D deficiency or inflammatory marker levels and the phenotypes in patients with COPD.
Elevated plasma fibrinogen concentrations are associated with poor lung function, severe phenotypes, and frequent exacerbation.13-15 The United State Food and Drug Administration (USFDA) qualified plasma fibrinogen as a prognostic biomarker for all-cause mortality and exacerbations in COPD patients among inflammatory markers.16 So, we aimed to analyze the clinical phenotypes, comorbidities, and exacerbation rates of COPD according to the plasma fibrinogen concentrations and 25-hydroxy (25-OH) vitamin D levels in this study.
METHODS
Study design
Data from January 2016 to December 2017 were retrospectively collected from the electronic medical records of Asan Medical Center in Seoul, Korea. The database contains information about visitors to the outpatient clinics in pulmonology. Patients with COPD were included on the basis of the following criteria: 1) availability of spirometry results showing a forced expiratory volume in 1 second/forced vital capacity (FEV1/FVC) < 0.7 after bronchodilator therapy, and 2) availability of plasma fibrinogen concentrations and 25-OH vitamin D levels measured at least one time in the outpatient clinics. We excluded patients who had tuberculosis-destroyed lungs, multifocal bronchiectasis on chest radiography, active cancer, an unstable state caused by COPD exacerbations, and no follow-up for the 12 months before the measurement of plasma fibrinogen and 25-OH vitamin D levels. The clinical characteristics, laboratory findings, comorbidities, COPD severity, and exacerbations were compared among four patient groups based on plasma fibrinogen concentrations (threshold, 350 mg/dL) and 25-OH vitamin D levels (threshold, 20 ng/mL).17,18
Measurements
The data on demographics and comorbidities, including age, gender, smoking, body mass index (BMI), inhaler use, and medical conditions, were collected from the electronic medical records of Asan Medical Center. The Charlson comorbidity index (CCI) was calculated to show the severity of the associated comorbid conditions. The modified Medical Research Council (mMRC) scale was used to assess the severity of the patients' dyspnea by administering the questionnaire in the outpatient clinic. Moreover, the COPD assessment test (CAT) score was determined simultaneously. The mMRC and CAT scores were determined on the day the plasma fibrinogen and 25-OH vitamin D levels were measured. The 25-OH vitamin D levels were measured via a radioimmunoassay by using 25-OH Vitamin D Total, RIA CT (DIAsource ImmunoAssays SA, DIAsource, Louvain-la- Neuve, Belgium) and Packard Cobra Gamma Counter Model 5010 (GMI, Ramsey, MN, USA). The plasma fibrinogen concentrations were determined via the Clauss assay by using Dade Thrombin Reagent (Siemens Healthcare Diagnostics Products; Siemens, Erlangen, Germany) and an automated coagulation analyzer (Sysmex® CS-5100 system; Sysmex, Siemens). C-reactive protein (CRP) concentrations were measured using cobas 8000 C702 (Roche Diagnostics, Risch-Rotkreuz, Switzerland). The white blood cell (WBC) and platelet counts were determined using an automated WBC differential analyzer (Sysmex® XN-9100;
Sysmex, Siemens). The plasma fibrinogen and CRP concentrations and the WBC and platelet counts determined simultaneously on the same day of measurement of the 25-OH vitamin D levels were collected for the analysis. The data from the pulmonary function tests on the nearest day of measurement of the 25-OH vitamin D levels, including the diffusing capacity for carbon monoxide (DLCO) and the 6-minute walk distance, were obtained for the patients with COPD according to previous guidelines.19 The history of exacerbations 12 months before and after the measurement of plasma fibrinogen concentrations and 25-OH vitamin D levels was also assessed by the attending physician using a questionnaire about exacerbation, administered on the day each patient visited the outpatient clinic. Exacerbations were defined as an increase in or a new onset of at least two respiratory symptoms and were categorized as moderate exacerbations (requiring additional treatment with systemic glucocorticoids and/
or antibiotics) and severe exacerbations (requiring hospitalization or a visit to the emergency room for treatment).
Statistical analyses
The results are reported as the number (percentage) for categorical variables and the mean ± standard deviations or median (interquartile range [IQR]) for continuous variables. Pearson's correlation coefficient or Spearman's correlation coefficient was used to determine the correlations of variables with 25-OH vitamin D levels. The χ2 test or Fisher's exact test was used to compare categorical variables with normal or non-normal distribution, while one- way analysis of variance or the Kruskal-Wallis test was used for comparing four continuous variables with normal or non-normal distribution, which were corrected using Bonferroni's method as a post hoc analysis. Statistical significance for all measures was set at P < 0.05.
IBM SPSS Statistics for Windows/Macintosh, Version 24.0 (IBM Corp., Armonk, NY, USA) was used for performing all statistical analyses.
Ethics statement
This study was approved by the Institutional Review Board (IRB) of Asan Medical Center (IRB No. 2017-0132) and performed in accordance with the amended Declaration of Helsinki.
Because this study was the retrospective analysis, IRB confirmed the requirement for informed consent was waived.
RESULTS
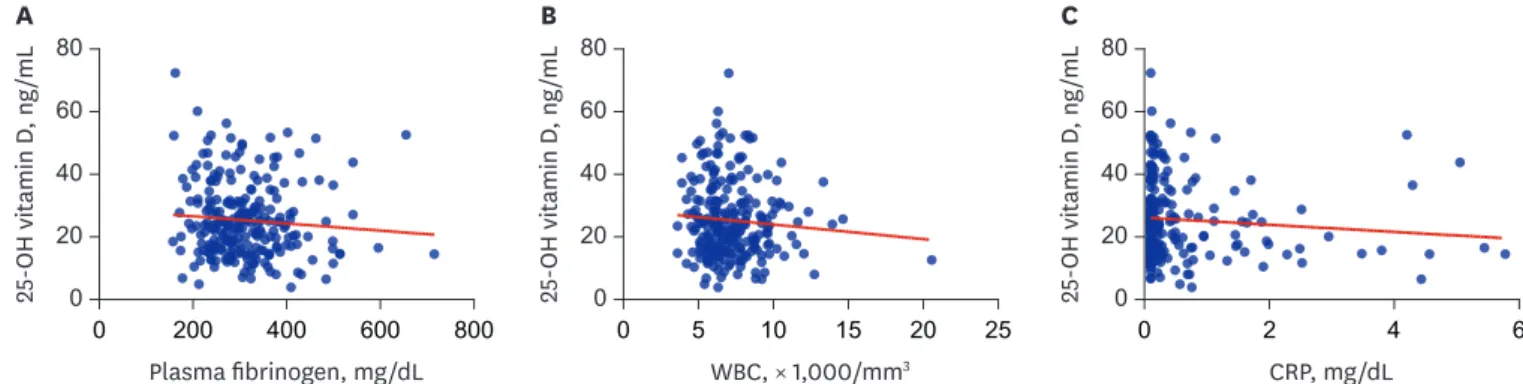
Among 611 patients assessed for eligibility, 236 with available plasma fibrinogen concentrations and 25-OH vitamin D levels were included in the analysis. These graphs show the relationship between inflammatory marker concentrations and 25-OH vitamin D levels (Fig. 1). The plasma fibrinogen concentrations were not statistically associated with the plasma 25-OH vitamin D levels as determined using Spearman's correlation analysis (r =
−0.095, P = 0.144). No significant correlation was observed between 25-OH vitamin D levels and CRP concentrations (r = −0.085, P = 0.211) or WBC counts (r = −0.054, P = 0.407).
The 236 patients were divided into four groups to compare the individual phenotypes of each group by using the cutoff value of plasma fibrinogen concentrations (≥ 350 mg/dL) and 25-OH vitamin D levels (< 20 ng/mL). In addition, data from 141 patients followed up for 1 year after the measurement of 25-OH vitamin D levels were analyzed for evaluating the exacerbation rates after 1 year (Fig. 2).
The baseline characteristics of the 236 patients are shown in Table 1. No statistically significant difference was observed in the baseline variables (age, gender, BMI, smoking history, and inhaler use) between the four groups. Most of the patients were using dual bronchodilator or triple therapy. Respiratory manifestation measured using the mMRC scale showed that three groups with high plasma fibrinogen concentrations or low 25- OH vitamin D levels had more severe symptoms than did patients with normal plasma fibrinogen concentrations and 25-OH vitamin D levels. Two groups with low 25-OH vitamin D levels had a lower FEV1 and lower DLCO. In particular, patients with high plasma fibrinogen concentrations and low plasma 25-OH vitamin D levels had the most severe airflow limitation.
The median values (IQR) of the plasma fibrinogen concentrations, CRP, WBC counts, and 25-OH vitamin D levels were 298.50 mg/dL (245.75–358.5 mg/dL), 0.16 mg/dL (0.1–0.49 mg/dL), 6,750 mm3 (5,800–8,100 mm3), and 23.4 ng/mL (16.22–31.4 ng/mL), respectively, in all patients. The WBC counts, neutrophil counts, and CRP concentrations were similar to the plasma fibrinogen concentrations (Table 2). Patients with high plasma fibrinogen concentrations and low 25-OH vitamin D levels had the highest platelet counts.
Patients with COPD displayed no significant difference in the CCI and in the profiles of comorbidity between the four groups, except for those with diabetes mellitus (DM) and
0 60 80
20 40
25-OH vitamin D, ng/mL
Plasma fibrinogen, mg/dL
0 200 400 600 800
A
0 60 80
20 40
25-OH vitamin D, ng/mL
WBC, × 1,000/mm3
0 5 10 15 20 25
B
0 60 80
20 40
25-OH vitamin D, ng/mL
CRP, mg/dL
0 2 4 6
C
Fig. 1. Scatterplots of inflammatory markers and 25-OH vitamin D (ng/mL) in patients with COPD. (A) Scatterplot of plasma fibrinogen (mg/dL) and 25-OH vitamin D (ng/mL), (B) Scatterplot of WBC (× 1,000/mm3) and 25-OH vitamin D (ng/mL), (C) Scatterplot of CRP (mg/dL) and 25-OH vitamin D (ng/mL).
25-OH = 25-hydroxy, COPD = chronic obstructive pulmonary disease, WBC = white blood cell, CRP = C-reactive protein.
peripheral arterial disease (Table 3). Patients with high plasma fibrinogen concentrations and normal 25-OH vitamin D levels had a significantly higher incidence of DM than did the other patients. Moreover, two groups with high plasma fibrinogen concentrations had a higher proportion of patients with peripheral arterial disease than did those with low plasma fibrinogen concentrations.
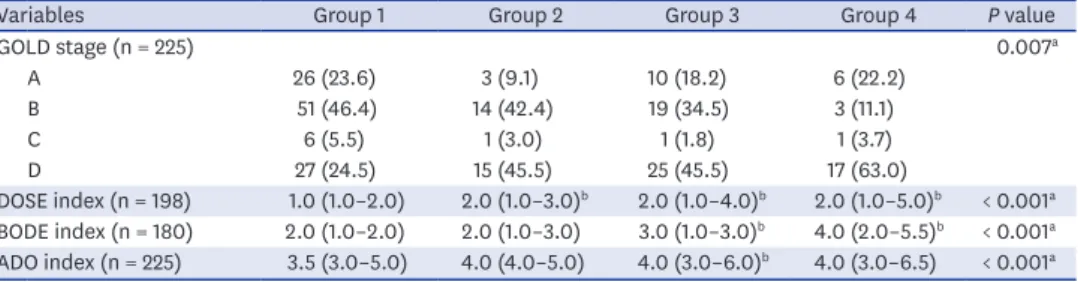
Patients with high plasma fibrinogen concentrations and low 25-OH vitamin D levels had a higher proportion of global initiative for chronic obstructive lung disease (GOLD) stage D, but those with normal plasma fibrinogen concentrations and 25-OH vitamin D levels mainly had GOLD stage B (Table 4). All three indices of COPD severity showed higher scores in patients with vitamin D deficiency than in those without vitamin D deficiency.
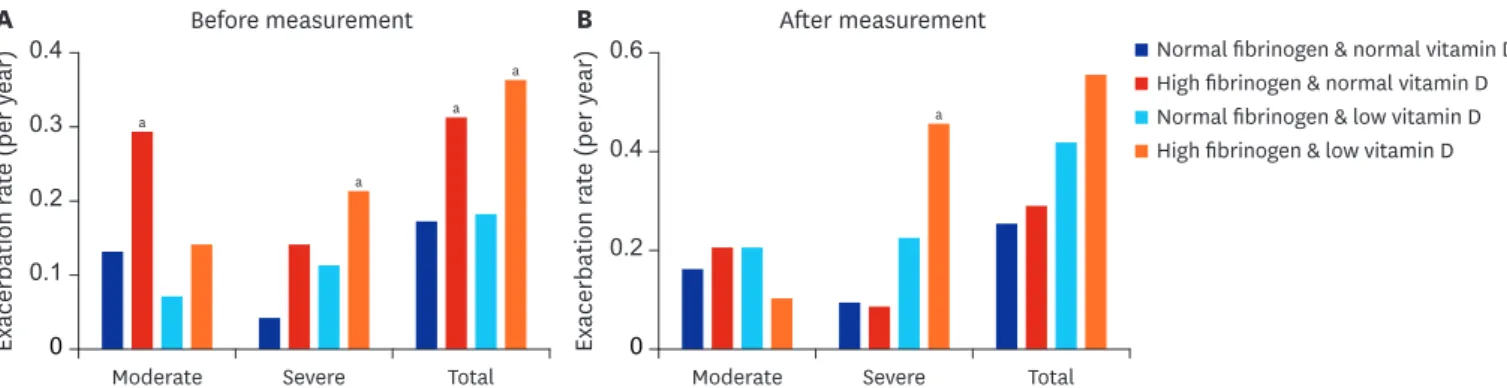
During the previous 1 year, patients with high plasma fibrinogen concentrations and normal 25-OH vitamin D levels had a higher rate of moderate exacerbations (Table 5). However, the rate of severe exacerbations was significantly higher in patients with high plasma fibrinogen concentrations and low 25-OH vitamin D levels than in the other patients. Only group 4 exhibited a statistically higher rate of severe exacerbations after 1 year than did the other groups, similar to the severe exacerbations observed the year before (Fig. 3).
Patients with COPD attending outpatient clinic
n = 611
- FEV1/FVC < 0.70
- Available data of plasma fibrinogen and 25-OH vitamin D
Eligible patients n = 236
No meeting inclusion criteria n = 375
Group 1 (High 25-OH vitamin D
and low fibrinogen) n = 112 (47.5%)
Group 2 (High 25-OH vitamin D
and high fibrinogen) n = 35 (14.8%)
Group 3 (Low 25-OH vitamin D
and low fibrinogen) n = 61 (25.8%)
Group 4 (Low 25-OH vitamin D
and high fibrinogen) n = 28 (11.9%)
Followed up for 1 year after measurements
n = 55 (49.1%)
Followed up for 1 year after measurements
n = 25 (71.4%)
Followed up for 1 year after measurements
n = 41 (67.2%)
Followed up for 1 year after measurements n = 20 (71.4%) Fig. 2. The classification of patients with COPD stratified according to the plasma fibrinogen concentrations and 25-OH vitamin D levels.
COPD = chronic obstructive pulmonary disease, 25-OH = 25-hydroxy, FEV1 = forced expiratory volume in 1 second, FVC = forced vital capacity.
DISCUSSION
In this study, we found that patients with high plasma fibrinogen concentrations and low 25- OH vitamin D levels presented a lower pulmonary function, higher COPD severity index, and higher rate of severe exacerbations over a 24-month period, but showed a lower incidence of DM than did those with only high plasma fibrinogen concentrations. To our knowledge, this is the first study to examine COPD phenotypes by using inflammatory markers and vitamin D levels. This result suggested a relationship between severe phenotypes and severe exacerbations in a certain group of patients with COPD and vitamin D deficiency. The measurement of plasma fibrinogen concentrations could help identify a severe phenotypic group among patients with vitamin D deficiency.
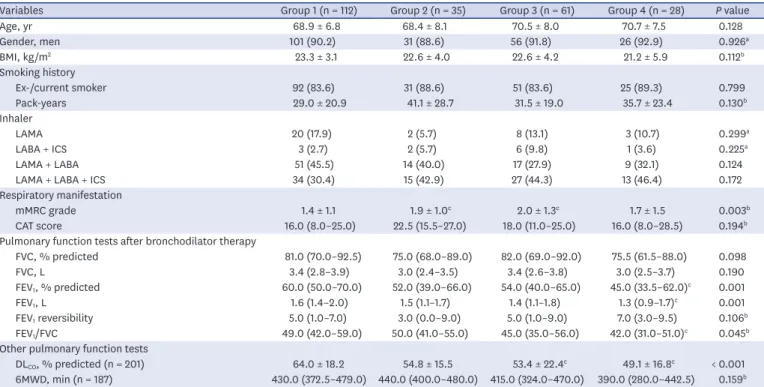
Table 1. Patient characteristics
Variables Group 1 (n = 112) Group 2 (n = 35) Group 3 (n = 61) Group 4 (n = 28) P value
Age, yr 68.9 ± 6.8 68.4 ± 8.1 70.5 ± 8.0 70.7 ± 7.5 0.128
Gender, men 101 (90.2) 31 (88.6) 56 (91.8) 26 (92.9) 0.926a
BMI, kg/m2 23.3 ± 3.1 22.6 ± 4.0 22.6 ± 4.2 21.2 ± 5.9 0.112b
Smoking history
Ex-/current smoker 92 (83.6) 31 (88.6) 51 (83.6) 25 (89.3) 0.799
Pack-years 29.0 ± 20.9 41.1 ± 28.7 31.5 ± 19.0 35.7 ± 23.4 0.130b
Inhaler
LAMA 20 (17.9) 2 (5.7) 8 (13.1) 3 (10.7) 0.299a
LABA + ICS 3 (2.7) 2 (5.7) 6 (9.8) 1 (3.6) 0.225a
LAMA + LABA 51 (45.5) 14 (40.0) 17 (27.9) 9 (32.1) 0.124
LAMA + LABA + ICS 34 (30.4) 15 (42.9) 27 (44.3) 13 (46.4) 0.172
Respiratory manifestation
mMRC grade 1.4 ± 1.1 1.9 ± 1.0c 2.0 ± 1.3c 1.7 ± 1.5 0.003b
CAT score 16.0 (8.0–25.0) 22.5 (15.5–27.0) 18.0 (11.0–25.0) 16.0 (8.0–28.5) 0.194b
Pulmonary function tests after bronchodilator therapy
FVC, % predicted 81.0 (70.0–92.5) 75.0 (68.0–89.0) 82.0 (69.0–92.0) 75.5 (61.5–88.0) 0.098
FVC, L 3.4 (2.8–3.9) 3.0 (2.4–3.5) 3.4 (2.6–3.8) 3.0 (2.5–3.7) 0.190
FEV1, % predicted 60.0 (50.0–70.0) 52.0 (39.0–66.0) 54.0 (40.0–65.0) 45.0 (33.5–62.0)c 0.001
FEV1, L 1.6 (1.4–2.0) 1.5 (1.1–1.7) 1.4 (1.1–1.8) 1.3 (0.9–1.7)c 0.001
FEV1 reversibility 5.0 (1.0–7.0) 3.0 (0.0–9.0) 5.0 (1.0–9.0) 7.0 (3.0–9.5) 0.106b
FEV1/FVC 49.0 (42.0–59.0) 50.0 (41.0–55.0) 45.0 (35.0–56.0) 42.0 (31.0–51.0)c 0.045b
Other pulmonary function tests
DLCO, % predicted (n = 201) 64.0 ± 18.2 54.8 ± 15.5 53.4 ± 22.4c 49.1 ± 16.8c < 0.001
6MWD, min (n = 187) 430.0 (372.5–479.0) 440.0 (400.0–480.0) 415.0 (324.0–470.0) 390.0 (280.0–442.5) 0.159b Values are presented as median (interquartile range), mean ± standard deviation, or number (%).
BMI = body mass index, LAMA = long-acting muscarinic antagonist, LABA = long-acting beta-2 agonist, ICS = inhaled corticosteroid, mMRC = modified Medical Research Council Dyspnea Scale, CAT = chronic obstructive pulmonary disease assessment test, FVC = forced vital capacity, FEV1 = forced expiratory volume in 1 second, DLCO = diffusing capacity for carbon monoxide, 6MWD = 6-minute walk distance.
aFisher's exact test for categorical variables; bKruskal-Wallis test for continuous variables; cvs. group 1.
Table 2. Laboratory data
Laboratory finding Group 1 (n = 112) Group 2 (n = 35) Group 3 (n = 61) Group 4 (n = 28) P value
WBC, × 1,000/mm3 6.4 (5.8–7.8) 7.7 (6.1–8.8) 6.4 (5.6–7.9) 7.5 (6.5–8.9)a,c 0.013d
Neutrophils, × 1,000/mm3 3.54 (2.87–4.48) 4.45 (3.39–5.73)a 3.69 (2.96–4.60) 4.09 (3.53–6.25)a 0.007d Lymphocytes, × 1,000/mm3 2.13 (1.79–2.71) 2.10 (1.65–2.31) 2.01 (1.66–2.48) 2.24 (1.76–2.47) 0.495d
Monocytes, × 1,000/mm3 0.52 (0.44–0.64) 0.62 (0.46–0.76) 0.53 (0.46–0.66) 0.60 (0.46–0.78) 0.180d
Eosinophils, × 1,000/mm3 0.18 (0.11–0.29) 0.16 (0.09–0.25) 0.16 (0.08–0.34) 0.18 (0.11–0.35) 0.809d Platelets, × 1,000/mm3 217.0 (188.3–254.5) 232.0 (205.0–278.0) 222.0 (186.5–265.5) 241.0 (213.3–290.8)a 0.029
CRP, mg/dL 0.1 (0.1–0.2) 0.8 (0.3–1.6)a 0.1 (0.1–0.2)b 1.0 (0.7–2.4)a,c < 0.001d
Plasma fibrinogen, mg/dL 269.8 ± 47.7 414.4 ± 64.4a 270.7 ± 44.3b 430.6 ± 83.7a,c < 0.001d
25-OH vitamin D 31.6 ± 10.1 33.2 ± 10.5 14.4 ± 3.4a,b 13.8 ± 4.2a,b < 0.001d
Values are presented as median (interquartile range) or mean ± standard deviation.
WBC = white blood cell, CRP = C-reactive protein.
avs. group 1; bvs. group 2; cvs. group 3; dKruskal-Wallis test for continuous variables.
Although this group presented severe phenotypes, the relationship between the plasma fibrinogen concentrations and 25-OH vitamin D levels was not significant in this study.
The median 25-OH vitamin D level was 23.4 ng/mL in all patients included in this study.
Almost all patients had vitamin D insufficiency and about half of them satisfied the criteria of vitamin D deficiency, as shown in a previous study.20 This means that vitamin D deficiency had already progressed in many of the patients in the present study. Therefore, a correlation may not be clear because the study was performed on patients with COPD who already had Table 3. Profile of comorbidities
Variables Group 1 (n = 112) Group 2 (n = 35) Group 3 (n = 61) Group 4 (n = 28) P value
CCI 1.0 (1.0–2.0) 1.0 (1.0–2.0) 1.0 (1.0–2.0) 1.5 (1.0–2.0) 0.088a
Age-adjusted CCI 4.0 (3.0–4.5) 4.0 (3.0–5.0) 4.0 (4.0–5.0) 4.0 (3.5–5.0) 0.125a
DM 9 (8.0) 10 (28.6) 11 (18.0) 3 (10.7) 0.014b
Cardiovascular disease 16 (14.3) 7 (20.0) 11 (18.0) 7 (25.0) 0.559
Coronary arterial disease 7 (6.2) 5 (14.3) 5 (8.2) 1 (3.6) 0.364b
Cerebrovascular disease 5 (4.5) 0 (0.0) 3 (4.9) 2 (7.1) 0.529b
Heart failure 4 (3.6) 2 (5.7) 4 (6.6) 3 (10.7) 0.494b
Peripheral arterial disease 0 (0.0) 2 (5.7) 1 (1.6) 2 (7.1) 0.044b
Chronic kidney disease 2 (1.8) 1 (2.9) 1 (1.6) 1 (3.6) 0.918b
Liver disease 2 (1.8) 0 (0.0) 3 (4.9) 0 (0.0) 0.292b
Solid cancer 8 (7.1) 1 (2.9) 4 (6.6) 2 (7.1) 0.833b
Dementia 1 (0.9) 0 (0.0) 3 (4.9) 0 (0.0) 0.150b
Connective tissue disease 1 (0.9) 2 (5.7) 1 (1.6) 1 (3.6) 0.341b
Peptic ulcer disease 1 (0.9) 1 (2.9) 0 (0.0) 0 (0.0) 0.485b
Values are presented as median (interquartile range) or number (%).
CCI = Charlson comorbidity index, DM = diabetes mellitus.
aKruskal-Wallis test for continuous variables; bFisher's exact test for categorical variables.
Table 4. COPD severity
Variables Group 1 Group 2 Group 3 Group 4 P value
GOLD stage (n = 225) 0.007a
A 26 (23.6) 3 (9.1) 10 (18.2) 6 (22.2)
B 51 (46.4) 14 (42.4) 19 (34.5) 3 (11.1)
C 6 (5.5) 1 (3.0) 1 (1.8) 1 (3.7)
D 27 (24.5) 15 (45.5) 25 (45.5) 17 (63.0)
DOSE index (n = 198) 1.0 (1.0–2.0) 2.0 (1.0–3.0)b 2.0 (1.0–4.0)b 2.0 (1.0–5.0)b < 0.001a BODE index (n = 180) 2.0 (1.0–2.0) 2.0 (1.0–3.0) 3.0 (1.0–3.0)b 4.0 (2.0–5.5)b < 0.001a ADO index (n = 225) 3.5 (3.0–5.0) 4.0 (4.0–5.0) 4.0 (3.0–6.0)b 4.0 (3.0–6.5) < 0.001a Values are presented as median (interquartile range) or number (%).
COPD = chronic obstructive pulmonary disease, GOLD = global initiative for chronic obstructive lung disease, DOSE = dyspnea, obstruction, smoking, exacerbation, BODE = body mass index, airflow obstruction, dyspnea, exercise capacity, ADO = age, dyspnea, obstruction.
aKruskal-Wallis test for continuous variables; bvs. group 1.
Table 5. History of acute exacerbations of chronic obstructive pulmonary disease
Variables Group 1
(n = 112) Group 2
(n = 35) Group 3
(n = 61) Group 4
(n = 28) P value Acute exacerbations before 12 months
Moderate 0.13 ± 0.65 0.29 ± 0.57a 0.07 ± 0.25 0.14 ± 0.44 0.017b
Severe 0.04 ± 0.23 0.14 ± 0.69 0.11 ± 0.37 0.21 ± 0.41a 0.007b
Total 0.17 ± 0.68 0.31 ± 0.58a 0.18 ± 0.46 0.36 ± 0.67a 0.015b
Acute exacerbations after 12 months (n = 141)
Moderate 0.16 ± 0.57 0.20 ± 0.40 0.20 ± 0.45 0.10 ± 0.44 0.390b
Severe 0.09 ± 0.44 0.08 ± 0.27 0.22 ± 0.52 0.45 ± 0.75a 0.025b
Total 0.25 ± 0.70 0.28 ± 0.45 0.41 ± 0.70 0.55 ± 0.94 0.301b
Data are mean ± standard deviation.
avs. group 1; bP values are for comparisons of all four groups by using the Kruskal-Wallis test for continuous variables.
vitamin D deficiency. A prospective large-scale study is warranted to confirm the relationship between plasma fibrinogen concentrations and 25-OH vitamin D levels.
Several potential mechanisms could be considered about the influence of vitamin D deficiency on the phenotypes and exacerbations in individuals with COPD. First, vitamin D deficiency promotes the decline of lung function by increasing chronic inflammation.
Vitamin D has various immune modulatory effects.7 Some studies reported that patients with vitamin D deficiency had a greater prevalence of inflammatory bowel disease, rheumatoid arthritis, and psoriasis.21 The dysregulated immune response, attributed to the deficiency of vitamin D, leads to the development of chronic inflammation and progression of lung structural destruction.22,23 The cross-sectional third National Health and Nutrition Examination Survey showed a strong association between vitamin D levels and FEV1.24 In our study, a 38 mL mean difference in FEV1 was observed between patients with normal plasma fibrinogen concentrations and 25-OH vitamin D levels and patients with high plasma fibrinogen concentrations and low 25-OH vitamin D levels. Because the frequency of exacerbations in patients with COPD is known to increase as the pulmonary function worsens,25 patients with high plasma fibrinogen concentrations and low 25-OH vitamin D levels may have a higher exacerbation rate. Additionally, vitamin D has antibacterial and antiviral effects. Several studies have indicated the clinical association between vitamin D deficiency and respiratory infections. A Finnish study conducted on 800 healthy men reported that subjects with 25-OH vitamin D levels < 40 nmol/L had significantly more days of absence from duty because of respiratory infection.26 Another study reported that vitamin D deficiency was associated with an increased risk of mortality in hospitalized adults with community-acquired pneumonia.27 Vitamin D deficiency can trigger the occurrence of viral or bacterial infection and to the development of acute exacerbations of COPD.
Plasma fibrinogen was used as the inflammatory marker for investigating the effect of vitamin D deficiency on COPD in this study. Numerous studies showed that high plasma fibrinogen levels reflected severe symptomatic phenotypes and poor clinical outcomes.13-15 These results led to the qualification of plasma fibrinogen as the first biomarker for the use of drug development tool in COPD under the USFDA. It has been used in several interventional studies for COPD drug development.16 In addition, plasma fibrinogen could be easily measured in the real-clinics. Therefore, it seems that plasma fibrinogen was the best adequate biomarker of COPD among lots of inflammatory markers in this study.
0
Moderate
a
a a
a
a
Severe Total
Exacerbation rate (per year)
0.4
0.2
0.1 0.3
Moderate Severe Total
0 0.6
0.2 0.4
A B
Exacerbation rate (per year)
Normal fibrinogen & low vitamin D Normal fibrinogen & normal vitamin D After measurement
Before measurement
High fibrinogen & normal vitamin D
High fibrinogen & low vitamin D
Fig. 3. Moderate, severe, and total exacerbations of COPD before and after 12 months in the four groups of patients stratified by plasma fibrinogen concentrations and 25-hydroxy vitamin D levels. (A) Moderate, severe, and total exacerbations of COPD before 12 months. (B) Moderate, severe, and total exacerbations of COPD after 12 months.
COPD = chronic obstructive pulmonary disease.
aStatistically significance vs. normal fibrinogen & normal vitamin D group.
Patients with normal plasma fibrinogen concentrations, which were considered to indicate mild COPD, have mild phenotypes and rare exacerbations. The difference between two groups with normal plasma fibrinogen concentrations is the presence of vitamin D deficiency. Although both groups showed a mild status of COPD, patients with vitamin D deficiency had severe symptoms (mMRC), lower DLCO, and higher severity index than did those without vitamin D deficiency. Further studies are needed to determine whether differences in the phenotypes and exacerbation rates between group 1 without vitamin D deficiency and group 3 with vitamin D deficiency occur over time. Among patients with high plasma fibrinogen concentrations, those with vitamin D deficiency presented lesser lung function and higher exacerbation rates than did those without vitamin D deficiency. On the basis of several hypotheses presented above, we may consider that vitamin D deficiency causes the differences between those with high plasma fibrinogen concentrations.
The severity of comorbidity was not different between the studied groups. However, the profile of comorbidity revealed that the percentage of patients with DM and peripheral vascular disease varied among the groups. As shown by previous studies, peripheral vascular disease was frequently found in patients with high plasma fibrinogen concentrations.28 Previous studies on the association between COPD and DM have yielded conflicting results. In some studies, an increased risk of DM was found in patients with COPD,29 but other studies reported no association between COPD and DM.30 A recent Danish study on 13,649 twins showed that patients with chronic bronchitis had an increased risk of DM.31 Because the inflammatory markers such as CRP have been associated with COPD and DM, systemic inflammation has been suggested as a common factor of DM and COPD.32 Similarly, in this study, patients with high plasma fibrinogen concentrations also showed high CRP concentrations. Among them, patients with normal 25-OH vitamin D levels had a high incidence of DM, while those with low 25-OH vitamin D levels had a low incidence of DM. Compared with patients with high plasma fibrinogen concentrations and normal 25-OH vitamin D levels, patients with high plasma fibrinogen concentrations and low 25- OH vitamin D levels had low FEV1, FEV1/FVC, DLCO, and BMI. In a cross-sectional analysis for 2,164 patients with COPD (Evaluation of COPD Longitudinally to Identify Predictive Surrogate End-points study), patients without DM had similar characteristics to our patients with high plasma fibrinogen concentrations and low 25-OH vitamin D levels, such as low BMI, FEV1/FVC, and severe airflow limitation, and their imaging findings revealed a higher percentage of emphysema.33 This suggests that lung destruction induced by vitamin D deficiency could have led to the aggravation of emphysema, which resulted in the low incidence of DM in patients with high plasma fibrinogen concentrations and low 25-OH vitamin D levels rather than in patients with high plasma fibrinogen concentrations and normal 25-OH vitamin D levels.
Some important limitations of the current study need to be pointed out. First, no serial measurement of plasma fibrinogen concentrations and 25-OH vitamin D levels was conducted as part of this retrospective study. Therefore, the changes in phenotype and exacerbations according to the changes in 25-OH vitamin D levels remain unknown.
Second, only about half of the patients were followed up until 1 year after the measurement of plasma fibrinogen concentrations and vitamin D levels. Because the missing information could not be used, there is a possibility of selection bias. Finally, as the study was conducted retrospectively, the explanation about the causal relationship between vitamin D levels and COPD is limited. Additional prospective studies are needed to determine whether vitamin
D deficiency leads to the decline in lung function and exacerbation or to determine whether severe COPD provokes vitamin D deficiency.
In conclusion, patients with high plasma fibrinogen concentrations and low 25-OH vitamin D levels showed severe phenotypes, different profiles of comorbidities, and higher rates of severe exacerbations than did the other patients. This study suggested an interaction between vitamin D deficiency and inflammation process in COPD patients. Therefore, the measurement of plasma fibrinogen concentrations could help identify a certain group of patients having a severe COPD phenotype with vitamin D deficiency.
ACKNOWLEDGMENTS
Editorial support in the form of writing assistance, collation of the authors' comments, and grammatical editing was provided by Joon Seo Lim, PhD, of the Scientific Publications Team of Asan Medical Center, Korea. In addition, Asan Medical Library provided support in terms of assembling the tables and figures and in referencing.
REFERENCES
1. Mannino DM, Buist AS. Global burden of COPD: risk factors, prevalence, and future trends. Lancet 2007;370(9589):765-73.
PUBMED | CROSSREF
2. Chatila WM, Thomashow BM, Minai OA, Criner GJ, Make BJ. Comorbidities in chronic obstructive pulmonary disease. Proc Am Thorac Soc 2008;5(4):549-55.
PUBMED | CROSSREF
3. Mantoani LC, Dell'Era S, MacNee W, Rabinovich RA. Physical activity in patients with COPD: the impact of comorbidities. Expert Rev Respir Med 2017;11(9):685-98.
PUBMED | CROSSREF
4. Zosky GR, Berry LJ, Elliot JG, James AL, Gorman S, Hart PH. Vitamin D deficiency causes deficits in lung function and alters lung structure. Am J Respir Crit Care Med 2011;183(10):1336-43.
PUBMED | CROSSREF
5. Huang YL, Mao B, Mim J, Li GH, Zheng YQ, Wu LH, et al. The associations between comorbidity and exacerbation risk in patients with chronic obstructive pulmonary disease. Zhonghua Jie He He Hu Xi Za Zhi 2018;41(5):349-54.
PUBMED
6. Cavaillès A, Brinchault-Rabin G, Dixmier A, Goupil F, Gut-Gobert C, Marchand-Adam S, et al.
Comorbidities of COPD. Eur Respir Rev 2013;22(130):454-75.
PUBMED | CROSSREF
7. Janssens W, Lehouck A, Carremans C, Bouillon R, Mathieu C, Decramer M. Vitamin D beyond bones in chronic obstructive pulmonary disease: time to act. Am J Respir Crit Care Med 2009;179(8):630-6.
PUBMED | CROSSREF
8. Kokturk N, Baha A, Oh YM, Young Ju J, Jones PW. Vitamin D deficiency: what does it mean for chronic obstructive pulmonary disease (COPD)? A compherensive review for pulmonologists. Clin Respir J 2018;12(2):382-97.
PUBMED | CROSSREF
9. Zhu M, Wang T, Wang C, Ji Y. The association between vitamin D and COPD risk, severity, and exacerbation:
an updated systematic review and meta-analysis. Int J Chron Obstruct Pulmon Dis 2016;11:2597-607.
PUBMED | CROSSREF
10. Kunisaki KM, Niewoehner DE, Connett JE; COPD Clinical Research Network. Vitamin D levels and risk of acute exacerbations of chronic obstructive pulmonary disease: a prospective cohort study. Am J Respir Crit Care Med 2012;185(3):286-90.
PUBMED | CROSSREF
11. Pfeffer PE, Hawrylowicz CM. Vitamin D and lung disease. Thorax 2012;67(11):1018-20.
PUBMED | CROSSREF
12. de Oliveira C, Biddulph JP, Hirani V, Schneider IJ. Vitamin D and inflammatory markers: cross-sectional analyses using data from the English Longitudinal Study of Ageing (ELSA). J Nutr Sci 2017;6:e1.
PUBMED | CROSSREF
13. Mannino DM, Tal-Singer R, Lomas DA, Vestbo J, Graham Barr R, Tetzlaff K, et al. Plasma fibrinogen as a biomarker for mortality and hospitalized exacerbations in people with COPD. Chronic Obstr Pulm Dis 2015;2(1):23-34.
PUBMED | CROSSREF
14. Kim TH, Oh DK, Oh YM, Lee SW, Do Lee S, Lee JS. Fibrinogen as a potential biomarker for clinical phenotype in patients with chronic obstructive pulmonary disease. J Thorac Dis 2018;10(9):5260-8.
PUBMED | CROSSREF
15. Fermont JM, Masconi KL, Jensen MT, Ferrari R, Di Lorenzo VA, Marott JM, et al. Biomarkers and clinical outcomes in COPD: a systematic review and meta-analysis. Thorax 2019;74(5):439-46.
PUBMED | CROSSREF
16. Miller BE, Tal-Singer R, Rennard SI, Furtwaengler A, Leidy N, Lowings M, et al. Plasma fibrinogen qualification as a drug development tool in chronic obstructive pulmonary disease. Perspective of the chronic obstructive pulmonary disease biomarker qualification consortium. Am J Respir Crit Care Med 2016;193(6):607-13.
PUBMED | CROSSREF
17. Holick MF, Binkley NC, Bischoff-Ferrari HA, Gordon CM, Hanley DA, Heaney RP, et al. Evaluation, treatment, and prevention of vitamin D deficiency: an Endocrine Society clinical practice guideline. J Clin Endocrinol Metab 2011;96(7):1911-30.
PUBMED | CROSSREF
18. Groenewegen KH, Postma DS, Hop WC, Wielders PL, Schlösser NJ, Wouters EF, et al. Increased systemic inflammation is a risk factor for COPD exacerbations. Chest 2008;133(2):350-7.
PUBMED | CROSSREF
19. Miller MR, Hankinson J, Brusasco V, Burgos F, Casaburi R, Coates A, et al. Standardisation of spirometry.
Eur Respir J 2005;26(2):319-38.
PUBMED | CROSSREF
20. Janssens W, Bouillon R, Claes B, Carremans C, Lehouck A, Buysschaert I, et al. Vitamin D deficiency is highly prevalent in COPD and correlates with variants in the vitamin D-binding gene. Thorax 2010;65(3):215-20.
PUBMED | CROSSREF
21. Gilbert CR, Arum SM, Smith CM. Vitamin D deficiency and chronic lung disease. Can Respir J 2009;16(3):75-80.
PUBMED | CROSSREF
22. Loukou I, Boutopoulou B, Fouzas S, Douros K. Vitamin D and cystic fibrosis lung disease. Mini Rev Med Chem 2015;15(12):974-83.
PUBMED | CROSSREF
23. Sundar IK, Hwang JW, Wu S, Sun J, Rahman I. Deletion of vitamin D receptor leads to premature emphysema/COPD by increased matrix metalloproteinases and lymphoid aggregates formation. Biochem Biophys Res Commun 2011;406(1):127-33.
PUBMED | CROSSREF
24. Black PN, Scragg R. Relationship between serum 25-hydroxyvitamin d and pulmonary function in the third national health and nutrition examination survey. Chest 2005;128(6):3792-8.
PUBMED | CROSSREF
25. Hurst JR, Vestbo J, Anzueto A, Locantore N, Müllerova H, Tal-Singer R, et al. Susceptibility to exacerbation in chronic obstructive pulmonary disease. N Engl J Med 2010;363(12):1128-38.
PUBMED | CROSSREF
26. Laaksi I, Ruohola JP, Tuohimaa P, Auvinen A, Haataja R, Pihlajamäki H, et al. An association of serum vitamin D concentrations < 40 nmol/L with acute respiratory tract infection in young Finnish men. Am J Clin Nutr 2007;86(3):714-7.
PUBMED | CROSSREF
27. Holter JC, Ueland T, Norseth J, Brunborg C, Frøland SS, Husebye E, et al. Vitamin D status and long-term mortality in community-acquired pneumonia: secondary data analysis from a prospective cohort. PLoS One 2016;11(7):e0158536.
PUBMED | CROSSREF
28. Paraskevas KI, Baker DM, Vrentzos GE, Mikhailidis DP. The role of fibrinogen and fibrinolysis in peripheral arterial disease. Thromb Res 2008;122(1):1-12.
PUBMED | CROSSREF
29. Lee CT, Mao IC, Lin CH, Lin SH, Hsieh MC. Chronic obstructive pulmonary disease: a risk factor for type 2 diabetes: a nationwide population-based study. Eur J Clin Invest 2013;43(11):1113-9.
PUBMED
30. Joo H, Park J, Lee SD, Oh YM. Comorbidities of chronic obstructive pulmonary disease in Koreans: a population-based study. J Korean Med Sci 2012;27(8):901-6.
PUBMED | CROSSREF
31. Meteran H, Backer V, Kyvik KO, Skytthe A, Thomsen SF. Comorbidity between chronic obstructive pulmonary disease and type 2 diabetes: a nation-wide cohort twin study. Respir Med 2015;109(8):1026-30.
PUBMED | CROSSREF
32. Thomsen M, Dahl M, Lange P, Vestbo J, Nordestgaard BG. Inflammatory biomarkers and comorbidities in chronic obstructive pulmonary disease. Am J Respir Crit Care Med 2012;186(10):982-8.
PUBMED | CROSSREF
33. Miller J, Edwards LD, Agustí A, Bakke P, Calverley PM, Celli B, et al. Comorbidity, systemic inflammation and outcomes in the ECLIPSE cohort. Respir Med 2013;107(9):1376-84.
PUBMED | CROSSREF