The Role of Overweight and Obesity on Bone Health in Korean Adolescents with a Focus on Lean and Fat Mass
As the associations between pediatric overweight/obesity and bone health remain controversial, we investigated the effects of overweight/obesity as well as lean mass (LM) and fat mass (FM) on bone parameters in adolescents. Bone parameters were evaluated using dual-energy X-ray absorptiometry (DXA) data of 982 adolescents (aged 12–19 years) from the Korea National Health and Nutrition Examination Survey (2009–2010). Z-scores for LM, FM, bone mass, bone mineral density (BMD), and bone mineral apparent density (BMAD) using Korean pediatric reference values were used for analysis. Adolescents with overweight/obesity had significantly higher bone mass and density of the total-body-less- head (TBLH), lumbar spine, and femur neck than underweight or normal-weight adolescents (P < 0.001) after adjusting for vitamin D deficiency, calcium intake, and insulin resistance in both sexes. LM was positively associated with bone parameters at all skeletal sites in both sexes (P < 0.001). FM was negatively related to TBLH BMD in boys (P = 0.018) but was positively associated to BMD and BMAD of the lumbar spine and femur neck in girls. In conclusion, overweight/obesity and LM play a positive role in bone health in adolescents. The effect of FM on bone parameters is sex- and site-specific.
Keywords: Pediatric Obesity; Body Composition; Bone Density; Adolescent; Korea Hwa Young Kim,1 Hae Woon Jung,2
Hyunsook Hong,3 Jae Hyun Kim,4 Choong Ho Shin,5 Sei Won Yang,5 and Young Ah Lee5
1Department of Pediatrics, Kangwon National University Hospital, Chuncheon, Korea;
2Department of Pediatrics, Kyung Hee University Medical Center, Seoul, Korea; 3Medical Research Collaborating Center, Seoul National University Hospital, Seoul, Korea; 4Department of Pediatrics, Seoul National University Bundang Hospital, Seongnam, Korea; 5Department of Pediatrics, Seoul National University Children’s Hospital, Seoul, Korea Received: 30 May 2017
Accepted: 21 July 2017 Address for Correspondence:
Young Ah Lee, MD, PhD
Department of Pediatrics, Seoul National University Children’s Hospital, 101 Daehak-ro, Jongno-gu, Seoul 03080, Korea E-mail: [email protected]
https://doi.org/10.3346/jkms.2017.32.10.1633 • J Korean Med Sci 2017; 32: 1633-1641
INTRODUCTION
Overweight/obesity in adolescents is being recognized as an important health issue as its prevalence has been increasing worldwide. In Korea, the proportions of adolescents with over- weight/obesity increased from 12.2% in 2011 to 17.3% in 2016 according to 12th Korean Youth Risk Behavior Web-based Sur- vey in 2016 (1). As lifelong bone health, including future frac- ture risk, depends on pediatric bone mass acquisition (2), the effect of childhood overweight/obesity on bone health has been of interest.
It remains controversial whether overweight/obesity during childhood is beneficial or harmful for the acquirement of bone mass (3-5). Individuals with similar body mass index (BMI) were shown to have differences in bone density depending on their proportions of fat mass (FM) and lean mass (LM) (6). While the beneficial effect of LM on bone health is well understood, it re- mains unclear whether FM has a beneficial or harmful effect on bone mass and density; moreover, different results have been reported according to sex (7). Despite a higher body mass, ado- lescents with overweight/obesity have several risk factors for low bone density such as insufficient calcium intake, sedentary lifestyle, vitamin D deficiency, and insulin resistance (8,9).
Due to the significant differences in body and bone sizes with-
in and across different ages, adjustment using the height Z-score or estimation of volumetric bone mineral density (BMD) is rec- ommended when interpreting bone mass in the growing child (10). The recommended scanning sites in pediatric dual-energy X-ray absorptiometry (DXA) examination are the total-body- less-head (TBLH) and lumbar spine (10). Lower bone mass of the femur neck, as measured by DXA, is also associated with fracture risk in children (11). Recently, age- and sex-specific DXA reference values for bone mineral measures, including volumet- ric BMD and body composition, were reported for the Korean pediatric population (12). Therefore, Z-scores of bone mass and areal and volumetric BMD of the TBLH, lumbar spine, and fe- mur neck can now be evaluated in Korean adolescents. In this study, we investigated the effects of overweight/obesity on bone mass and density of the TBLH, lumbar spine, and femur neck after adjusting for potential confounders. Moreover, the associ- ations between FM and LM and bone mass and density were evaluated according to sex.
MATERIALS AND METHODS Study populations
The present study is based on data from the third year (2009) of the Korea National Health and Nutrition Examination Survey Endocrinology, Nutrition & Metabolism
2017-03-16 https://crossmark-cdn.crossref.org/widget/v2.0/logos/CROSSMARK_Color_square.svg
(KNHANES) IV and the first year (2010) of the KNHANES V with permission of the Korea Centers for Disease Control and Pre- vention. The KNHANES is a cross-sectional national survey with a stratified, multistage, clustered probability sampling design and includes a health interview survey, nutrition survey, and health examination. Among 264,186 primary sampling units (based on the 2005 National Census Registry), 200 and 192 sam- pling units were randomly selected, sampling of 23 and 20 house- holds from each of the units; this yielded 4,600 and 3,840 house- holds in 2009 and 2010, respectively. In 2009, 12,722 individuals were sampled, with 10,078 participating in health interviews and examinations and 9,397 participating in the nutrition sur- vey. In 2010, 10,938 individuals were sampled with 8,473 par- ticipating in the health interviews and examinations and 8,027 participating in the nutrition survey.
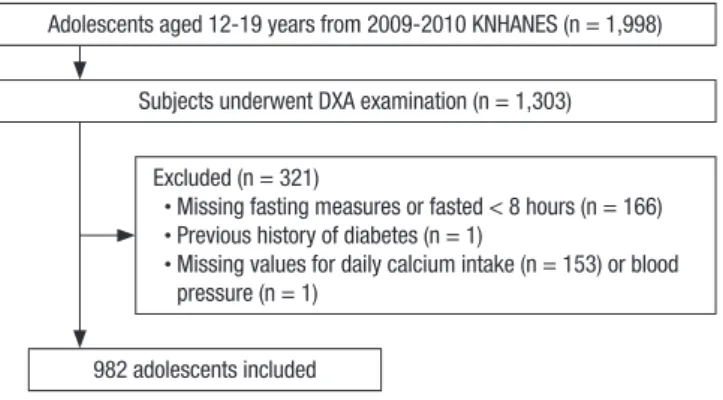
Among the 1,998 study participants aged 12–19 years, 1,303 underwent DXA. We excluded participants with missing fasting measures and/or those who failed to fast for > 8 hours (n = 166), those who had a history of diabetes (n = 1), and those with miss- ing values for daily calcium intake (n = 153) and/or blood pres- sure (n = 1). No participants had fasting glucose levels ≥ 126 mg/dL. In total, 982 participants (508 boys) were included in the final sample (Fig. 1).
Measurements
Anthropometric, bone mass, and body composition data were collected with the subjects wearing light clothes without shoes or jewelry. Height and weight were measured using standard methods, and BMI was calculated as weight divided by height squared. The Z-scores for height, weight, and BMI were assigned on the basis of the 2007 Korean National Growth Charts (13).
We defined underweight (< 15th BMI percentile), normal-weight (15–85th BMI percentile), overweight (85–95th BMI percentile), and obesity (> 95th BMI percentile) according to BMI percen- tiles (14). Vitamin D deficiency was defined as a 25-hydroxyvi- tamin D level of < 20 ng/mL (15). Self-reported questionnaires
were used to assess the dietary intake of calcium using a single 24-hour dietary recall method. Dietary and supplemental calci- um intakes were compared with the dietary recommended in- take (DRI) for Korean children and adolescents: 1,000 mg/day for boys and 900 mg/day for girls aged 12–14 years, 900 mg/day for boys and 800 mg/day for girls aged 15–18 years, and 750 mg/
day for boys and 650 mg/day for girls aged 19–29 years (16). Cal- cium intake levels were categorized as sufficient (≥ DRI) or in- sufficient (< DRI). The participants were asked about the amount and intensity of physical activity during a normal week. The def- inition of regular physical activity was based on the guideline provided by the U.S. Department of Health and Human Servic- es as moderate- or vigorous-intensity physical activity for at least 60 minutes/day on 7 days/week (17).
Biochemical measurements
Blood samples were obtained by venipuncture, refrigerated im- mediately, and transported to the central testing institute. Fast- ing plasma glucose and serum lipids (total cholesterol, high- density lipoprotein cholesterol, and triglycerides) were mea- sured enzymatically with the Hitachi automated analyzer 7600 (Hitachi, Tokyo, Japan), and fasting plasma insulin was deter- mined using a 1470 WIZARD gamma-Counter (Perkin-Elmer, Turku, Finland) and an immunoradiometric assay (Biosource, Fleurus, Belgium). The homeostasis model assessment of insu- lin resistance (HOMA-IR) was calculated as a marker of insulin resistance, as follows:
HOMA-IR = fasting plasma glucose (mg/dL) × fasting plasma insulin (µU/mL)/405
The 25-hydroxyvitamin D concentration was measured by radioimmunoassay using a 1470 WIZARD gamma-Counter (Per- kin-Elmer) and a 25-hydroxyvitamin D 125I radioimmunoassay kit (DiaSorin, Stillwater, MN, USA). At serum 25-hydroxyvitamin D levels of 8.6, 22.8, 33.1, and 49.1 ng/mL, the inter-assay coef- ficients of variation (CV) were 11.7%, 10.5%, 8.6%, and 12.5%, respectively, and the intra-assay CVs were 9.4%, 8.2%, 9.1%, and 11.0%, respectively.
Bone mass and body composition measurements
Bone mineral content (BMC) (g) and BMD (g/cm2) of the TBLH, lumbar spine (L1–L4), and femur neck as well as FM and LM were measured by DXA using the QDR 4500A (Hologic Inc., Wal- tham, MA, USA) at mobile examination centers operated by li- censed trained technicians following a standard protocol. Body and bone size were adjusted using the height Z-score for TBLH or estimation of volumetric BMD for lumbar spine and femur neck (10). TBLH bone mass and density were adjusted using the height Z-score. For the lumbar spine and femur neck, bone mineral apparent density (BMAD) (g/cm3) was used as an esti- mate of volumetric BMD and calculated as follows (18):
Fig. 1. Flowchart of the study population.
KNHANES = Korea National Health and Nutrition Examination Survey, DXA = dual-en- ergy X-ray absorptiometry.
Adolescents aged 12-19 years from 2009-2010 KNHANES (n = 1,998)
Subjects underwent DXA examination (n = 1,303)
982 adolescents included Excluded (n = 321)
∙ Missing fasting measures or fasted < 8 hours (n = 166) ∙ Previous history of diabetes (n = 1)
∙ Missing values for daily calcium intake (n = 153) or blood pressure (n = 1)
Lumbar spine BMAD = lumbar spine BMC/(lumbar spine bone area)1.5
Femur neck BMAD = femur neck BMC/(femur neck bone area)2
Finally, we calculated Z-scores (z) of body composition and bone density using the reference values for Korean children and adolescents (12): zFM, zLM, zBMC, zBMD, and zBMAD.
Statistical analysis
All analyses were performed using sampling weights to report estimates representative of the Korean population. The statisti- cal software package SPSS version 19.0 (SPSS Inc., Chicago, IL, USA) was used to accommodate the complex sampling design with stratification, clustering, and unequal weighting of the KN- HANES sample. A P value < 0.05 was considered significant. All continuous variables are expressed as weighted means with stan- dard errors and categorical variables as numbers and weighted percentages of the participants. Logarithmic conversions were performed for HOMA-IR, daily calcium intake (mg/day), and physical activity (hours/week) to approximate a normal distri- bution, as these variables were not normally distributed. All anal- yses were performed in male and female adolescents separately.
The Rao-Scott χ2 test was used to analyze the associations be- tween categorical variables and categorical BMI groups. We also conducted tests for linear trends (P for linear trend) across the BMI groups. Subgroup analyses were then used to analyze mean differences between groups. Univariate linear regression analyses were used to analyze the associations between base- line characteristics and TBLH, lumbar spine, and femur neck bone parameters. Finally, multivariate linear regression analy-
ses were performed to assess the associations between each categorical group and bone mass or density parameters after adjusting for possible confounders, including age, vitamin D deficiency, calcium intake, physical activity, and HOMA-IR in addition to BMI group or zLM and zFM.
Ethics statement
All study protocols were approved by the Institutional Review Board of the KCDC (Approval No. 2009-01CON-03-2C, 2010- 02CON-21-C). All participants volunteered and provided writ- ten informed consent prior to participating.
RESULTS
Participant characteristics
Among the 982 adolescents (508 boys) aged 12–19 years (15.6 ± 0.1 years), 146 (14.9%) were underweight, 627 (63.8%) normal- weight, and 209 (21.3%) overweight/obesity. Male participants were taller and had a higher proportion of subjects with suffi- cient calcium intake and regular physical activity when com- pared to female participants (P < 0.001 for all). No differences between boys and girls were found in the Z-scores of FM, LM, and bone mass and density of the TBLH, lumbar spine, and fe- mur neck (Table 1).
Table 2 shows the participant characteristics according to BMI groups (underweight, normal-weight, and overweight/obesity groups) for both sexes. HOMA-IR showed a progressive increase from the underweight to normal-weight and overweight/obesi- ty groups for both sexes (P < 0.001 for both).
For both sexes, the overweight/obesity group had significant-
Table 1. Characteristics of participants according to sex
Variables Total Male Female P
No. of participants 982 508 474 -
Age, yr 15.6 ± 0.1 15.5 ± 0.1 15.7 ± 0.1 0.249
Height Z-score 0.2 ± 0.1 0.7 ± 0.1 0.3 ± 0.1 < 0.001
BMI Z-score 0.1 ± 0.1 0.1 ± 0.1 0.1 ± 0.1 0.825
HOMA-IR 2.8 ± 0.1 2.8 ± 0.1 2.7 ± 0.1 0.451
Vitamin D deficiency 758 (77.9) 380 (76.1) 378 (79.9) 0.217
Sufficient calcium intake 102 (10.4) 68 (14.3) 34 (6.0) < 0.001
Regular physical activity 123 (11.7) 92 (17.0) 31 (5.8) < 0.001
FM Z-score, g 0.16 ± 0.05 0.10 ± 0.07 0.23 ± 0.08 0.204
LM Z-score, g 0.19 ± 0.06 0.17 ± 0.07 0.21 ± 0.07 0.635
Total body less head BMC Z-score, g 0.11 ± 0.06 0.17 ± 0.07 0.13 ± 0.08 0.602
Lumbar spine BMC Z-score, g 0.11 ± 0.06 0.14 ± 0.07 0.08 ± 0.07 0.431
Femur neck BMC Z-score, g 0.09 ± 0.05 0.09 ± 0.06 0.10 ± 0.07 0.879
Total body less head BMD Z-score, g/cm2 −0.05 ± 0.07 0.03 ± 0.07 −0.04 ± 0.08 0.365
Lumbar spine BMD Z-score, g/cm2 0.03 ± 0.05 0.07 ± 0.06 −0.02 ± 0.07 0.191
Femur neck BMD Z-score, g/cm2 0.06 ± 0.04 0.04 ± 0.05 0.08 ± 0.06 0.604
Lumbar spine BMAD Z-score, g/cm3 −0.03 ± 0.05 0.01 ± 0.05 −0.07 ± 0.07 0.255
Femur neck BMAD Z-score, g/cm3 0.00 ± 0.04 −0.03 ± 0.05 0.04 ± 0.06 0.361
Data are expressed as the mean ± standard error or number (%).
BMI = body mass index, HOMA-IR = homeostasis model assessment-insulin resistance, FM = fat mass, LM = lean mass, BMC = bone mineral content, BMD = bone mineral density, BMAD = bone mineral apparent density.
Table 2. Characteristics according to the BMI groups (underweight, normal-weight, and overweight/obesity)
Variables
Male (n = 508) Female (n = 474)
Underweight Normal-weight Overweight/
obesity P for trend Underweight Normal-weight Overweight/
obesity P for trend
No. of participants 77 323 108 - 69 304 101 -
Age, yr 15.8 ± 0.3 15.5 ± 0.2 15.5 ± 0.3 0.685 16.4 ± 0.3* 15.6 ± 0.2 15.6 ± 0.3‡ 0.041
Height Z-score 0.4 ± 0.1 0.7 ± 0.1† 1.0 ± 0.1‡ 0.001 0.3 ± 0.2 0.3 ± 0.1 0.4 ± 0.1 0.962
BMI Z-score −1.6 ± 0.1* 0.0 ± 0.0† 1.5 ± 0.0‡ < 0.001 −1.6 ± 0.1* −0.1 ± 0.0† 1.7 ± 0.1‡ < 0.001 HOMA-IR 2.1 ± 0.1* 2.6 ± 0.1† 4.2 ± 0.2‡ < 0.001 2.2 ± 0.1* 2.6 ± 0.1† 3.5 ± 0.2‡ < 0.001 25-hydroxyvitamin D, ng/mL 6.8 ± 0.3 6.7 ± 0.1 6.6 ± 0.2 0.865 7.3 ± 0.4* 6.3 ± 0.2 6.2 ± 0.3‡ 0.031
Vitamin D deficiency 59 (76.9) 237 (76.7) 84 (73.7) 0.885 47 (67.5) 244 (80.0) 87 (87.9)‡ 0.006
Calcium intake, mg/day 595.4 ± 57.2 552.8 ± 25.2 584.4 ± 36.0 0.402 431.7 ± 26.2 423.8 ± 21.6 418.2 ± 22.1 0.438
Sufficient calcium intake 10 (17.9) 43 (12.9) 15 (15.9) 0.630 4 (4.2) 24 (5.8) 6 (8.2) 0.612
Physical activity, hours/week 7.0 ± 1.2 7.8 ± 1.2 8.5 ± 1.1 0.961 2.8 ± 1.2 4.6 ± 0.7 6.0 ± 1.4 0.636 Regular physical activity 11 (20.4) 59 (16.5) 22 (15.8) 0.822 0 (0)* 20 (6.0) 11 (9.3)‡ < 0.001 Data are expressed as the mean ± standard error or number (%).
BMI = body mass index, HOMA-IR = homeostasis model assessment-insulin resistance.
*P < 0.05 between underweight and normal-weight groups. †P < 0.05 between normal-weight and overweight/obese groups. ‡P < 0.05 between underweight and overweight/
obese groups.
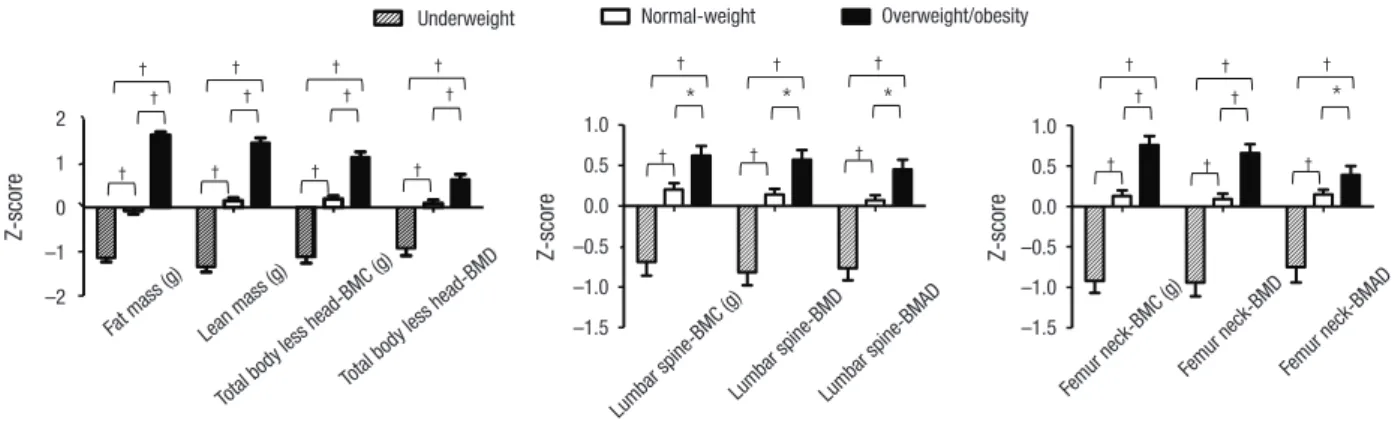
Fig. 2. Comparison of body composition and bone density among the underweight, normal-weight, and overweight/obesity groups in males.
BMC = bone mineral content, BMD = bone mineral density, BMAD = bone mineral apparent density.
*P < 0.01. †P < 0.001.
Underweight Normal-weight Overweight/obesity
-2.0 -1.0 0.0 1.0 2.0
Z-score
-1.5 -1.0 -0.5 0.0 0.5 1.0
Z-score
-1.5 -1.0 -0.5 0.0 0.5 1.0
Z-score
†
†
*
†
†
*
†
†
*
†
†
†
†
†
†
†
†
*
†
†
†
†
†
†
†
†
†
†
†
†
Z-score
Fat mass (g) Lean mass (g) Total bod
y less head-BMC (g) Total bod
y less head-BMD 2
1 0 –1 –2
Underweight Normal-weight Overweight/obesity
-2.0 -1.0 0.0 1.0 2.0
Z-score
-1.5 -1.0 -0.5 0.0 0.5 1.0
Z-score
-1.5 -1.0 -0.5 0.0 0.5 1.0
Z-score
†
†
*
†
†
*
†
†
*
†
†
†
†
†
†
†
†
*
†
†
†
†
†
†
†
†
†
†
†
†
Z-score
Lumbar spine-BMAD 1.0
0.5 0.0 –0.5 –1.0 –1.5
Lumbar spine-BMC (g)Lumbar spine-BMD Underweight
Normal-weight Overweight/obesity
-2.0 -1.0 0.0 1.0 2.0
Z-score
-1.5 -1.0 -0.5 0.0 0.5 1.0
Z-score
-1.5 -1.0 -0.5 0.0 0.5 1.0
Z-score
†
†
*
†
†
*
†
†
*
†
†
†
†
†
†
†
†
*
†
†
†
†
†
†
†
†
†
†
†
†
Z-score
Femur neck-BMD Femur neck-BMAD 1.0
0.5 0.0 –0.5 –1.0 –1.5
Femur neck-BMC (g) Underweight
Normal-weight Overweight/obesity
-2.0 -1.0 0.0 1.0 2.0
Z-score
-1.5 -1.0 -0.5 0.0 0.5 1.0
Z-score
-1.5 -1.0 -0.5 0.0 0.5 1.0
Z-score
†
†
*
†
†
*
†
†
*
†
†
†
†
†
†
†
†
*
†
†
†
†
†
†
†
†
†
†
†
† Underweight Normal-weightUnderweight
Normal-weight Overweight/obesity
-2.0 -1.0 0.0 1.0 2.0
Z-score
-1.5 -1.0 -0.5 0.0 0.5 1.0
Z-score
-1.5 -1.0 -0.5 0.0 0.5 1.0
Z-score
†
†
*
†
†
*
†
†
*
†
†
†
†
†
†
†
†
*
†
†
†
†
†
†
†
†
†
†
†
†
Overweight/obesity Underweight Normal-weight Overweight/obesity
-2.0 -1.0 0.0 1.0 2.0
Z-score
-1.5 -1.0 -0.5 0.0 0.5 1.0
Z-score
-1.5 -1.0 -0.5 0.0 0.5 1.0
Z-score
†
†
*
†
†
*
†
†
*
†
†
†
†
†
†
†
†
*
†
†
†
†
†
†
†
†
†
†
†
†
Fig. 3. Comparison of body composition and bone density among the underweight, normal-weight, and overweight/obesity groups in females.
BMC = bone mineral content, BMD = bone mineral density, BMAD = bone mineral apparent density.
*P < 0.01. †P < 0.001.
Underweight Normal-weight Overweight/obesity
-2.0 -1.0 0.0 1.0 2.0 3.0
Z-score
-1.0 -0.5 0.0 0.5 1.0
Z-score
-1.0 -0.5 0.0 0.5 1.0 1.5
Z-score
†
†
†
†
†
†
†
†
†
†
†
†
†
†
†
*
*
†
†
†
†
†
†
†
†
†
†
†
†
†
Z-score
Fat mass (g)
Lean mass (g) Total bod
y less head-BMC (g) Total bod
y less head-BMD 3
2 1 0 –1 –2
Underweight Normal-weight Overweight/obesity
-2.0 -1.0 0.0 1.0 2.0 3.0
Z-score
-1.0 -0.5 0.0 0.5 1.0
Z-score
-1.0 -0.5 0.0 0.5 1.0 1.5
Z-score
†
†
†
†
†
†
†
†
†
†
†
†
†
†
†
*
*
†
†
†
†
†
†
†
†
†
†
†
†
†
Z-score
Lumbar spine-BMAD 1.0
0.5 0.0 –0.5 –1.0
Lumbar spine-BMC (g)Lumbar spine-BMD Underweight
Normal-weight Overweight/obesity
-2.0 -1.0 0.0 1.0 2.0 3.0
Z-score
-1.0 -0.5 0.0 0.5 1.0
Z-score
-1.0 -0.5 0.0 0.5 1.0 1.5
Z-score
†
†
†
†
†
†
†
†
†
†
†
†
†
†
†
*
*
†
†
†
†
†
†
†
†
†
†
†
†
†
Z-score
Femur neck-BMDFemur neck-BMAD 1.5
1.0 0.5 0.0 –0.5 –1.0
Femur neck-BMC (g) Underweight
Normal-weight Overweight/obesity
-2.0 -1.0 0.0 1.0 2.0
Z-score
-1.5 -1.0 -0.5 0.0 0.5 1.0
Z-score
-1.5 -1.0 -0.5 0.0 0.5 1.0
Z-score
†
†
*
†
†
*
†
†
*
†
†
†
†
†
†
†
†
*
†
†
†
†
†
†
†
†
†
†
†
† Underweight Normal-weightUnderweight
Normal-weight Overweight/obesity
-2.0 -1.0 0.0 1.0 2.0
Z-score
-1.5 -1.0 -0.5 0.0 0.5 1.0
Z-score
-1.5 -1.0 -0.5 0.0 0.5 1.0
Z-score
†
†
*
†
†
*
†
†
*
†
†
†
†
†
†
†
†
*
†
†
†
†
†
†
†
†
†
†
†
†
Overweight/obesity Underweight Normal-weight Overweight/obesity
-2.0 -1.0 0.0 1.0 2.0
Z-score
-1.5 -1.0 -0.5 0.0 0.5 1.0
Z-score
-1.5 -1.0 -0.5 0.0 0.5 1.0
Z-score
†
†
*
†
†
*
†
†
*
†
†
†
†
†
†
†
†
*
†
†
†
†
†
†
†
†
†
†
†
†
ly higher zFM and zLM than the underweight and normal-weight groups (P < 0.001 for all) (Figs. 2 and 3). Moreover, the zBMC and zBMD of the TBLH, lumbar spine, and femur neck and zB-
MAD of the lumbar spine and femur neck were significantly higher in adolescents with overweight/obesity when compared to underweight and normal-weight adolescents for both sexes
(P < 0.01 for all) (Figs. 2 and 3).
Associations between BMI and bone parameters
We constructed a multivariate regression model adjusted for age, vitamin D deficiency, calcium intake, physical activity, and HOMA-IR to assess the effect of BMI on bone parameters (Table 3). For both sexes, increasing BMI was correlated with increas- ing zBMC and zBMD of the TBLH, lumbar spine, and femur neck after adjusting for confounders (all P < 0.001 for all). Vita- min D deficiency was a significant risk factor for low bone mass
and density of the TBLH (BMC, P = 0.016; and BMD, P = 0.039), lumbar spine (BMC, P = 0.001; BMD, P = 0.002; and BMAD, P = 0.018), and femur neck (BMC, P = 0.037; BMD, P = 0.004;
and BMAD, P = 0.001) in female adolescents.
Associations between LM, FM, and bone parameters Next, we included zFM and zLM instead of BMI in the multi- variate-adjusted model (Table 4). zLM was positively associated with zBMC and zBMD of the TBLH for both sexes (P < 0.001 for all); this remained significant after additionally adjusting for
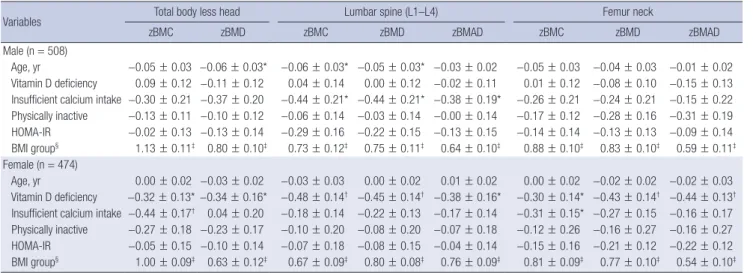
Table 3. Multivariate-adjusted model to analyze the effect of the BMI group on bone parameters
Variables Total body less head Lumbar spine (L1–L4) Femur neck
zBMC zBMD zBMC zBMD zBMAD zBMC zBMD zBMAD
Male (n = 508)
Age, yr −0.05 ± 0.03 −0.06 ± 0.03* −0.06 ± 0.03* −0.05 ± 0.03* −0.03 ± 0.02 −0.05 ± 0.03 −0.04 ± 0.03 −0.01 ± 0.02 Vitamin D deficiency 0.09 ± 0.12 −0.11 ± 0.12 0.04 ± 0.14 0.00 ± 0.12 −0.02 ± 0.11 0.01 ± 0.12 −0.08 ± 0.10 −0.15 ± 0.13 Insufficient calcium intake −0.30 ± 0.21 −0.37 ± 0.20 −0.44 ± 0.21* −0.44 ± 0.21* −0.38 ± 0.19* −0.26 ± 0.21 −0.24 ± 0.21 −0.15 ± 0.22 Physically inactive −0.13 ± 0.11 −0.10 ± 0.12 −0.06 ± 0.14 −0.03 ± 0.14 −0.00 ± 0.14 −0.17 ± 0.12 −0.28 ± 0.16 −0.31 ± 0.19 HOMA-IR −0.02 ± 0.13 −0.13 ± 0.14 −0.29 ± 0.16 −0.22 ± 0.15 −0.13 ± 0.15 −0.14 ± 0.14 −0.13 ± 0.13 −0.09 ± 0.14 BMI group§ 1.13 ± 0.11‡ 0.80 ± 0.10‡ 0.73 ± 0.12‡ 0.75 ± 0.11‡ 0.64 ± 0.10‡ 0.88 ± 0.10‡ 0.83 ± 0.10‡ 0.59 ± 0.11‡ Female (n = 474)
Age, yr 0.00 ± 0.02 −0.03 ± 0.02 −0.03 ± 0.03 0.00 ± 0.02 0.01 ± 0.02 0.00 ± 0.02 −0.02 ± 0.02 −0.02 ± 0.03 Vitamin D deficiency −0.32 ± 0.13* −0.34 ± 0.16* −0.48 ± 0.14† −0.45 ± 0.14† −0.38 ± 0.16* −0.30 ± 0.14* −0.43 ± 0.14† −0.44 ± 0.13† Insufficient calcium intake −0.44 ± 0.17† 0.04 ± 0.20 −0.18 ± 0.14 −0.22 ± 0.13 −0.17 ± 0.14 −0.31 ± 0.15* −0.27 ± 0.15 −0.16 ± 0.17 Physically inactive −0.27 ± 0.18 −0.23 ± 0.17 −0.10 ± 0.20 −0.08 ± 0.20 −0.07 ± 0.18 −0.12 ± 0.26 −0.16 ± 0.27 −0.16 ± 0.27 HOMA-IR −0.05 ± 0.15 −0.10 ± 0.14 −0.07 ± 0.18 −0.08 ± 0.15 −0.04 ± 0.14 −0.15 ± 0.16 −0.21 ± 0.12 −0.22 ± 0.12 BMI group§ 1.00 ± 0.09‡ 0.63 ± 0.12‡ 0.67 ± 0.09‡ 0.80 ± 0.08‡ 0.76 ± 0.09‡ 0.81 ± 0.09‡ 0.77 ± 0.10‡ 0.54 ± 0.10‡ Data are presented as regression coefficient (β) ± standard error.
BMC = bone mineral content, BMD = bone mineral density, BMAD = bone mineral apparent density, HOMA-IR = homeostasis model assessment of insulin resistance, BMI = body mass index, z = Z-scores.
*P < 0.05. †P < 0.01. ‡P < 0.001. §BMI group was defined as underweight, normal-weight and overweight/obesity. Underweight group was used as a reference group.
Table 4. Multivariate-adjusted model to analyze the effect of FM and LM on bone parameters
Variables Total body less head Lumbar spine (L1–L4) Femur neck
zBMC zBMD zBMC zBMD zBMAD zBMC zBMD zBMAD
Male (n = 508)
Age, yr 0.00 ± 0.02 −0.01 ± 0.02 −0.01 ± 0.02 −0.02 ± 0.02 −0.01 ± 0.02 −0.01 ± 0.02 0.00 ± 0.02 0.02 ± 0.02 Vitamin D deficiency 0.01 ± 0.07 −0.19 ± 0.10 −0.03 ± 0.10 −0.06 ± 0.11 −0.08 ± 0.11 −0.07 ± 0.09 −0.15 ± 0.11 −0.20 ± 0.14 Insufficient Ca intake −0.14 ± 0.13 −0.25 ± 0.17 −0.31 ± 0.16 −0.33 ± 0.18 −0.31 ± 0.18 −0.13 ± 0.16 −0.13 ± 0.19 −0.09 ± 0.22 Physically inactive −0.09 ± 0.09 −0.07 ± 0.12 −0.04 ± 0.13 0.00 ± 0.14 0.03 ± 0.14 −0.14 ± 0.11 −0.25 ± 0.16 −0.29 ± 0.20 HOMA-IR −0.25 ± 0.10 −0.13 ± 0.13 −0.40 ± 0.13† −0.26 ± 0.15 −0.11 ± 0.16 −0.22 ± 0.10* −0.14 ± 0.12 −0.05 ± 0.14 FM Z-score, g 0.05 ± 0.04 −0.12 ± 0.05* −0.13 ± 0.05 −0.06 ± 0.06 0.00 ± 0.06 −0.08 ± 0.05 −0.03 ± 0.05 0.01 ± 0.06 LM Z-score, g 0.84 ± 0.03‡ 0.64 ± 0.04‡ 0.71 ± 0.05‡ 0.58 ± 0.06‡ 0.38 ± 0.06‡ 0.71 ± 0.05‡ 0.57 ± 0.05‡ 0.32 ± 0.06‡ Female (n = 474)
Age, yr −0.01 ± 0.02 −0.02 ± 0.02 −0.03 ± 0.02 −0.00 ± 0.02 −0.00 ± 0.02 0.00 ± 0.02 −0.02 ± 0.02 −0.02 ± 0.02 Vitamin D deficiency −0.20 ± 0.11 −0.18 ± 0.15 −0.36 ± 0.12† −0.35 ± 0.12† −0.31 ± 0.15* −0.15 ± 0.12 −0.31 ± 0.13* −0.38 ± 0.13† Insufficient Ca intake −0.27 ± 0.14 0.11 ± 0.18 −0.07 ± 0.12 −0.12 ± 0.12 −0.09 ± 0.12 −0.19 ± 0.10 −0.16 ± 0.11 −0.09 ± 0.16 Physically inactive 0.04 ± 0.15 −0.09 ± 0.18 0.11 ± 0.22 0.05 ± 0.21 −0.01 ± 0.18 0.11 ± 0.22 0.01 ± 0.27 −0.09 ± 0.28 HOMA-IR −0.33 ± 0.13* −0.15 ± 0.14 −0.22 ± 0.15 −0.16 ± 0.14 −0.05 ± 0.14 −0.30 ± 0.13* −0.33 ± 0.10† −0.26 ± 0.12*
FM Z-score, g 0.25 ± 0.05 −0.10 ± 0.06 0.04 ± 0.04 0.15 ± 0.05† 0.20 ± 0.05‡ 0.05 ± 0.04 0.10 ± 0.05* 0.13 ± 0.06*
LM Z-score, g 0.61 ± 0.04‡ 0.59 ± 0.05‡ 0.55 ± 0.04‡ 0.37 ± 0.05‡ 0.18 ± 0.05‡ 0.62 ± 0.05‡ 0.45 ± 0.05‡ 0.19 ± 0.06‡ Data are presented as regression coefficient (β) ± standard error.
FM = fat mass, LM = lean mass, BMC = bone mineral content, BMD = bone mineral density, BMAD = bone mineral apparent density, Ca = calcium, HOMA-IR = homeostasis model assessment of insulin resistance, z = Z-scores.
*P < 0.05. †P < 0.01. ‡P < 0.001.
height Z-scores. zLM also showed a positive association with zBMC, zBMD, and zBMAD of the lumbar spine and femur neck for both sexes (P < 0.001 for all).
We detected several differences in the associations between zFM and bone density between male and female participants.
Although zFM showed a negative association with zBMD of the TBLH for both sexes, this was only statistically significant in male subjects (P = 0.018); the association remained significant after additionally adjusting for height Z-scores (P = 0.018). In con- trast, zFM was positively associated with the lumbar spine zBMD (P = 0.004) and zBMAD (P < 0.001) as well as the femur neck zBMD (P = 0.044) and zBMAD (P = 0.031) in female participants only.
Meanwhile, HOMA-IR showed a negative association with the zBMC of the lumbar spine (P = 0.003) and femur neck (P = 0.038) in male participants and was negatively related to the zBMC of the TBLH (P = 0.011) as well as the zBMC (P = 0.020), zBMD (P = 0.002), and zBMAD (P = 0.030) of the femur neck in female participants after adjusting for age, vitamin D deficien- cy, calcium intake, physical activity, zFM, and zLM.
DISCUSSION
Adolescents with overweight/obesity had significantly higher bone mass and density of the TBLH, lumbar spine, and femur neck than underweight or normal-weight adolescents after ad- justing for age, vitamin D deficiency, calcium intake, physical activity, and HOMA-IR. In both sexes, LM was beneficial for bone mass and density of the TBLH, lumbar spine, and femur neck. FM showed a negative association with TBLH bone den- sity in male adolescents, and positive associations with lumbar spine and femur neck bone density in female adolescents.
Studies on the effects of overweight/obesity on bone mass and density in children have been controversial. Whereas some reported increased bone mass and density in overweight or obese children (3,19,20), others reported decreased (4,21) or similar (5,22) bone mass and density when compared to nor- mal-weight children. These conflicting results can be attributed to the various methods used to assess bone health, the different covariates included in the studies, and the different cutoff sys- tems used to define the weight groups and/or various categori- zation. Adolescents with overweight/obesity often have several risk factors adversely affecting bone health, including vitamin D deficiency, insufficient calcium intake, and a sedentary life- style (8). Moreover, the effect of insulin resistance must be in- cluded as a covariate in studies assessing the effect of overwei- ght/obesity on bone health (9). Since adolescents with overwei- ght/obesity are usually taller, height Z-score adjustments for the TBLH and calculation of the BMAD for the lumbar spine and femur neck are recommended to adjust for body size (10). We constructed a multivariate regression model adjusted for age,
vitamin D deficiency, calcium intake, physical activity, and HO- MA-IR and/or body size as covariates; the results of this model confirmed a beneficial effect of overweight or obesity on bone mass and density in both sexes.
Although some earlier studies in children reported higher to- tal body and lumbar spine bone densities in children with over- weight/obesity (3,19), the Z-scores of bone mass and density based on pediatric normative reference values could not be used as they were not available at the time. This study is strengthened by the objective assessment of body composition and bone pa- rameters using nationwide pediatric normative reference val- ues (12) as well as adjustments for potential confounders affect- ing bone health. TBLH, lumbar spine, and femur neck zBMC and zBMD showed consistent increases with increasing BMI in both sexes; this remained significant after adjusting for body size. This positive association between overweight/obesity and lumbar spine and femur neck bone mass and density might be attributable to weight-bearing and the effect of mechanical load- ing (6,23). In addition, hormonal influences such as increased circulating leptin, which was known to stimulate osteoblast dif- ferentiation via direct peripheral effects on stromal precursor cells in vitro and enhance mineralization of bone matrix (24), may play a beneficial role on bone mass and density (25).
Next, we investigated the independent effects of LM and FM on bone mass and density in male and female adolescents. When LM and FM were included in a multivariate-adjusted model in- stead of BMI, LM was a positive predictor for bone mass and density of the TBLH, lumbar spine, and femur neck. Increasing loads imposed by bigger muscles that exert higher tensile forces on their attaching bones might explain the beneficial role of LM on bone mass and density (26-28). Meanwhile, significantly low- er bone mass and density in underweight adolescents when compared to normal-weight individuals in this study were as- sociated with lower LM rather than insufficient calcium intake or vitamin D deficiency. This result supports the importance of adequate LM for bone health in childhood (29).
The literature on the effect of FM on bone health is contro- versial; this can be attributed to differences in the study partici- pants’ age and sexes, the measured skeletal sites, and the co- variates used in the models (7). In the present study, we found sex- and skeletal site-specific differences in the effect of FM on bone health, after adjusting for all possible confounders, includ- ing LM. FM was negatively associated with TBLH BMD in both sexes, although this was only statistically significant in male ad- olescents. In contrast, FM showed a positive association with lumbar spine and femur neck BMD and BMAD in female ado- lescents only. The positive association between FM and lumbar spine BMD is consistent with a previous study in female ado- lescents aged 14–16 years (30). FM is not only part of weight- bearing component of the body but also affects bone as a meta- bolically active organ (31). A positive association between FM
and bone parameters was shown for weight-bearing sites (lum- bar spine and femur neck), whereas a negative association was shown for non-weight-bearing sites (TBLH) (32). Possible me- diators for the negative effect of FM on bone density include in- flammatory cytokines, which are released from fat cells, in par- ticular from the visceral fat component, promoting bone resorp- tion by stimulating the differentiation of osteoclasts (33). Alth- ough it is unclear why the association between FM and the bone density of weight-bearing bone sites differs by sex, FM might have a differential effect on the bone density of the lumbar spine and femur neck according to sex due to sex-specific differences in FM percentage and distribution, and hormonal changes dur- ing the pubertal period. Women are known to have higher adi- posity and more subcutaneous adipose tissue than men (34).
Moreover, estrogen inhibits bone resorption during rapid puber- tal growth and promotes bone formation after menarche (35).
Meanwhile, insulin resistance, expressed as HOMA-IR, was negatively associated with bone mass and density after adjust- ing for age, vitamin D deficiency, calcium intake, physical activ- ity, zFM, and zLM in both sexes in our study. Possible mecha- nisms explaining the adverse effect of insulin resistance on bone density include increased proinflammatory cytokines levels (36), decreased uncarboxylated osteocalcin levels (37), and impaired insulin signaling in osteoblasts (38).
This study has several limitations. The cross-sectional design cannot provide evidence for causal relationships between LM and FM and peak bone accrual in adolescence. Further longi- tudinal research is required to gain more knowledge on the con- sequences of childhood overweight or obesity on the quality and strength of the bones. The effect of pubertal stage on bone health could not be evaluated since the KNHANES database did not include these data. Although quantitative computed to- mography (QCT) is a three-dimensional technique to quantify true volumetric BMD, we could not measure volumetric BMD using QCT because the KNHANES database only includes DXA data. However, QCT is also limited by the absence of standard- ized scan techniques and a paucity of reference data (39). In- stead, we used the Z-scores of BMC and BMD of the TBLH, lum- bar spine and femur neck using DXA and their estimates of vol- umetric BMD, as recommended by the International Society for Clinical Densitometry (10). The clinical significance of al- tered bone mineral accrual lies in the association with fractures.
Although we could not analyze the forearm, which is known as the most common fracture site in childhood, lumbar spine and femur neck BMADs were related to wrist and forearm fractures in a pediatric population-based fracture study (11); moreover, low TBLH BMD predicted subsequent fracture risk in a large prospective cohort study in children (40).
In conclusion, overweight/obesity had a positive effect on bone mass and density. LM was associated with higher bone mass and density in both, male and female adolescents. Sex-
and site-specific differences for the effects of FM on bone den- sity were found. These findings suggest that interventions to in- crease LM are helpful to augment bone health in adolescents with overweight/obesity. Future longitudinal studies, taking into account LM, pubertal state, and hormonal changes accord- ing to sex, are needed to evaluate the effects of FM on bone health in adolescents.
ACKNOWLEDGMENT
The authors thank the Korea Centers for Disease Control and Prevention, who performed the Korea National Health and Nu- trition Examination Survey (KNHANES).
DISCLOSURE
The authors have no potential conflicts of interest to disclose.
AUTHOR CONTRIBUTION
Conceptualization: Kim HY, Jung HW, Kim JH, Shin CH, Yang SW, Lee YA. Data curation: Kim HY, Hong H, Shin CH, Lee YA.
Investigation: Kim HY, Jung HW, Hong H, Kim JH, Shin CH, Yang SW, Lee YA. Writing - original draft: Kim HY. Writing - review &
editing: Kim HY, Jung HW, Hong H, Kim JH, Shin CH, Yang SW, Lee YA.
ORCID
Hwa Young Kim https://orcid.org/0000-0003-3238-5315 Hae Woon Jung https://orcid.org/0000-0003-0494-4626 Hyunsook Hong https://orcid.org/0000-0003-0955-4176 Jae Hyun Kim https://orcid.org/0000-0002-0203-7443 Choong Ho Shin https://orcid.org/0000-0002-9813-1134 Sei Won Yang https://orcid.org/0000-0002-5304-5750 Young Ah Lee https://orcid.org/0000-0001-9179-1247
REFERENCES
1. Korea Centers for Disease Control and Prevention. Korean youth’s risk behavior web-based survey 2016 [Internet]. Available at http://yhs.cdc.
go.kr [accessed on 11 January 2017].
2. Maggioli C, Stagi S. Bone modeling, remodeling, and skeletal health in children and adolescents: mineral accrual, assessment and treatment.
Ann Pediatr Endocrinol Metab 2017; 22: 1-5.
3. El Hage R, Jacob C, Moussa E, Benhamou CL, Jaffré C. Total body, lumbar spine and hip bone mineral density in overweight adolescent girls: de- creased or increased? J Bone Miner Metab 2009; 27: 629-33.
4. Ivuskans A, Lätt E, Mäestu J, Saar M, Purge P, Maasalu K, Jürimäe T, Jürimäe J. Bone mineral density in 11–13-year-old boys: relative importance of the weight status and body composition factors. Rheumatol Int 2013; 33:
1681-7.
5. Hasanoğlu A, Bideci A, Cinaz P, Tümer L, Unal S. Bone mineral density in childhood obesity. J Pediatr Endocrinol Metab 2000; 13: 307-11.
6. El Hage R, Moussa E, El Hage Z, Theunynck D, Jacob C. Influence of age and morphological characteristics on whole body, lumbar spine, femoral neck and 1/3 radius bone mineral apparent density in a group of Lebanese adolescent boys. J Bone Miner Metab 2011; 29: 477-83.
7. Sioen I, Lust E, De Henauw S, Moreno LA, Jiménez-Pavón D. Associations between body composition and bone health in children and adolescents:
a systematic review. Calcif Tissue Int 2016; 99: 557-77.
8. Lee YA, Kim HY, Hong H, Kim JY, Kwon HJ, Shin CH, Yang SW. Risk fac- tors for low vitamin D status in Korean adolescents: the Korea National Health and Nutrition Examination Survey (KNHANES) 2008–2009. Pub- lic Health Nutr 2014; 17: 764-71.
9. do Prado WL, de Piano A, Lazaretti-Castro M, de Mello MT, Stella SG, Tu- fik S, do Nascimento CM, Oyama LM, Lofrano MC, Tock L, et al. Relation- ship between bone mineral density, leptin and insulin concentration in Brazilian obese adolescents. J Bone Miner Metab 2009; 27: 613-9.
10. Crabtree NJ, Arabi A, Bachrach LK, Fewtrell M, El-Hajj Fuleihan G, Kec- skemethy HH, Jaworski M, Gordon CM; International Society for Clinical Densitometry. Dual-energy X-ray absorptiometry interpretation and re- porting in children and adolescents: the revised 2013 ISCD Pediatric Of- ficial Positions. J Clin Densitom 2014; 17: 225-42.
11. Jones G, Ma D, Cameron F. Bone density interpretation and relevance in Caucasian children aged 9–17 years of age: insights from a population- based fracture study. J Clin Densitom 2006; 9: 202-9.
12. Kang MJ, Hong HS, Chung SJ, Lee YA, Shin CH, Yang SW. Body composi- tion and bone density reference data for Korean children, adolescents, and young adults according to age and sex: results of the 2009–2010 Ko- rean National Health and Nutrition Examination Survey (KNHANES). J Bone Miner Metab 2016; 34: 429-39.
13. Moon JS, Lee SY, Nam CM, Choi JM, Choe BK, Seo JW, Oh K, Jang MJ, Hwang SS, Yoo MH, et al. 2007 Korean National Growth Charts: review of developmental process and an outlook. Korean J Pediatr 2008; 51: 1-25.
14. Mei Z, Grummer-Strawn LM, Pietrobelli A, Goulding A, Goran MI, Dietz WH. Validity of body mass index compared with other body-composi- tion screening indexes for the assessment of body fatness in children and adolescents. Am J Clin Nutr 2002; 75: 978-85.
15. Holick MF, Binkley NC, Bischoff-Ferrari HA, Gordon CM, Hanley DA, He- aney RP, Murad MH, Weaver CM; Endocrine Society. Evaluation, treat- ment, and prevention of vitamin D deficiency: an Endocrine Society clin- ical practice guideline. J Clin Endocrinol Metab 2011; 96: 1911-30.
16. Ryoo E. Adolescent nutrition: what do pediatricians do? Korean J Pediatr 2011; 54: 287-91.
17. U.S. Department of Health and Human Services. Physical activity guide- lines for Americans [Internet]. Available at http://www.health.gov/pagu- idelines/guidelines [accessed on 1 June 2016].
18. Katzman DK, Bachrach LK, Carter DR, Marcus R. Clinical and anthropo- metric correlates of bone mineral acquisition in healthy adolescent girls.
J Clin Endocrinol Metab 1991; 73: 1332-9.
19. Leonard MB, Shults J, Wilson BA, Tershakovec AM, Zemel BS. Obesity during childhood and adolescence augments bone mass and bone di- mensions. Am J Clin Nutr 2004; 80: 514-23.
20. Ellis KJ, Shypailo RJ, Wong WW, Abrams SA. Bone mineral mass in over- weight and obese children: diminished or enhanced? Acta Diabetol 2003;
40 Suppl 1: S274-7.
21. Goulding A, Taylor RW, Jones IE, McAuley KA, Manning PJ, Williams SM.
Overweight and obese children have low bone mass and area for their weight. Int J Obes Relat Metab Disord 2000; 24: 627-32.
22. Manzoni P, Brambilla P, Pietrobelli A, Beccaria L, Bianchessi A, Mora S, Chiumello G. Influence of body composition on bone mineral content in children and adolescents. Am J Clin Nutr 1996; 64: 603-7.
23. Frost HM. The mechanostat: a proposed pathogenic mechanism of os- teoporoses and the bone mass effects of mechanical and nonmechanical agents. Bone Miner 1987; 2: 73-85.
24. Thomas T, Gori F, Khosla S, Jensen MD, Burguera B, Riggs BL. Leptin acts on human marrow stromal cells to enhance differentiation to osteoblasts and to inhibit differentiation to adipocytes. Endocrinology 1999; 140: 1630-8.
25. Rhie YJ, Lee KH, Chung SC, Kim HS, Kim DH. Effects of body composition, leptin, and adiponectin on bone mineral density in prepubertal girls. J Korean Med Sci 2010; 25: 1187-90.
26. Pietrobelli A, Faith MS, Wang J, Brambilla P, Chiumello G, Heymsfield SB.
Association of lean tissue and fat mass with bone mineral content in chil- dren and adolescents. Obes Res 2002; 10: 56-60.
27. Gracia-Marco L, Ortega FB, Jiménez-Pavón D, Rodríguez G, Castillo MJ, Vicente-Rodríguez G, Moreno LA. Adiposity and bone health in Spanish adolescents. The HELENA study. Osteoporos Int 2012; 23: 937-47.
28. Rauch F, Bailey DA, Baxter-Jones A, Mirwald R, Faulkner R. The ‘muscle- bone unit’ during the pubertal growth spurt. Bone 2004; 34: 771-5.
29. Vaitkeviciute D, Lätt E, Mäestu J, Jürimäe T, Saar M, Purge P, Maasalu K, Jürimäe J. Physical activity and bone mineral accrual in boys with differ- ent body mass parameters during puberty: a longitudinal study. PLoS One 2014; 9: e107759.
30. El Hage RP, Courteix D, Benhamou CL, Jacob C, Jaffré C. Relative impor- tance of lean and fat mass on bone mineral density in a group of adoles- cent girls and boys. Eur J Appl Physiol 2009; 105: 759-64.
31. Shin D, Kim S, Kim KH, Park SM. Importance of fat mass and lean mass on bone health in men: the Fourth Korean National Health and Nutrition Examination Survey (KNHANES IV). Osteoporos Int 2014; 25: 467-74.
32. Farr JN, Amin S, LeBrasseur NK, Atkinson EJ, Achenbach SJ, McCready LK, Joseph Melton L 3rd, Khosla S. Body composition during childhood and adolescence: relations to bone strength and microstructure. J Clin Endocrinol Metab 2014; 99: 4641-8.
33. Mosca LN, da Silva VN, Goldberg TB. Does excess weight interfere with bone mass accumulation during adolescence? Nutrients 2013; 5: 2047- 61.
34. Geer EB, Shen W. Gender differences in insulin resistance, body compo- sition, and energy balance. Gend Med 2009; 6 Suppl 1: 60-75.
35. Wang Q, Alén M, Nicholson PH, Halleen JM, Alatalo SL, Ohlsson C, Suom- inen H, Cheng S. Differential effects of sex hormones on peri- and endo- cortical bone surfaces in pubertal girls. J Clin Endocrinol Metab 2006; 91:
277-82.
36. Roodman GD. Role of cytokines in the regulation of bone resorption. Cal- cif Tissue Int 1993; 53 Suppl 1: S94-8.
37. Fulzele K, Riddle RC, DiGirolamo DJ, Cao X, Wan C, Chen D, Faugere MC, Aja S, Hussain MA, Brüning JC, et al. Insulin receptor signaling in osteo- blasts regulates postnatal bone acquisition and body composition. Cell 2010; 142: 309-19.
38. Pramojanee SN, Phimphilai M, Kumphune S, Chattipakorn N, Chattipak- orn SC. Decreased jaw bone density and osteoblastic insulin signaling in a model of obesity. J Dent Res 2013; 92: 560-5.
39. Adams JE, Engelke K, Zemel BS, Ward KA; International Society of Clini- cal Densitometry. Quantitative computer tomography in children and adolescents: the 2013 ISCD Pediatric Official Positions. J Clin Densitom 2014; 17: 258-74.
40. Clark EM, Ness AR, Bishop NJ, Tobias JH. Association between bone mass and fractures in children: a prospective cohort study. J Bone Miner Res 2006; 21: 1489-95.