INTRODUCTION
Recently, various attempts have been made to elucidate the effects of exercise by providing vibratory stimulation to the entire body or part of the body. These vibratory stimuli artificially creates gravitational conditions for aviators in gravity-free space; thus, its original purpose was to prevent functional and morphological degradations of the skeletal system. Studies have shown that vibratory stimulations might have a positive effect on the respiratory, circulatory, nervous, and endo- crine systems as well as on the muscle and skeletal systems (Cardinale
& Bosco, 2003; Oh, Kang, Min, & Kwon, 2015; Woo & Park, 2015); since then, such stimulations have been expanded to include fields, such as physical therapy and rehabilitation (Remaud, Cornu, & Guével, 2009).
There are two general methods of vibratory stimulation; whole body vibratory stimulation and local muscle vibratory stimulation. Studies on
the whole body vibratory stimulation have been actively conducted;
conversely, those on the effects of focal muscle vibratory stimulation on the skeletal muscle tissues are limited.
The effects of vibratory stimuli revealed through experimental results include both positive and negative aspects. Issurin, Liebermann, and Tenenbaum (1994) reported that vibratory stimulation training results in a significant increase in isotonic maximal muscle force and flexibility.
In addition, a study conducted by Barthélémy (2016) reported that the stimulation by an 80-Hz frequency stimulated the muscle sensory afferent nerves of patients with incomplete spinal cord injuries and that vibration stimulation training improved the patients' ability to gait pattern.
Humphries, Warman, Purton, Doyle, and Dugan (2004) confirmed the effect of vibratory stimulation on muscle activation and the ratio of force progression during maximum isometric contraction; however, the results
http://e-kjsb.org eISSN 2093-9752
ORIGINAL
The Effect of Short-term Muscle Vibration on Knee Joint Torque and Muscle Firing Patterns during a Maximal Voluntary Isometric Contraction
Jiseop Lee
1, Junkyung Song
1, Jooeun Ahn
1,2, Jaebum Park
1,21
Department of Physical Education, Seoul National University, Seoul, South Korea
2
Institute of Sport Science, Seoul National University, Seoul, South Korea
Received : 02 May 2017 Revised : 14 June 2017 Accepted : 14 June 2017
Corresponding Author Jaebum Park
Human Biomechanics Laboratory/
Department of Physical Education Seoul National University, 71-418 Seoul National University, 1 Gwanak-ro, Gwanak-gu, Seoul 08826, South Korea Tel : +82-2-880-7620 Fax : +82-2-872-5867 Email : [email protected]
Objective: To investigate the effect of short-term vibration frequencies on muscle force generation capabilities.
Method: Six healthy participants were recruited for this study and only their dominant leg was tested.
The subjects were tested under five conditions of vibration frequencies with constant amplitude: 0 Hz (no vibration), 30 Hz, 60 Hz, and 90 Hz, and the vibration amplitude was 10 mm for all frequency conditions.
The vibration was applied to the rectus femoris (RF). The subjects were then instructed to maintain a steady- state isometric knee joint torque (100 Nm) for the first 6 s. After the steady-state torque production, the subjects were required to produce isometric knee joint torque by leg extension as hard as possible with a start signal within the next 3 s. The vibration was applied for ~4 s starting from 1 s before initiation of the change in the steady-state knee joint torque.
Results: The results showed that the maximum voluntary torque (MVT) of the knee joint increased with the
vibration frequencies. On average, the MVTs were 756.47 Nm for 0 Hz (no vibration) and 809.61 Nm for 90 Hz.
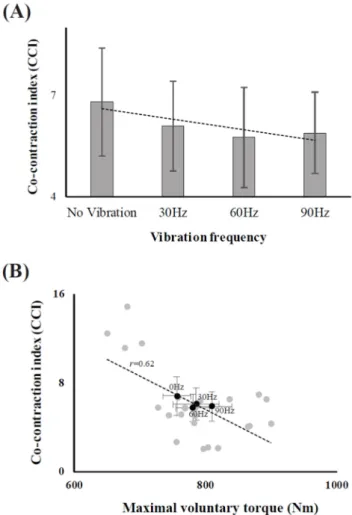
There was a significant positive correlation (r = 0.71) between the MVTs and integrated electromyograms (iEMGs). Further, the co-contraction indices (CCIs) were computed, which represent the ratio of the iEMGs of the antagonist muscle to the iEMGs of all involved muscles. There was a significant negative correlation (r = 0.62) between the CCIs and MVTs, which was accompanied by a significant positive correlation (r = 0.69) between the iEMGs of the vibrated muscle (RF). There was no significant correlation between the MVTs and iEMGs of the antagonist muscle.
Conclusion: The results of this study suggest that the short-term vibration on the muscle increases the
level of muscle activation possibly owing to the increased Ia afferent activities, which enhances the muscle force generation capability.
Keywords: Short-term muscle vibration, Maximum isometric voluntary torque, Ia-afferent, Co-contraction
showed that the vibratory stimulation at 50-Hz level did not significantly increase the isometric contraction force. Ekblom and Thorstensson (2011) reported that the force and muscle activity and H-reflex response did not show any significant difference after long-term vibration stimulation for more than 30 min. In addition, Rothmuller and Cafarelli (1995) re- ported that the effect of vibratory stimulation on the co-contraction of the antagonist muscles during fatigue progression was rather lower than that of its force.
The opposite effect of such a vibratory stimulus can be interpreted to be a result of the response characteristic of a muscle spindle, which senses a vibratory stimulus. The human body recognizes the vibration through the muscles and the tendon and shows adaptive responses to buffer the vibration. This leads to reflexive muscle contractions called tonic vibration reflexes, which improve the muscle nervous system func- tion (Cardinale & Bosco, 2003). The frequency, amplitude, and magni- tude of the vibratory stimulus are important factors in determining the effect of the vibration stimulus (Torvinen et al., 2002). The primary afferent nerves of the muscle spindles are sensitive to minute changes in muscle length; the sensitivity of the spikes increases, especially when a high- frequency vibration stimulus is applied. The primary afferent nerve of the spikes can be fired; it can respond to all vibrations at high frequ- encies (100 Hz), especially when a low amplitude of ~1 mm is applied to the skin or tendon (Latash, 2008). When the vibration is appro- priately adjusted to the external stimulus to the muscles and provided in a way that the human body can adapt, it can lead to positive effects on the body systems, such as the muscular system, skeletal system, and immune system morphologically and functionally (Issurin et al., 1994; Issurin & Tenenbaum, 1999; Arcangel, Johnston, & Bishop, 1971 Samuelson, Jorfeldt, & Ahlborg, 1989; Warman, Humphries, & Purton, 2002). Therefore, it is important to understand the physiological char- acteristics of muscles and to investigate the vibration conditions (fre- quency and amplitude) that can yield positive effects.
Long-term vibrations have been reported to affect high-threshold motor units (Ushiyama, Masani, Kouzaki, Kanehisa, & Fukunaga, 2005) and cause illusion effects. Therefore, it is concluded that long-term vibratory stimulations have no positive effect on muscle activity and force value; hence, in this study, we investigated the positive changes in the maximum muscle strength through short-term vibrations, while considering the negative factors of long-term vibration stimulations proposed by previous studies. In addition, although previous studies have shown a consensus that the effect on the muscles varies in accor- dance with the frequency difference, a previous study, which did not show any significant effect of muscle vibrations during isometric con- traction, was performed under a single vibratory condition of 50 Hz.
Therefore, we examined the effect of vibratory stimulation of various frequencies on the muscles under isometric contraction conditions. In this study, we also attempted to verify the following hypotheses. Hypo- thesis 1: There will be a difference in magnitude of maximum knee joint torque according to the change in the short-term muscle vibration frequency. Hypothesis 2: There will be a difference in the co-contraction index (CCI) between the agonist and antagonist muscles depending on the short-term muscle vibration frequency.
METHODS 1. Participants
This study was conducted on six healthy male adults in their 20 s and 30 s (age: 29.83±4.21 y; height: 172.5±4.5 cm; weight: 75.83±12.84 kg;
anterior thigh fat thickness: 3.1±0.9 mm). The subjects who had no history of surgical operation of the knee joint or muscles, no dys- function of the organs related to posture control or skin texture, and no damage or dysfunction (manual muscle testing: MMT, grade 5) in other parts of the body were selected. The body mass index of the participants was in the normal range (18.5~23 kg/m
2). All participants were informed about the overall experimental procedure before the experiment; after completing the experiment participation agreement reviewed by the Institutional Review Board, the experiment was then conducted (IRB No. 1704/001-009).
2. Apparatus
The vibrator used in this study adjusted the frequency, amplitude, and vibration time as a form attached to the skin. Its dimensions were 1.17" in diameter and 0.30" in thickness. The each frequency, amplitude, and vibration time was controlled using a program connected with a vibrator.
A six-component force and torque sensor (AMTI MC3A, USA) was used to measure the maximum voluntary torque (MVT) of the knee joint. The sensor consists of six channels and simultaneously measures the force and moment components of the x-, y-, and z-axis, and the crosstalk was less than 2% for all channels. The force sensor was firmly fixed to the customized steel frame; for experimental purposes, it was designed to be placed between the knee and ankle joints of each subject.
In addition, the attachment position of the force sensor was adjusted according to the shank anatomy of each subject. The iron frame was fixed by setting the knee angle of the participants to 120° (Lindahl, Movin, & Ringqvist, 1969). The attached sensor was fixed to the frame after the long axis of the iron frame and the Fz component of the sensor were positioned perpendicular to each other (Figure 1). The sampling frequency of the force/torque data was set to 1,000 Hz.
A surface EMG (Trigno wireless EMG systems, Delesys, USA) was used to measure the activity of the muscles concerned with the experiment.
The electrodes were attached to all four muscles, including the muscles
used as the agonist muscles at the time of the extension torque of the
knee joint, such as the vastus lateralis (VL), rectus femoris (RF), vastus
medialis (VM), and a muscle used as an antagonist muscle, the biceps
femoris, (BF). Data were collected by setting the sampling frequency of
the EMG to 2,000 Hz. All equipment were synchronized to start at the
same time, and the experiment was conducted. All measured analog
signals were digitalized via an analog-to-digital converter (AMTI, Gen5,
USA) and transferred to a computer. Data were collected using the
LabVIEW (National Instruments, Austin, TX) software.
3. Procedure
Before starting this experiment, all participants performed full body stretching to prevent knee and thigh injuries. As a preliminary exercise step, the blood flow of the thigh muscles (quadriceps femoris and ham- string) was pre-increased using a leg-extension and leg-curl machine.
In addition, exercise specialist evaluated the joint range of motion, stability, and strength of the muscles to be used in the experimental task through MMT (manual muscle test) (Daniels & Worthingham, 1986).
The experiments were then conducted on those with Grade 5 levels, i.e., participants with complete range of motion for gravity and strong resistance. Before the experiment, all participants visited the laboratory to practice the maximum voluntary torque task under the no-vibration condition to become familiar with the experimental conditions. The surface electrode attached to the skin for measuring the muscle activity was located at the midpoint between the muscle insertion and the nerve distribution area along the longitudinal axis of the muscle based on the manual of a previous study (Basmajian & De Luca, 1985). In addition, the hair was removed from the attachment area of the thigh muscles to reduce the impedance generated from the skin before attaching the electrodes, and the oil was removed using cotton soaked in alcohol.
1) Vibration effect on the EMG signal
Preliminary experiments were performed prior to this experiment.
The purpose of the preliminary experiment was to confirm the inter- ference of the EMG signal by the vibration signal and to provide a method for eliminating the interference signal of the vibration included in the EMG signal.
Therefore, the interference was measured and compared at more frequencies than the frequency condition set in this experiment. First, the electrodes were attached to the same area as the measured muscle area in the present experiment, and seven frequency conditions were measured from the no-vibration condition to 30 Hz, 50 Hz, 60 Hz, 90 Hz, 110 Hz, and 140 Hz. Second, the experimental data were compared with those of the no-vibration condition at 30 Hz, 50 Hz, 60 Hz, 90 Hz, 110 Hz, and 140 Hz in a steady-state at 100 Nm of knee extension torque. A notch filter corresponding to each vibration condition was applied to remove the component of the frequency band set by the vibrator included in the EMG signal. The mean power frequency (MPF), median power frequency, power spectrum density (PSD), and integrated EMG (iEMG) values of the raw data and the notch filter applied data were compared and evaluated. As a result of the analysis, we could not observe differences between the raw data and the notch filter applied data. Therefore, we concluded that the artifact of the vibrator can be removed from the raw data through the notch filter.
2) MVT task of the knee joint
The measurement postures of all the participants were stretched to the equipment consisting of a steel frame for the knee extension motion; the waist was pulled all the way to the end; and the waist and shank of the participants were fixed using Velcro (Figure 2). Four vibrators were attached along the periphery of rectus femoris, which was the most superficial located in the anterior part (muscle belly) of the agonist muscles involved in the knee extension (Figure 2A).
To obtain muscle activity data, the surface electrodes were attached to four muscles (agonist: vastus lateralis (VL), rectus femoris (RF), vastus medialis (VM), antagonist: bicep femoris (BF)) as shown in (Figure 2B).
The vibratory conditions consisted of four different frequencies (0 Hz [no vibration], 30 Hz, 60 Hz, and 90 Hz) and the amplitude was pro- vided constantly at 10 mm regardless of the four frequencies, con- sidering the skinfold of anterior thigh to the extent that the effect of the vibration affects the muscle spindles. Four vibratory conditions
Figure 1.Experimental setting for the maximal isometric voluntary
torque task. A six-axis force/torque sensor is fixed to the leg extension machine, providing feedback through the monitor in front. The iron frame is fixed by setting the knee angle of the participant at 120°, and the orientation of the attached sensor is fixed to the frame along the long axis of the iron frame. The Fz component of the sensor is perpendicular.
Figure 2. (A) The vibrator is attached to the rectus femoris (RF). (B)
The surface electrodes are attached to the vastus lateralis (VL), RF, vastus
medialis (VM), and biceps femoris (BF) to obtain EMG data from the
muscles.
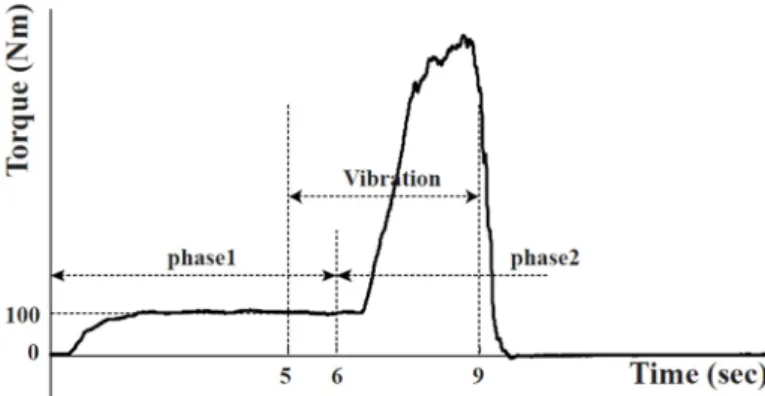
were provided randomly to exclude the learning effect. All trials were measured twice for each vibratory condition, and the average value was used for the analysis. This task was divided into two phases. The first phase is a pre-activation period that maintains the 100-Nm knee extension torque as constant as possible for 6 s. The second phase is the maximum voluntary torque period after the 6-s pre-activation phase and was instructed to generate the maximum voluntary torque within 9 seconds according to the start signal provided by the monitor. Short- term muscle vibrations were then provided from 5 s to 9 s for 4 s, 1 s before the start of the maximum voluntary torque (after 6 s) (Figure 3). During this task, all participants were monitored to obtain data on the force value at the pre-activation phase and the starting point of the maximum voluntary torque task and to rule out the perceived influence of the task performance. The visual information on the peak force was not provided.
The resulting knee extension torque values were provided as graph- ical visual feedback via a computer screen. To eliminate the residual effect of the vibration, a 2-3-min break time between each trial was provided, and additional breaks were also provided depending on the needs of the participants.
4. Data processing
All measured data were analyzed using MATLAB 14.0 (MathWorks Inc. Natick, MA, USA). The force values measured from the six-axis force/torque sensor were filtered using a zero-lag 4th-order low-pass Butterworth filter (cutoff at 10 Hz).
The processing of the EMG data for data analysis was as follows: 1) application of the notch filter to eliminate the 60-Hz noise generated by the external electronic devices, 2) application of a second notch filter to remove noise in the same frequency band as the vibrator stimulus, 3) application of 10-450-Hz bandpass filter, 4) rectification process, and 5) application of a 100-ms window moving average filter. The variable of in this study were as follows.
1) MPF when performing the MVT task
The MPF was analyzed to determine the effect on fatigue because the muscle fatigue that occurs in the MVT task of this study may affect the results. Each participant performed a total of eight MVT tasks (two per frequency), and the MPF of the agonist and antagonist muscles in each attempt was recorded.
∑ ∙
∑
(Equation 1)
i represents the number of the corresponding attempt (eight times);
p represents the power spectral density (PSD); and n represents the number of samples of the PSD.
2) MVT of the knee extension
For the data analysis, the length of the point perpendicular to the center of the force sensor (D
shankof Equation 2) was measured from the lateral epicondyle of the femur of each participant. Using the Fz value obtained from the force sensor, the mechanical knee joint torque (KJT) was calculated using Equation 2. The MVT was defined as the maximum value in the second phase (6~15 s) of the continuous KJT values arranged with a time interval of 15 s.
∙ (Equation 2)
3) iEMG
The iEMG of all muscles was calculated from the point at which the torque value of the knee extension increased (onset) from the pre- activation interval to the point at which the maximum voluntary torque value was observed (peak). The onset at which the knee extension torque value begins to increase was defined as the point at which the maximum change rate of the F
Zvalue measured from the force sensor (dF
Z/dt) is 5% after the pre-activation period (6~15 s) (Kim, Shim, Zatsiorsky, & Latash, 2006). Since the time window lengths of the peak and onset points were different for each experimental participant and experimental conditions, the time between the onset and the peak time extracted for each trial was resampled to 100 data, and the iEMG value was calculated using Equation 3.
iEMG ∙ where j = {VL, RF, VM, BF}
(Equation 3) 4) CCI
To quantify the degree of the antagonist activity on the degree of total muscle activity, the CCI was calculated using the iEMG values of the four muscles calculated above (Equation 4).
Figure 3. Sample of maximal voluntary torque task data. Phase 1 is the
pre-activation period. Phase 2 is the maximum knee extension torque
generation period. Muscle vibration is applied for a total of 4 s from
5 s to 9 s.
2 ∙
100%
(Equation 4) 5. Statistical analysis
The statistical analysis was performed using SPSS 24. 0 (IBM, USA).
The effect of the task trial (level 8) factor on the MPF was confirmed using one-way repeated measures analysis of variance (ANOVA). The effects of the frequency factors (four levels: 0, 30, 60, and 90 Hz) on the MVT and CCI were also verified using the one-way repeated measures ANOVA, and a paired t -test was used to confirm the difference of the one-to-one correspondence of the frequency conditions. A linear regres- sion analysis was performed to analyze the change in the iEMG of the agonist muscles which was including the muscles provided with the vibratory stimulation, and antagonist muscle, according to the MVT changes. The significance level of all statistical analyses was set at α
= 0.05.
RESULTS
1. MPF when performing the MVT task
The MPF of the measured agonist (VM, RF, VL) and antagonist (BF) muscles EMG signals during the MVT task was found to be unchanged during a total of eight MVT tasks. These results were confirmed using the one-way repeated measures ANOVA, where the task trial (level 8) factor was set as a factor and the MPF as a dependent variable. The main effect of the task trial factor was not statistically significant (Fi- gure 4).
2. MVT of the knee joint
In this study, the MVT value according to the frequency change of the muscle vibration was analyzed.
The results showed that the MVT of the knee joint increased with the vibration frequencies as compared to 0 Hz (no-vibration) (Figure 4).
On average, the MVTs were 756.47 Nm for 0 Hz (no vibration), 785.74 Nm for 30 Hz, 780.61 Nm for 60 Hz, and 809.61 Nm for 90 Hz. These results were confirmed using the one-way repeated measures ANOVA.
The main effect of the frequency factor (4th level: 0, 30, 60, and 90 Hz) was statistically significant ( F
[3, 15]= 3.89, p <0.05), and a statistically significant difference (P<0.05) was found between the MVT of 0 Hz and 30 Hz <MVT of 90 Hz using the post hoc paired t -test.
3. CCI
The CCI indicates the degree of activity of the antagonist muscle relative to the measured total muscle activity. The CCI tended to de- crease with increasing frequency as compared to 0 Hz (no-vibration) (Figure 5A). These results were confirmed using the one-way repeated measures ANOVA, and the main effects on the frequency factors (four levels: 0, 30, 60, and 90 Hz) were statistically significant ( F
[3, 15]= 3.48, p <0.05). In addition, the relationship between the MVT and CCI in all
Figure 4. Maximum voluntary torque of the knee joints of the six parti-
cipants according to the vibration frequency. The average and standard errors of the six participants are shown.
Figure 5. (A) Average and standard error of the co-contraction index