─ 336 ─
ⓒ The Korean Society of Limnology. All rights reserved.
This is an open-access article distributed under the terms of the Creative Commons Attribution Non-Commercial License(http://creativecommons.org/licenses/by-nc/3.0/), which permits unrestricted non-commercial use, distribution, and reproduction in any medium, provide the original work is properly cited.
INTRODUCTION
Harmful cyanobacterial blooming is a serious worldwide water pollution problem, especially in a freshwater environ- ment, which is related to water management (Barros et al., 2020), also human health (
Coddet al., 2020). Cyano bacterial blooming (blue-green algae) consists of surface forming genera (e.g Anabaena, Aphanizomenon, Nodularia, Micro-
cystis), subsurface forming genera(e.g Cylindrosper mopsis,
Oscillatoria). M. aeruginosa is a representative cyanobac-terium that can produce harmful cyanotoxin such as micro- cystin, anatoxin, and saxitoxin in freshwater circumstances
(Metcalf et al., 2020). The growth of M. aeruginosa in a natural environment is generally regulated by light intensity, pH, temperature, phosphorus, nitrogen, and other nutrients
(Hozumi et al., 2020; Nagao et al., 2020). Although several specific conditions of temperature and chemical factors have been optimized in laboratory-scale experiments for the effec- tive growth of M. aeruginosa, still unsolved questions for determining the optimal growth conditions are remained for several decades.
Natural sunlight including the ultraviolet light, infrared light, and visible light differs from laboratory artificial light which has been tested for the growth of microalgae in several studies. These studies reported that light intensity affects algal cell density, chemical components of cells, production of lipid contents and toxins (Tong et al., 2011; Cheirsilp and Torpee, 2012; Wahidin et al., 2013). Blue, red and white light can
The Influence of Light Reduction on the Growth of Microcystis aeruginosa and Variation of Environmental and Chemical
Parameters in Large-scale Cultivation System
Taehui Yang
(0000-0002-7374-3281), Ja-young Cho
(0000-0003-4301-6961), Ha-jin Kang
(0000-0001-9178-5015), Chang Soo Lee*
(0000-0001-7327-4852)and Eui-jin Kim*
(0000-0002-6528-9699)Nakdonggang National Institute of Biological Resource, Sangju-si 37242, Republic of Korea
Abstract Large-scale cultivation of Microcystis aeruginosa in different light conditions was conducted for
verifying the cell growth in a greenhouse system. Environmental and chemical parameters of the large-scale culture medium were measured for analyzing the interaction between M. aeruginosa and its symbiotic bacteria.
During cultivation, a difference in cell growth pattern was observed between control (natural light) and light- limited groups (reduction of blue, green, and blue/green light, respectively). Comparing the control group, the light reduced groups showed slow and delayed cell growth through the cultivation period. Also, there is differences in the consuming pattern of total nitrogen and total phosphorus which indicated that the possibility of interaction between M. aeruginosa and symbiotic bacteria.
Key words:
light reduction, large-scale cultivation, Microcystis aeruginosa
Manuscript received 13 November 2020, revised 10 December 2020, revision accepted 10 December 2020
* Corresponding author: Tel: +82-53-540-0840, E-mail: [email protected]
Tel: +82-53-540-0860, E-mail: [email protected] https://doi.org/10.11614/KSL.2020.53.4.336 ISSN: 2288-1115(Print), 2288-1123(Online)
Original article
to red color) is preferred for the efficiency of photosynthesis
(Kommareddy and Anderson, 2003). The wavelength of 750 nm and above has an energy content difficult to mediate che- mical changes, therefore radiant energy absorbed in this range only appears as thermal effects. Conversely, radiation of 380 nm and below brings only ionizing effects. Photosynthetic pigments; chlorophyll, carotenoid, phycobilins, and phyco- cyanin, have specific light absorption spectra that originated their constructive chemical compounds for photosynthesis (Kommareddy and Anderson, 2003). It is can say that con- structive chemical compounds of photosynthesis organisms decide the preferred wavelength for the more efficient light absor bent. Most microalgae have both chlorophyll and caro- tenoid absorbing each suitable light wavelength for their photo synthesis and chlorophyll to carotenoid ratio influenced under abiotic (eg. temperature, light, pH and salinity, etc.) and biotic (eg. pathogen contamination and competition with other microorganisms) stress (Carvalho et al., 2011). Con- sidering with above, it is expected that the growth pattern of
M. aeruginosa will be shown distinguishably by a differentwavelength such as blue or green of natural visible light.
Interactions between cyanobacteria and its symbiotic bac- te ria are related to their metabolic systems. Through N
2fix- ations and organic compound decomposition, bacteria can supply inorganic C, N, P, and other nutrients to cyanobacteria (Ramanan et al., 2016). Also, cyanobacteria contribute as a source of organic compounds such as proteins and large mole- cular weight carbohydrates as well as molecular oxygen for bacterial metabolites. However, specific details of the inter- action at molecular levels are unclear phenomena although previous studies showed the symbiotic interactions between bacteria and algae (Thompson et al., 2013; Cooper et al., 2015; Perera et al., 2019). In this study, we investigated the effect of limited natural light (by blue, green, and blue/green
20ºC under 50 μmol m
-2s
-1light intensity using fluorescent light and 14/10 light-dark cycle.
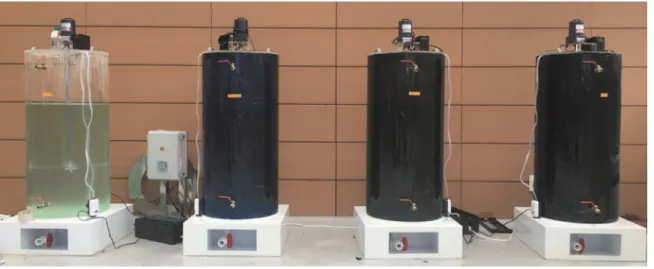
2. Large-scale cultivation of M. aeruginosa sp. in filmed acryl tank in a greenhouse
M. aeruginosa was cultivated under 50
cm (diameter circle shape) ×1500 cm tall uncolored acryl tank in an indoor green- house (Fig. 1). The initial seed culture of M. aeruginosa was grown in a 2-L mini-column until cell density was reached to 2.0 ×10
7cells mL
-1, and then transferred into the four differ- ent filmed tanks containing 100-L of 1/2 BG-11 medium.
Using the blue, green, and mixed (blue with green) films, the acryl tank covered tightly and measured natural light inten- sities inside of each of the tanks 3 times for static analysis.
Representative days for one sunny and one cloudy day were selected separately for natural light measurement during the cultivation period (Table 1). The algal culture was agitated with a paddle wheel system during day sampling to prevent settling and an air burble maker was set to enhance the sup- plement of CO
2. Microscopic analysis was carried out daily to check the purity of cell culture. From the 28th of July 2020 (set ‘0’ day), 3 times in a week, environmental parameters were analyzed and recorded for 16 days until 12th August 2020.
3. Flow cytometric analysis for live-cell density
Culture medium obtained from four testing tanks, was ana-
lyzed using Guava
®easyCyte
TMflow cytometer (Luminex
Cor poration). 200 μL of culture medium was stained using
Fluorescein diacetate (FDA, Sigma-Aldrich, final con. 2 μM)
for 10 min in dark. A Guava
®easyCyte
TMflow cytometer was
used with an excitation light of the blue (488-nm) laser and
the gain controls set to 1.30 (forward scatter), 1.00 (side scat-
ter), 1.54 (green fluorescence), 1.61 (yellow fluorescence), and 1.30 (red-B fluorescence). Samples of 200 μL were ana- lyzed in 96-well flat-bottom plates (Corning Life Sciences) with automatic mixing of each well for 5 sec at high speed before sampling. For analyzing the state of cells, a cluster of
M. aeruginosa was selected on plotting coordination(forward scatter and side scatter) concerned cyanobacterial cell size (Fig. 3(a)). Indeed, concerning the emission of chloroplast (red range), a cluster of M. aeruginosa was selected again in forward scatter and red fluorescence coordination (Fig. 3(b)).
Selected cyanobacteria clusters are counted concerning the fluorescent intensity on plotting coordination (green fluores- cent and forward scatter) and live-cell numbers are calculated automatically (Fig. 3(c)). During every sampling, flow cyto- metric analysis for M. aeruginosa cells was demonstrated with all samples and replicated at least 3 times (n =3) for static analysis.
4. Measuring environmental parameter
Environmental parameters in the experimental system
were measured during the cultivation periods. Temperature, dissolved oxygen (%), conductivity, pH, and turbidity, and salinity were recorded (see Fig. 2) at all sampling days using ProDSS Multiparameter Water Quality Meter (YSI Inc.).
5. Chemical composition analysis
For verifying the utilization of nitrogen and phosphate by microorganisms, each 2-L of culture medium which filtered with a membrane filter (pore size 3.0 μm) was used chemical composition analysis for total nitrogen (TN), total phosphorus
(TP), BOD, and COD (Fig. 2). These measurements were per formed by WONIL CHEMICAL & ENVIRONMENT CO., LTD (Korea).
RESULTS AND DISCUSSION
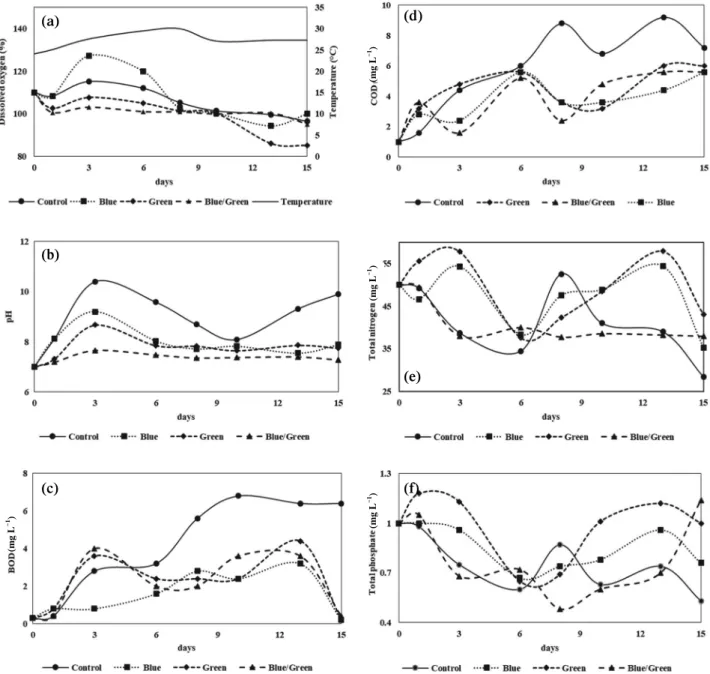
1. Environmental and chemical parameters Environmental and chemical parameters such as tempera- ture, pH, DO, BOD, COD, TN, and TP were changed during
Fig. 1. Large-scale cultivation system in this study(Control, blue, green and blue/green groups in order, from the left).Table 1. Measured light intensity of control and light reduces groups during the cultivation periods. (unit: µmol m-2 s-1)
Day 0~14 Day 15
Control group 33.65(7.2), 40.82(10.9), 16.51(3.9)* 64.78(1.6), 100.92(24.8), 23.15(4.1)
Blue group 5.7(1.5), 5.57(1.9), 2.36(0.4) 22.2(2.9), 18.22(2.7), 3.99(1.0)
Green group 3.53(1.0), 7.69(2.0), 2.09(0.3) 13.72(4.5), 16.4(1.1), 5.7(0.3) Blue/green group 1.2(0.3), 1.66(0.1), 0.66(0.2) 1.56(0.3), 3.16(0.6), 0.48(0.1)
*Measured at 9 am, 12 pm, 5 pm(Mean±SD, n=3).
the large-scale cultivation for M. aeruginosa with (control group) and without natural light reduction (blue group, green group, and blue/green group) (Fig. 2). The day-time tempera- ture of cell culture increased from 24ºC to 30ºC during the six-teen cultivation days. Since for burble maker, DO value was not significantly changed during the cultivation days through the four groups.
The pH value increased after 2 days through the cultivation days in all groups (Fig. 2(b). CO
2can present in liquid culture
as chemical formations of CO
2, carboxyl acid, and methanoate anion. Cyanobacteria consumed CO
2for the dark reaction of photosynthesis generally leads to the alkalizing of the cul- ture medium (Axelsson, 1988). During the cultivation periods, alkalizing of the the pH value represent the cell growth of cyanobacteria is under the exponential phase. Compared with the other groups, pH value of the control group was getting higher dramatically in 3 cultivation days, and it can indicate that the growth rate and volume of the control group were (b)
(c)
(e)
(f)
Fig. 2. Measured environmental and chemical parameters during the cultivation periods. (a) Temperature and DO, (b) pH, (c) BOD, (d) COD, (e) TN and (f) TP(not supported Mean±SD).
(mg L-1)(mg L-1)
(mg L-1)
higher than other groups.
The increase of BOD and COD values of control group in 8 cultivation day was two-timed higher than other groups, it is possibly caused by inorganic and organic compounds produced by the bacterial and algal cellular metabolism (Kshirsagar, 2013). Consuming rate of total nitrogen and total phosphorus by the bacteria showed higher in control and blue/
green groups than blue and green groups. Although the varia- tion of the pH value was not observed in the blue/green group, the consumption rate of the TN and TP was higher in the con- trol group. It indicated that the utilization of TN and TP by the
bacteria (none cyanobacteria) present in the blue/green group and it may cause by low cell concentration of the M. aerugi-
nosa. The value of TN and TP in the control group decreasedin 2 to 5 days once, then recovered above TN and TP value of 0 day and decreasing again. Otherwise blue and green groups, the value of TN and TP increased first and dec reased again occurring two-times. However, the blue/green group keeps decreasing through the cultivation periods, except TP value in 15 cultivation day. These results implied that natu ral light reduction can induce different growth rates of M.
aeruginosa and consuming patterns in chemical compounds.
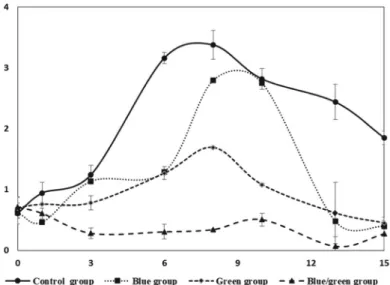
Fig. 4. Cell growth of M. aeruginosa in large scale cultivation for control and light reduced groups. Live cell density measured using Guava software 1.1. All sample tested three-times for statist analysis(Mean±SD).
Fig. 3. Quantification for M. aeruginosa using Guava flow cytometry(X and Y axis are arbitrary units). (a) Forward scatter and side scatter, (b) Forward scatter and Red-B fluorescence, (c) Forward scatter and Green fluorescence.
(a) (b) (c)
Fig. 5. Schematic diagram of growth tendency of M. aeruginosa during the large scale cultivation. X-axis representative intensity of green fluorescence using Gua total particle numbers are counted and showed in Y-axis during the six-teen cultivation periods. (a) Control group and blue group, (b) Control blue/green group.
(a) (b) (c)
2. Live cell analysis by flow cytometry
The Guava flow cytometer is a powerful statistic method with high precision and fast, automated processing for analyz- ing the cyanobacteria cells. Several studies implied that Guava flow cytometry is a useful method for analyzing the status of microalgae cells (Debenest et al., 2010; Krediet, 2015). This method detects and counts cyanobacterial particles passing through a microcapillary tube based on their fluorescence and light scattering (www.millipore.com/easycyte). Also, this method can detect multiple ranges of light wavelength together and is capable of detecting dead and live cyanobacterial cells given their intrinsic chlorophyll fluorescence. Indeed, analyses of both size detecting and fluorescence intensity of stained cyanobacteria revealed a cluster of particles with high green fluorescence and a defined light-scattering values.
Fig. 4 showed the fluctuation of live cell concentration of control and other groups. The maximum live cell concentra- tion of the control group is twice higher than the green group, it may affected by a difference of 5 times higher light intensities through the day times (Table 1). However, the blue group which has light intensity eight-times lower than the control group, showed almost the same live-cell concentration com- pare with the control group on day 10. Control and green light reduced group reached in exponential phase in day 3, while the blue group reached in 5 cultivation day. Although there is not a significant difference in light intensity between blue and green groups, the starting day of the exponential phase was delayed 2 days in the blue group. This result suggested that different types of light can effects the growth rate of cyano- bacteria even though their light intensities are similar.
Fig. 5 showed the variation of the cell status during the cultivation periods by comparing the control and other three groups (Red background: control group; blue background:
other groups). The status of live cells showed a low level of green fluorescence until the start of the exponential day (day 6) through the four groups. While the control group showed strong fluorescence intensity of about 10
2, other groups showed weak fluorescence intensity. Even though the blue group reached a similar volume of the live cell compares with the control group, fluorescence intensity was 10
1on day 8. Al- together, the control group showed intact and strong cell status than light reduced groups through the cultivation periods.
Considering with chemical parameters and variation of cell growth of M. aeruginosa, it seems that most of TN and TP con sumption in the blue/green group were facilitated by the
cyanobacteria-associated bacterial community, not M. aerugi-
nosa.CONCLUSION
We investigated the effect on cell growth of M. aeruginosa in large-scale cultivation using natural light reduction with environmental, chemical parameters. Results showed that natural light reduction reduced the cell growth of M. aerugi-
nosa and seem to there is differences in the cyanobacteria-associated bacterial community. However, the specific bacte- rial composition which has symbiotic relations with cyano- bacteria and their functional module needs to investigate for further understating of cyanobacteria blooming in the eco- system. Although the similar light intensity, blue and green groups showed different growth patterns that indicated that there is prefer light wavelength for the cell growth. Altogether, the light reduction can regulate the M. aeruginosa cell growth which capable of applied to the harmful cyanobacteria blooming. For further study, molecular genetic approaches for analyzing the related gene of cell growth and photosynthe- sis, and visualization of cell status during the different types of light irradiation.
Author information Taehui Yang (NNIBR Researcher), Ja-young Cho (NNIBR Associate Researcher), Ha-jin Kang
(NNIBR Researcher), Chang Soo Lee (NNIBR Senior Resear- cher), Eui-jin Kim (NNIBR Team manager)
Author contribution statement Conceptulation:
Chang Soo Lee and Eui-jin Kim Field survey: Taehui Yang, Ja-young Cho, Ha-jin Kang, Data analysis: Taehui Yang, Manuscript writing: Taehui Yang
Conflicts of interest There is no interest of conflict prob-
lems between authors.
Funding This study was supported by a grant from the Nak- donggang National Institute of Biological Resource (NNIBR) funded by the Ministry of Environment (MOE) of the Repu- blic of Korea (No. NNIBR202002102) and the National Res- earch Foundation of Korea (NRF) grants funded by the Korea government (MSIT) (No. 2019R1A2C2089870).
REFERENCES
Axelsson, L. 1988. Changes in pH as a measure of photosynthesis
batch cultivation. Bioresource Technology 110: 510-516.
Codd G.A., E. Testai, E. Funari and Z. Svirčev. 2020. Cyanobacte- ria, Cyanotoxins, and Human Health. John Whiley 17. doi.
org/10.1002/9781118928677.ch2.
Cooper, M.B. and A.G. Smith. 2015. Exploring mutualistic inter- actions between microalgae and bacteria in the omics age.
Current Opinion in Plant Biology 26: 147-153.
Debenest, T., F. Gagné, A.-N. Petit, M. Kohli, P. Eullafroy and C. Blaise. 2010. Monitoring of a flame retardant(tetrabro- mobisphenol A) toxicity on different microalgae assessed by flow cytometry. Journal of Environmental Monitoring 12(10): 1918.
Hozumi, A., I. Ostrovsky, A. Sukenik and H. Gildor. 2020. Tur- bulence regulation of Microcystis surface scum formation and dispersion during a cyanobacteria bloom event. Inland Waters 10(1): 51-70.
Jung, J.H., P. Sirisuk, C.H. Ra, J.M. Kim, G.T. Jeong and S.K.
Kim. 2019. Effects of green LED light and three stresses on biomass and lipid accumulation with two-phase culture of microalgae. Process Biochemistry 77: 93-99.
Kommareddy, A. and G. Anderson. 2003 Study of light as a para- meter in the growth of algae in a Photo-Bio-Reactor(PBR).
ASAE Annual International Meeting Presentation 034057, Las Vegas, USA.
Krediet, C.J., J.C. DeNofrio, C. Caruso, M.S. Burriesci, K. Cella and J.R. Pringle. 2015. Rapid, precise, and accurate counts of symbiodinium cells using the guava flow cytometer, and a comparison to other methods. PLOS ONE 10(8): e0135 725.
Kshirsagar, A.D. 2013. Bioremediation of wastewater by using
kateswarlu, R. Naidu and M. Megharaj. 2019. Advances in the technologies for studying consortia of bacteria and cyanobacteria/microalgae in wastewaters. Critical Reviews in Biotechnology 39(5): 709-731.
Ramanan, R., B.-H. Kim, D.-H. Cho, H.-M. Oh and H.-S. Kim.
2016. Algae-bacteria interactions: Evolution, ecology and emerging applications. Biotechnology Advances 34(1): 14- 29.
Scott, M., C. McCollum, S. Vasil’ev, C. Crozier, G.S. Espie, M.
Krol and D. Bruce. 2006. Mechanism of the down regula- tion of photosynthesis by blue light in the cyanobacterium Synechocystis sp. PCC 6803. Biochemistry 45(29): 8952- 8958.
Thompson, A.W. and J.P. Zehr. 2013. Cellular interactions: lessons from the nitrogen-fixing cyanobacteria. Journal of Phycology 49(6): 1024-1035.
Tong, M., D.M. Kulis, E. Fux, J.L. Smith, P. Hess, Q. Zhou and D.M. Anderson. 2011. The effects of growth phase and light intensity on toxin production by Dinophysis acuminata from the northeastern United States. Harmful Algae 10(3):
254-264.
Wahidin, S., A. Idris and S.R.M. Shaleh. 2013. The influence of light intensity and photoperiod on the growth and lipid con- tent of microalgae Nannochloropsis sp. Bioresource Tech- nology 129: 7-11.
Wei, L., W. You, Y. Gong, M. El Hajjami, W. Liang, J. Xu and A.
Poetsch. 2020. Transcriptomic and proteomic choreography in response to light quality variation reveals key adaption mecha nisms in marine Nannochloropsis oceanica. Science of The Total Environment 720: 137667.