• 검색 결과가 없습니다.

Fast Ray Reordering and Approximate Sibson Interpolation for Foveated Rendering on GPU

N/A
N/A
Protected

Academic year: 2021

Share "Fast Ray Reordering and Approximate Sibson Interpolation for Foveated Rendering on GPU"

Copied!
11
0
0

로드 중.... (전체 텍스트 보기)

전체 글

(1)

1. INTRODUCTION

The development of Head-Mounted Display (HMD) devices with wide field of view (FOV) and high resolution has increased opportunities for Virtual Reality (VR) experience. Applications for VR require high frame rates and low latency to avoid dizziness due to VR experience [1]. In order to solve this problem, a rasterization-based ren- dering technology has been developed, but in re- cent years, combined with gaze-tracking technol- ogy, a foveated rendering technology similar to a human visual system has developed. The foveated rendering techniques that operate at these adaptive resolutions have been recently undergoing much

research because they can reduce computational cost and power consumption. It also significantly reduces the computational cost for rendering in physically-based simulation that requires a high performance, such as Yoon et al. [2].

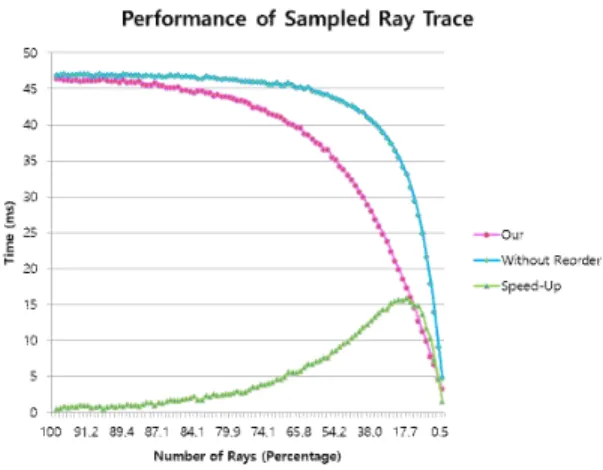
Until now, the rendering technique for HMD has mainly applied rasterization-based method due to its performance. On the other hand, ray tracing has the advantage of generating very realistic high quality images [3]. Although ray tracing method is not utilized because it is high computational cost compared to rasterization. However, Koskela et al.

[4] showed that about 94% of samples could be omitted. Also, perception-driven rendering meth- ods [5] that take advantage of the inherent proper-

Fast Ray Reordering and Approximate Sibson Interpolation for Foveated Rendering on GPU

Oh-Seok Kwon

, Keon-kuk park

††

, Joseph Yoon

†††

, Young-Bong Kim

††††

ABSTRACT

Virtual reality applications in Head-Mounted Displays require high frame rates and low latency rendering techniques. Ray tracing offers many benefits, such as high-quality image generation, but has not been utilized due to lower performance than rasterization. But that can obtain good result combined with gaze-tracking technology and human visual system’s operation principle. In this paper, we propose a method to optimize the foveated sampling map and to maintain the visual quality through the fast voronoi nearest interpolation. The proposed method further reduces the computational cost that has been improved by the previous foveated sampling. It also smoothes the voronoi boundary using adaptive sibson interpolation, which was not possible in real-time. As a result, the proposed method can render real-time high-quality images with low visual difference.

Key words: Virtual Reality, Head-Mounted Display, Foveated Rendering, Ray Tracing, Gaze-Tracking, Ray Reordering, Fast Voronoi Nearest Interpolation.

※ Corresponding Author : Young Bong Kim, Address:

(608-737) 45, yongso-ro, NamGu, Busan, Korea, TEL : +82-51-629-6248, FAX : +82-51-629-6230, E-mail : yb- [email protected]

Receipt date : Jan. 24, 2019, Revision date : Feb. 11, 2019 Approval date : Feb. 12, 2019

Dept. of IT Convergence and Application Engineering, Graduate School, Pukyong National University (E-mail : [email protected])

††††

Dept. of IT Convergence and Application Engineering, Graduate School, Pukyong National University (E-mail : [email protected])

††††

Dept. of IT Convergence and Application Engineer- ing, Graduate School, Pukyong National University (E-mail : [email protected])

††††

Dept. of IT Convergence and Application Engineer- ing, Graduate School, Pukyong National University

※ This work was supported by a Research Grant of

Pukyong National University(2017 year)

(2)

ties of the human visual system can reduce com- putational costs by reducing the complexity of pro- jected image pixels while maintaining a high-qual- ity visual experience. Based on this, adaptive sam- pling combined with gaze-tracking, in other words foveated rendering can be used to effectively utilize expensive rendering techniques such as ray tracing.

The foveated rendering is closely related to the human visual system. The viewing angle of a healthy adult human extends 150º horizontally and 135º vertically per eye, and in the 18º region of the eye there is a fovea with dense of photoreceptors [6]. Cone cells are located with high density in the fovea region, and decrease rapidly as they move away from center. On the other hand, the peripheral region shows low resolution due to the distribution of low cone cells, but the rod cells recognizing brightness are dense [7]. In particular, the rod cells in the peripheral area are stimulated by light of various intensities and responsible for perceiving the size, shape and brightness of the visual image.

Especially, it reacts sensitively to small flickering due to its ability to perceive brightness. Therefore, based on these anatomical facts, if the flickering problem is solved, it can be recognized naturally even if the peripheral region is roughly expressed [8]. An additional caution is that if the peripheral area is excessively smooth, the tunnel vision effect will occur [9]. Thus, most previous approach has presented to solve this problem. But unfortunately, we improved performance using adaptive sam- pling, we didn't consider the execution structure of the GPU. Therefore, we despite the performance improvements due to adaptive sampling, there is still the potential for further optimization on the GPU. Generally, the GPU handles threads in a unit called warp (group of threads), which can further reduce computation costs when considering warp [10].

Therefore, we propose fast ray reordering and approximate Sibson interpolation to improve per- formance for foveated rendering on GPU. This

makes the computational advantages of performing rendering at an adaptive resolution by the gaze more effective. Adaptive sampling reorders dis- tributed ray tracing threads to optimize in warp units. In addition, based on the fact that the shape of the cell is polygonal in nature, we fill in the emp- ty part of the sparse image with the voronoi struc- ture and propose a method of real-time nearest in- terpolating the boundary to reduce artifacts in the peripheral area. In addition, based on the fact that the shape of the cell is polygonal in nature, we fill the empty part of the sparse image with the vor- onoi structure and propose a very fast nearest in- terpolation method to reduce artifacts in the pe- ripheral. Our method also reduces the tunnel vision effect due to blur of the peripheral area through random foveated sampling and reprojection. The proposed method makes it possible to use the high cost rendering method in real-time.

This paper is organized as follows. Section 2 discusses related work, and Section 3 describes in detail the proposed method. The experimental re- sults and conclusions are described in Section 4 and 5, respectively.

2. RELATED WORK

In this section, we provide an overview of the previous studies related to our system.

Fujita et al. [11] uses a pre-computed sampling pattern to reduce computational cost of ray tracing method and reconstructs images from sparse sam- ples through kNN filtering with neighboring cells.

The pre-computed sampling pattern used here seems to preserve performance for kNN filtering in the voronoi structure. Thus, even if additional pixels are sampled by generating noise from the sampling pattern, k-NN interpolation must be re- construct with voronoi again to perform, which is expensive [12].

And Weier et al. [1] solves the artifacts of sil-

houette due to the improvement of reconstruction

(3)

quality and sparse sampling through resampling.

In this system, geometric silhouette artifacts caused by sparse sampling are solved by adaptive sam- pling. However, in the case of a large number of silhouettes, the problem arises that the computa- tional cost is increased. In addition, they didn't maximize saving of computational costs due to sparse sampling because they didn't consider opti- mization of the warp, which consists of threads with different computational costs.

Patney et al. [8] solved this problem by ap- proaching what is to maintain visual quality in hu- man peripheral vision. Based on the perceptual ba- sis, he confirmed that the effect of simple Gaussian filtering induces the tunnel vision effect. To solve this problem, he solved this problem by applying adaptive perceptual filtering which pre-filters shad- ing properties and then under samples other samples. However, filtering shadow attributes that are difficult to predict, such as indirect illumination, is expensive. Also, paradoxically, if there are a lot

of objects that need to maintain visual quality in the surrounding area, you do not have to sample them.

3. Overview

We propose a rendering pipeline as shown Fig.

1. The input data of the pipeline uses the position of gaze and the width of the pupil, and consists of six parts:

Geometry, Sampling, Optimization, Shading, Re- construction, Post-Processing.

Our goal is to mimic the biological mechanisms of the human visual system to shade only visually significant pixels and reduce visual errors and ren- dering time. To achieve our goal, we need to opti- mize non-uniformly distributed shading threads by adaptive sampling and real-time interpolation in voronoi structure. The core of our approach is to reorder the sampled region through the probability function for efficient processing on GPU and to in-

Fig. 1. Overview. We describe our rendering pipeline. The geometry step generates a G-Buffer (Position, Normal,

and Depth) in full resolution. In the sampling step, the sampling map is generated from a sampling probability

derived from gaze with is then used for sparse ray tracing and history resampling. In the ray optimization

step, the sampling map is compressed to improve the performance of the GPU. The shading step generates

a sparse image by performing threads classified as ray tracing and history resampling. The reconstruction

step is efficiently fills the empty parts of the image by nearest interpolation in structured by voronoi. In the

final step, the post-process step is used to smooth the artifacts that occur in stochastic sampling and voronoi

boundaries.

(4)

terpolate it to remove artifacts caused by the vor- onoi boundary. A detailed description of each step is given in the next chapter.

3.1 Sampling Step

In the sampling step, a sampling map and a re- projection coordinate map generates for use in the shading stage. First, a sampling map is created based on the position of eye tracking. The proba- bility function of foveated sampling for ray gen- eration is shown in Equation (1). This formula is based on the fact that the resolution by which hu- mans perceive objects is determined by the density of cone cells [13]. In order to perform the sampling, it is based on position of the gaze, the width of the pupil, and the user-defined coefficient value.

The probability for sampling is given by (1) where d

i

is the normalized distance of each pixel from the position of the gaze, and the user adjusts the probability through the weight function w(θ, σ

p

).

(2) In the weight function w(θ, σ

p

), θ and σ

p

are the width of the pupil and the user probability ad- justment coefficient, respectively. Where σ

p

is a value between 0 and 1.

As shown in Fig. 2, the results of the probability by σ

p

and θ maintains the same shape as the den- sity distribution of cone cell in the human visual system. In addition, our reconstruction procedure is structured by the voronoi diagram there is a possibility that artifacts will occur at the bounda- ries of objects. Therefore, edge detection by the depth buffer contributes to ray tracing at the boun- daries of objects. This sampling buffer (Ts) is a uint3 texture consisting of the coordinates of the pixel and whether or not to perform ray tracing.

More specifically, Ts.x, Ts.y is the coordinate to which the pixel will be written, and Ts.z is whether

or not ray tracing will be performed.

In addition, our reconstruction procedure is structured by the voronoi diagram there is a possi- bility that artifacts will occur at the boundaries of objects. Therefore, edge detection by the depth buffer contributes to ray tracing at the boundaries of objects. This sampling buffer (Ts) is a uint3 texture consisting of the coordinates of the pixel and whether or not to perform ray tracing. More specifically, Ts.x, Ts.y is the coordinate to which the pixel will be written, and Ts.z is whether or not ray tracing will be performed (Ts.z = 0 is re- sampling, Ts.z = 1 ray tracing).

And we reuse information from previous frames because we do foveated sampling to reduce com- putational costs. Hence, we use the reverse re- projection method to achieve this purpose [14]. We compute the pixel coordinates to be projected onto the current frame using the MVP (model, view, and projection) matrix of the previous frame (t-1) based on the world space position (t). Here, a cache miss is performed through comparison with the depth buffer of the previous frame t-1. In addition, con- sider that there may be no information in the his- tory cache due to foveated sampling. Synthetically, the reprojection coordinates buffer (Tr) is stored as float3. Where Tr.x, Tr.y are reprojection coor- dinates and Tr.z is the cache miss or cache hit.

Fig. 2. An example of applying the probability coeffi-

cient σ

p

= 0.8 passing the pupil width θ= 0.2 to

the sampling probability P(d

i

) based on the hu-

man visual system.

(5)

(Tr.z = 0 is cache miss, Tr = 1 is cache hit).

3.2 GPU Optimization

The main advantage of our approach compared to using an unordered sampling map is that it re- ordered the sampling map to work effectively in warp units. The foveated sampling map is de- scribed as a sparse matrix. We define two types of threads: ray tracing and resampling. Here, the resampling threads simply take the reprojection value from the history buffer, so it have a sig- nificantly less working time than ray tracing.

(Assuming that the working time of ray tracing is all the same) Therefore, the ideal situation is to group threads that take the same working time.

Our strategy is as follows:

Strategy 1. For the first pixel (u: 0, v: v) of each row in the sparse matrix S do

∙ If S.z = 1, Push to the left side in reordered buffer R.

→ Increase the R(u: 0, v: v).z by 1.

∙ If S.z = 0, Push to the right side in reordered buffer R.

Strategy 2. For the first pixel (u: 0, v: v + block.height) of each row at the block.height in- terval in the sparse matrix do

∙ Find min and max in R.z of the first pixel in every row of block.

∙ Swap the last pixel of R.z = 1 of the min and

max.

∙ Increase or Decrease the R.z of min, max by 1.

∙ Repeat until the difference between min and max R.z is 1.

In the sampling map, ray tracing is defined as a red rectangle (Ts.z = 1) and history resampling is defined as a white rectangle (Ts.z = 0). As shown in Fig. 3, the sparse matrix of Fig. 3 (a) is reordered as a Compressed Sparse Row (CSR) by using strategy 1. as shown in Fig. 3 (b). Each row is executed independently, it is compressed through parallel threads as many as the height of the image on GPU. Strategy 2 improves the per- formance of optimization by further compressing considering the CUDA block height. (Usually com- pressed in cuda block units). The performance evaluation by the proposed method is discussed in chapter 4.

3.3 Sparse Shading

Our shading step works with two stages: ray tracing and history resampling. However, the co- ordinates of the shading buffer are considered scattered through the optimization step. So instead of using FragCoord, we use Ts.x and Ts.y in the reordered sampling map. And is performed in two stages by Ts.z. The two stages can be summarized as shown in Fig. 4.

All procedures are based on a reordered sam-

(a) (b) (c)

Fig. 3. (b) and (c) are the results of compressing (a) composed of resampling. Performs n times in the first pixel

of each row to reorder the ray tracing threads (red) in sequence. It then performs the compression once

again in units of warp (32 threads).

(6)

pling map. The two stages in Fig. 4 are described in the following way:

∙ Caching from the reordered sampling buffer (u: u, v: v) and store in R (uint3).

∙ Caching from the reprojection coordinate buf- fer (u: R.x, v: R.y) and store in W (float3).

∙ Caching from the history buffer (u: W.x, v:

W.y) and store in k1 (float4).

∙ If R.z = 1, Generate ray(R.x, R.y).

→ k2 (float4) = Trace ray.

→ Save (k1 + k2) in Shading Buffer (u: R.x, v: R.y).

∙ If R.z = 0, Save k1 in shading buffer (u: R.x, v: R.y).

Through the above process, it is possible to re- duce the noise caused by stochastic sampling by repeatedly ray tracing in the temporally same pixel.

Also, if the user moves only the gaze statically, the resulting image will gradually improve with random sampling and therefore converge to full ray tracing.

3.4 Reconstruction

In the previous steps, the result of ray tracing

and history caching is still sparse. Of course, if the history buffer is to accumulated temporally it gen- erates dense images, but we have to fill in the emp- ty part of image to render each sparse frame. First we have assumed a sparsely filled pixel as a photo- receptor cell. In nature, cells represent the shape of polygons, which can be summarized by the vor- onoi structure [15]. So we fill the empty area with the voronoi structure using the shaded pixels as sites. There are many ways to generate voronoi diagrams, but our shaded pixels converge tempo- rally to the full resolution, so we need algorithms that are independent of the number of sites. There- fore, we generate a dense voronoi structured image using the Jump Flooding Algorithm (JFA) in re- al-time [16]. Regardless of the number of sites, it always generates the voronoi diagram at the same frame rate and is very effective in nearest inter- polation than constructing a kd-tree because it is possible to find the closest site to all raster pixels in O(1).

Dense images with voronoi diagrams using JFA have artifacts due to voronoi boundaries. Also, since the pixels filled in the reconstruction process are from the closest site, it was not accurate ray tracing values. Therefore, we perform nearest in- terpolation to smooth these artifacts. The ideal in- terpolation method for voronoi structures is to per- form the Natural Nearest Interpolation, such as Sibson's method. Even the Sibson's interpolation - a very efficient version of a Sibson's inter- polation - takes about 1000ms [11]. Instead, our proposed nearest interpolation method works in re- al-time and is shown in Fig. 5 below.

This approach is described as follows.

∙ Input the JFA’s ping-pong buffer (T1: color buffer, T2: coordinate buffer).

∙ For every T1 output raster position p do

→ Find the closest site S

n

to the same raster position p in T2.

→ Calculate r = d(p, S

n

).

Fig. 4. The ray trace thread (red) of the reordered sam-

pling map (a) performs ray tracing, the history

resampling thread (white) references the repro-

jection coordinate map, and then stores the val-

ue of the history buffer in the shading buffer (b).

(7)

→ Calculate the search window S with bbox (r).

→ For every raster position q in search win- dow do

∙ If d(q, p) < r, add c(q) and increment n(p) by 1.

→ For every output raster position p do

∙ Set f(p) = c(q) / n(p).

Where d is the distance function, c is the accu- mulated color value to be stored float4, n is the count and the f is the finally interpolant value. Our proposed method is faster than the Discrete Sibson Interpolation because the size of the search window is determined. Because our sites increase, the size of the search window is small and finally con- verges to the reference image, improving the com- putational cost and visual quality. However, be- cause it is not a perfect natural neighbor inter-

polation, it does not converge to the Natural Nearest Interpolation in the intermediate process, but the visual quality of result is verified in the experiment of chapter 4.

3.5 Post-processing

First, tone mapping is performed to compensate for the luminance of the shadow buffer. We re- duced the number of artifacts during shading and reconstruction processing. Nevertheless, proba- bilistic sampling and reprojection errors can lead to convergence mismatches. This causes tempo- rary flicker due to noise. To reduce this noise, you can apply a variety of previously presented filtering.

We have already generated the G-Buffer in the Geometry step, so we applied the basic A-Trous Filtering method as a post-processing filter to take advantage of it [17].

4. EXPERIMENTAL RESULT

First, we used several types of objects to com- pare the performance of the proposed pipeline.

There are three types of experiments. It consists of a full ray trace, a version that does not reorder the foveated sampling map, and our method. Our system consists of Intel Core i5-6600 CPU, 8GB Ram and NVIDIA GeForce GTX 970 for hardware performance evaluation. We also performed 300 repetitions for accuracy of evaluation. The results for each scene are shown in Fig. 6, and a compar-

(a) (b)

Fig. 5. The value of each raster position p determines the search window (blue box) to the nearest site, s1, and determines the pixel of p by all pixels q within radius r.

Fig. 6. The result of each scene performed on the benchmark.

(8)

ison of it is shown in Table 1.

The most significant of the experimental results is the reduction of the calculation cost. Our method can improve performance even with the same number of rays as other foveated rendering. It is confirmed that the computational performance is also improved by the same ratio as the sampling number is reduced as compared with the full path tracing.

To compare the visual quality, we calculated the Peak Signal-to-Noise Ratio (PSNR) and the Struc- tural SIMilarity (SSIM) for each situation, and the resolution was 1024×1024. The visual quality re- sults for each condition are shown in Fig. 7. There are some conditions to the accuracy of the evalua- tion. First, the position of the line of sight was fixed at the center. The parameters used in the experi- ments are σ

p

= 0.8 and θ = {0.04, 0.1, 0.2}, respec- tively. The evaluation of visual quality is covered in the follow.

The result of the visual quality assessment maintained a PSNR of about 26 with only about 5% of the rays. In addition, SSIM, which is a meas- ure of structural similarity, was able to confirm its stability by maintaining about 0.8.

Fig. 8 is a graph showing the efficiency of re- ordering the sampled rays by the pupil width. By default, foveated sampling is performed about 1.5 times faster if the number of rays is reduced to

9% of the full resolution. However, performing our reordering method achieves a performance im- provement of about 1.5 times at 22% and about 3 times at 9%. So our method means that more ray tracing is possible in a small time.

At a resolution of 1024×1024, the number of 1%

rays is already about 10,000. In addition, the num- ber of sites is further increased by reprojection. As shown in Fig. 9, in voronoi, our neighborhood in- terpolation is processed much faster than Park's method and performs interpolation with stable per- formance regardless of the number of sites.

As a result, our method can be performed faster than traditional foveated rendering methods. In ad- dition, random sampling is performed every time, and the result of history caching is reflected, so the probability of converging to the ground truth increases. However, this may not be perfectly con- vergent because you have to consider the re- projection error.

5. CONCLUSION

In this paper, we propose a new approach to im- prove the performance of foveated rendering in GPU through gaze - based fovaeted probability sampling and fast ray reordering, and approximate Sibson interpolation. Our method significantly re- duces rendering costs without significant loss in human-perceived visual quality, based on the fact Table 1. Comparing the time of each step of the pipeline performed for each renderer and showing the speed-up

of our approach

rays Sampling Optimize Ray

Trace Reconstruct Post

process Total Speed- up Rungholt

6704K Triangles Fig. 6 (a)

full un optimize

our

4.19M 0.83M 0.83M

0 1.93 2.18

0 0 1.98

125.7 53.63 33.92

0 11.09

11.1

0 3.2 3.22

125.6 70.15 52.42

1 x1.79 x2.39 Vokselia Spawn

1875K Triangles Fig. 6 (b)

full un optimize

our

4.19M 0.14M 4.19M

0 2.06 2.05

0 0 2.01

95.3 7.48 4.18

0 10.75 10.72

0 3.14 3.14

95.3 23.41 22.12

1 x4.07

x4.3 Eye_Exam

32 Triangles Fig. 6 (c)

full un optimize

our

4.19M 0.29M 0.29M

0 2.02 1.78

0 0 1.79

3.2 7.96 23.7

0 10.55 10.53

0 2.99 3.04

23.77 23.33 20.36

1

x1.01

x1.16

(9)

that the resolution of the human retina is divided into central and peripheral area. We performed the rendering considering the pupil position and diameter.

And we performed sparse sampling through a probability function that takes into account the density of human photoreceptor cells. Here we have improved the computational performance by reordering foveated sampling maps to work more efficiently on the GPU. We have developed a meth- od of real-time interpolation of the voronoi struc-

ture generated from a large number of sites on the GPU. This effectively reduces the silhouette fault and noise due to extreme sampling in real time.

Moreover, in our method, considering the change of the position and the number of the rays gen- erated each frame, the visual quality can be gradu- ally improved at low cost in case the focus does not move. In conclusion, we can obtain a realistic image at high speed in an HMD device by generat- ing an adaptive resolution image according to the Fig. 7. Visual quality comparison of reconstructed results from Shading Buffer (a) by Discrete Sibson ’s (b) and our

method (c) for each row.

(10)

width of the pupil adjusted according to the focus of eye and the brightness of the scene.

REFERENCE

[ 1 ] M. Weier, T. Roth, E. Kruijff, A. Hinkenjann, A.P. Pérard-Gayot, P. Slusallek, et al.,

“Foveated Real-Time Ray Tracing for Head- Mounted Displays,” Computer Graphics Forum, Vol. 35, No. 7, pp. 289-298, 2016.

[ 2 ] J. Yoon, K. Park, O. Kwon, and Y. Kim, “A Development of Semi-automatic Trawl-net Surfaces Reconstruction System Using Motion Equations and User Interactions,” J ournal of Korea Multimedia Society, Vol. 20, No. 8, pp.

1447-1455, 2017.

[ 3 ] W. Hunt, Virtual Reality: The Next Great Graphics Revolution, Keynote Talk High- Performance Grapics, Oculus Research, 2015.

[ 4 ] M. Koskela, T. Vitanen, P. Jaaskelainen, and J. Takala, “Foveated Path Tracing,” Proceed- ing of International Symposium on Visual Computing, Springer, Cham, pp. 723-732, 2016.

[ 5 ] M. Weier, M. Stengel, T. Roth, P. Didyk, E.

Eisemann, M. Eisemann, et al., “Perception- driven Accelerated Rendering,” Computer Gra- phics Forum, Vol. 36, Issue 2, pp. 611-643, 2017.

[ 6 ] T.C. Ruch and J.F. Fulton, Medical Physiol- ogy and Biophysics, Academic Medicine, 1960.

[ 7 ] D. Purves, G.J. Augustine, D. Fitzpatrick, W.C. Hall, A. Lamantia, J.O. Mcnamara, et al., Neuroscience, Sinauer Associates, Sunder- land, 2004.

[ 8 ] M.F. Deering, “A Photon Accurate Model of the Human Eye,” Association for Computing Machinery Transactions on Graphics, Vol. 24, No. 3, pp. 649-658, 2005.

[ 9 ] A. Patney, M. Salvi, J. Kim, A. Kaplanyan, C.

Wyman, N. Benty, et al., “Towards Foveated Rendering for Gaze-Tracked Virtual Reality,”

Association for Computing Machinery Tran- sactions on Graphics, Vol. 35, No. 6, pp. 179.1- 179.12, 2016.

[10] M. Bauer, H. Cook, and B. Khailany, “Cuda DMA: Optimizing GPU Memory Bandwidth via Warp Specialization,” Proceedings of 2011 International Conference for High Perform- ance Computing, Networking, Storage and Analysis, Association for Computing Machi- nery, No. 12, pp. 96-106, 2011.

[11] M. Fujita and T. Harada, “Foveated Real- time Ray Tracing for Virtual Reality Headset,”

Tech. rep., Light Transport Entertainment Research. 2014.

[12] S. Park, L. Linsen, O. Kreylos, J. Owens, and B. Hamann, “Discrete Sibson Interpolation,”

IEEE Transactions On Visualization and Com- Fig. 8. Computation time by the change of the number

of sampled rays.

Fig. 9. Performance comparison of interpolation method

in voronoi.

(11)

puter Graphics, Vol. 12, No. 2, pp. 243-253, 2006.

[13] B. Guenter, M. Finch, S. Drucker, D. Tan, and J. Snyder, “Foveated 3D Graphics,” Associa- tion for Computing Machinery Transactions on Graphics, Vol. 31, No. 6, pp. 164.1-164.10, 2012.

[14] D. Nehab, P.V. Sander, J. Lawrence, N. Ta- tarchuk, and J.R. Isidoro, “Accelerating Real- Time Shading with Reverse Reprojection Caching,” Proceedings of the 22nd Associa- tion for Computing Machinery SIGGRAPH/

EUROGRAPHICS Symposium on Graphics Hardware, pp. 25-35, 2007.

[15] M. Bock, A.K. Tyagi, J. Kreft, and W. Alt,

“Generalized Voronoi Tessellation as a Model of Two-dimensional Cell Tissu Dynamics,”

Bulletin of Mathematical Biology, Vol. 72, No.

7, pp. 1696-1731, 2010.

[16] G. Rong and T. Tan, “Jump Flooding in GPU with Applications to Voronoi Diagram and Distance Transform,” Proceedings of the 2006 symposium on Interactive 3D Graphics and Games Association for Computing Machinery, pp. 109-116, 2006.

[17] H. Dammertz, D. Sewtz, J. Hanika, and H.P.A.

Lensch, “Edge-avoiding -trous Wavelet Trans- form for Fast Global Illumination Filtering,”

Proceedings of the Conference on High Per- formance Graphics, Eurographics Association, pp. 67-75, 2010.

Oh-Seok Kwon

Received the B.S. degree in Computer Multimedia Engin- eering and the M.S. degree in IT Convergence and Application Engineering from Pukyong Na- tional University in 2012 and 2014 respectively. He is cur- rently studying a Ph.D. course in IT Convergence and Application Engineering at Pukyong National Univer- sity, Busan, and Republic of Korea. His research inter- ests include computer graphics, image processing, and GPGPU and parallel computing.

Keon-Kuk Park

Received the B.S. degree in IT Convergence and Application Engineering at Pukyong Natio- nal University in 2017. He is currently studying a M.S. course in IT Convergence and Applica- tion Engineering at Pukyong National University, Busan, and Republic of Korea. His research interests include computer graphics, 3d simu- lation, and deep learning.

Joseph Yoon

Received the B.S., M.S. degrees in Computer Science from Pukyong National University in 2003 and 2005 respectively. He is currently studying a Ph.D.

course in IT Convergence and Application Engineering at Pu- kyong National University, Busan, and Republic of Korea. His research interests include computer graph- ics, HCI, and mobile and web programming.

Young-Bong Kim

Received the B.S. degree in com-

puter science from Seoul Natio-

nal University in 1987, and the

M.S., and Ph.D. degrees in com-

puter science from the Korea

Advanced Institute of Science

and Technology in 1989 and

1994 respectively. He worked at Samsung Advanced

Institute of Technology from 1994-1995. He is cur-

rently a professor in the Dept. of IT Convergence and

Application Engineering at Pukyong National University,

Busan, and Republic of Korea. His research interests

include computer graphics, and 3D computer simulation.

수치

Fig. 1. Overview. We describe our rendering pipeline. The geometry step generates a G-Buffer (Position, Normal,  and Depth) in full resolution
Fig. 2. An example of applying the probability coeffi- coeffi-cient σp = 0.8 passing the pupil width θ= 0.2 to  the sampling probability P(d i ) based on the  hu-man visual system.
Fig. 4. The ray trace thread (red) of the reordered sam- sam-pling map (a) performs ray tracing, the history  resampling thread (white) references the  repro-jection coordinate map, and then stores the  val-ue of the history buffer in the shading buffer (b
Fig. 6. The result of each scene performed on the benchmark.
+3

참조

관련 문서

The objective of this research is to propose a method for evaluating service reliability based on service processes using fuzzy failure mode effects analysis (FMEA) and grey

The fast disintegrating tablet (FDT) containing oriental herbal medicine was prepared by using a freeze-drying method.. To improve taste and morphology of

The purpose of this study is to propose a method to apply Arts PROPEL's theory to actual class when teaching a student orchestra in a school.. The Arts

This paper aims to compare and analyze the appreciation area in highschool music textbooks and to study on the teaching method.. The Seventh Curriculum and

The method was analyzed in terms of appearance, music, and method of map, with six types of ultra-high quality textbooks published over the past five

In this paper, we propose a method to guarantee the system life as passive elements by using high efficiency operation and analog devices by tracking

In order to further boost the performance of NMF, we propose a novel algorithm in this paper, called Dual graph-regularized Constrained Nonnegative Matrix Factorization

As a specific educational method, we proposed the cultural elements teaching model and the model through the learning plan based on the prototype Moran-model, and took