217
"J. Korean Soc. Radiol., Vol. 8, No. 5, August 2014"
Evaluation of Metal Artifact Reduction for Orthopedic Implants (O-MAR) on Radiotherapy Treatment Planning
Huisu Won*,**, Joowan Hong*,**, Sunyoung Kim*, Jaehyock Choi*, Jaehwan Cho*, Hanjoon Yang*, Jin Lee*, Sunyeob Lee*,***, Cheolsoo Park*,***
Department of International Radiological Science, Hallym University of Graduate Studies*, Department of Radiation Oncology, Seoul National University Bundang Hospital**,
Department of Radiological Science, Hallym Polytechnic University***
방사선 치료 계획 시 O-MAR (Metal Artifact Reduction for Orthopedic Implants) 적용의 유용성 평가
원희수*,**, 홍주완*,**, 김선영*, 최재혁*, 조재환*, 양한준*, 이진*, 이선엽*,***, 박철수*,***
한림국제대학원대학교 국제방사선학과*, 분당서울대학교병원 방사선종양학과**, 한림성심대학교 방사선학과***
Abstract
The aim of this study is evaluation of dose distribution on radiation therapy planning system with the CT image of high-density material inserted phantom. Gammex 467 Tissue Characterization Phantom is used to acquire an image similar to the human tissues and insert a Titanium to generate metal artifact. The acquired images were reconstructed with Metal Artifact Reduction for Orthopedic Implants (O-MAR). By using the treatment planning system, the volume was analyzed and dose distribution was extracted. Photon dose distribution in linear accelerator was measured by the MapCHECK™ and compared with planned and measured dose distributions. In result of the comparative analysis, when artifact is generated by Titanium, The volume applied O-MAR was increased 6.8% to BR-12 Breast and 40.2% to LV 1 Liver. After O-MAR was used, Dose distribution was higher 1.4 to 1.6% than before. Consequently, The artifact caused by metal objects should be removed if possible, and after that used in the radiotherapy treatment plan can be considered to reduce errors.
Keyword : O-MAR, Artifact, radiotherapy treatment plan, dose distribution
요 약
본 연구에서 Phantom에 고 밀도 물질이 삽입 된 CT 영상을 재구성 하여 방사선 치료 계획 시 선량 분포에 대한 평 가를 하고자 하였다. Gammex 467 Tissue Characterization Phantom을 사용하여 인체 조직과 유사한 영상을 획득하 였고 Titanium을 삽입하여 금속물로 인한 인공허상을 발생시켜 영상을 획득하였다. 획득한 영상은 Metal Artifact Reduction for Orthopedic Implants (O-MAR)를 이용하여 영상을 재구성 하였고 전산화 치료계획 시스템을 이용하여 체적을 분석 하고 선량 분포를 추출하였다. MapCHECK™을 이용하여 선형가속기의 광자선 선량 분포를 측정하여 계획
http://dx.doi.org/10.7742/jksr.2014.8.5.217
Corresponding Author: Cheolsoo Park E-mail: [email protected] Tel: +82-010-3770-3109
Add. Department of International Radiological Science, Hallym University of Graduate Studies, Daechi-dong, Gangnam-gu, Seoul
량 분포 보다 1.4 에서 1.6 % 높게 나타났다. 결론적으로 금속물로 발생된 인공허상 O-MAR를 적용하여 가능한 제거 하고 치료계획에 이용해야 오류를 줄일 수 있을 것으로 사료된다.
중심단어: O-MAR, 인공허상, 방사선 치료 계획, 선량 분포
Ⅰ. INTRODUCTION
효과적인 방사선 치료를 위해 정상 조직의 장해 (normal tissue complication probability; NTCP)는 최소로 하고 종양 조직에 처방된 방사선량을 정확하게 전달 하여야 한다. 이러한 NTCP (normal tissue complication probability)는 감소시키고 TCP (tumor control probability)를 증가시키기 위해 세기변조방사선치료 (Intensity Modulated Radiation Therapy, IMRT), 영상유도 방사선치료 (Image Guided Radiation Therapy, IGRT), 정 위체부방사선치료 (Stereotactic Body Radiation Therapy, SBRT) 등 여러 고 차원의 치료 기법이 적용된다. 이러 한 치료 기법을 사용하기 위한 방사사선 치료계획 수 립 시 전산화단층촬영 영상을 많이 이용되고 있다[1~5]. 방사선 치료에 사용되는 CT (Computed Tomography) 영상은 종양의 위치, 크기, 모양, 그리고 주변 정상조 직과의 경계를 명확하게 나타낼 뿐만 아니라 치료 계 획 시 정상조직의 선량과 종양조직의 선량분포를 나 타내는데 매우 중요한 역할을 한다. CT 영상은 HU (Hounsfield Unit)의 CT Number로 표현된다. 그리고 CT Number는 전자 밀도로 변환이 되고 방사선 치료 계획 시 불균질 조직들의 밀도 차를 이용하여 선량 계산을
한다[6~8]. 이는 CT Number가 변화하면 전자밀도가 변
화하고 변화된 전자밀도로 인해 방사선 치료 계획 시 선량 분포의 오류를 범할 수 있어 많은 연구자들이 전 자밀도와 CT Number의 관계에 관한 연구를 하였다
[9~11].
정확한 선량분포를 위하여 가능한 정확한 CT 영상 을 구현 하여야 한다. CT 영상의 질에 영향을 미치는 요소들로는 노이즈, 공간 분해능, 대조도 분해능, 그리 고 인공허상 등으로 나타낼 수 있고 영상의 질을 향상 시키기 위해 CT 정도 관리가 제안 되고 있다[12~14]. 하 지만 인체에 수술이나 처치 또는 여러 가지 이유로 인
한 고 밀도의 물질이 삽입되어 있는 상태에서 CT 촬 영을 하면 금속물로 인한 인공허상(Metal Artifact)이 발 생하여 영상을 질을 저하시키고 미세부분의 관찰 능 력을 감소시킨다[15]. 이러한 문제는 정도 관리를 통해 영상의 질을 향상시키기 어려워 다른 기술을 통해 metal artifact를 줄이려는 많은 연구가 이루어지고 있다
[16~22]. 최근에는 O-MAR의 소프트웨어가 개발되어 관
련된 연구가 많이 진행 되었다[23~25]. 이에 본 연구는 팬텀을 가지고 metal artifact를 감소시키는 O-MAR을 적용하였을 때 방사선 치료 계획 시 체적과 선량 분포 의 변화에 대해서 평가하고자 한다.
Ⅱ. MATERIAL AND METHOD
CT 영상은 Hounsfield Unit(HU)의 CT Number로 표 현된다.
×
(1)
μw는 물의 선감약계수이고, μ는 해당 물질의 선감약 계수이며 공기를 -1000, 물을 0으로 설정하여 CT Number를 나타낸다. 선감약계수는 단위 부피당 전자 수를 나타내는 전자밀도와 물질의 원자 번호 그리고 X 선의 에너지에 의존한다[26~27]. 본 연구에서는 CT Number 변화에 대한 체적과 선량분포를 비교하기 위 하여 인체 조직과 유사한 Gammex 467 Tissue Characterization Phantom (TomtTherapy Inc., USA, Madison)을 사용하였다. Gammex 467 Tissue Characterization Phantom은 직경 33 cm, 두께 5 cm의 Solid Water 재질의 원반 형태로 되어있으며, 내부에 직 경 2.8 cm의 구멍이 16 개 뚫려 있어 물과 조직 등가 물질을 삽입할 수 있도록 구성되어있다. 함께 제공된 원기둥은 지름 2.8 cm, 높이 7 cm로 폐, 지방, 유방, 뇌, 간, 뼈, 뼈 미네랄, 탄산 칼슘 및 피질골 등의 조직 등 가 물질과 Solid Water 물질로 이루어져있다 [Fig. 1].
"J. Korean Soc. Radiol., Vol. 8, No. 5, August 2014"
(a) SET-UP image (b) schematic diagram
Fig. 1. Gammex 467 Tissue Characterization Phantom.
각 원기둥의 물에 대한 상대적인 전자밀도와 질량 밀도는 Table 1과 같다.
Rod Materials Physical Density g/cm3
Electron Density Relative to Water
LN-300 Lung 0.28 0.276
LN-450 Lung 0.45 0.439
AP6 Adipose 0.945 0.928
BR-12 Breast 0.981 0.958
CT Solid Water 1.018 0.989
BRN-SR2 Brain 1.051 1.047
LV1 Liver 1.096 1.064
IB Inner Bone 1.133 1.086
B200 Bone Mineral 1.15 1.102
Table 1. Electron density relative to water and physical density of the Gammex 467 phantom's rod materials.
1. 체적 측정
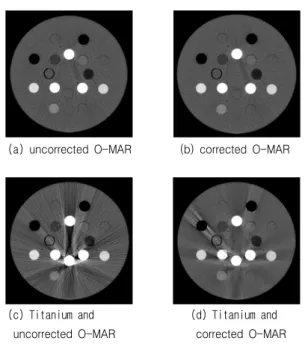
전산화 단층 모의 치료촬영기 Brilliance CT Big Bore (Philips, Netherlands, Eindhoven)에서 Gammex 467 단면 영상을 획득하였다. Gammex 467을 CT Scanner의 중심 에 위치 시키고 120 kVp, 250 mAs 의 조건으로 7 회 촬영하였고, Standard의 해상도와 재구성 (Reconstruction), Standard (B)의 Filter를 이용하여 3 mm 두께로 동일하게 영상을 재구성하여 Original images를 획득하였다. 그리고 고 밀도 물질에 의한 인공허상을 인위적으로 발생시키기 위하여 Titanium 원기둥을 삽 입하고 동일한 조건으로 촬영하여 Titanium images를 획득하였다. Original images와 Titanium images에 O-MAR 알고리즘을 적용하여 Original O-MAR corrected images와 Titanium O-MAR corrected images를 획득 하였다 [Fig. 2].
획득한 4 개 그룹의 영상을 방사선치료계획 시스템 (Radiation Treatment Planning System, RTP)에 전송하여
각 원기둥의 체적을 측정하였다. 체적 분석은 전산화 치료계획시스템 Eclipse Ver. 11 (Varian, USA, Palo Alto) 의 Auto Contouring을 이용하였다. Auto Contouring은 임의의 CT Number 영역을 설정하면 ROI 내에서 CT Number 데이터를 가지고 자동으로 영역을 구분하는 소프트웨어 이다. 본 연구에서는 Gammex 467 원기둥 의 평균 CT Number를 기준으로 ± 30 % 값을 설정하 여 Auto Contouring을 하였다. 각각 7 회 원기둥의 체 적을 측정하여 비교 분석하였다.
(a) uncorrected O-MAR (b) corrected O-MAR
(c) Titanium and (d) Titanium and uncorrected O-MAR corrected O-MAR
Fig. 1. CT image of phantom.
2. 선량분포
CT 촬영 조건은 체적 측정 시와 동일하게 하였다.
고체 물 팬텀 위에 Gammex 467을 올려 놓고 CT 영상 을 획득하였다. 획득한 영상을 Original images, Titanium images, Original O-MAR corrected images, 그리고 Titanium O-MAR corrected images로 재구성하여 Eclipse 에 전송하였다. 각 영상에 선형가속기 TrueBeam STx (Varian, USA, Palo Alto)의 6, 10, 그리고 15 MV 광자선 을 이용하여 조사면 15×15 cm2에 200 MU를 Dose Rate 600으로 고정하여 조사되도록 Anisotropic Analytical Algorithms (AAA)을 이용하여 선량계산 하였고 2 차원 선량 분포를 Gammex 467 바닥으로부터 2.5 cm 깊이에 서 Dicom RT Dose 형태로 추출하였다. 계산된 선량 분
측정을 하였다. MapCHECK™은 2 차원 방사선 치료 빔 측정 시스템으로 단순 방사선 조사면이나 세기 변조 방사선 치료 계획 등의 선량 분포를 측정하기 위해 이 용된다. 총 445 개의 다이오드 검출기가 중심에서 10 × 10 cm 안쪽은 7.07 mm 간격으로 바깥쪽은 14.14 mm 간격의 팔각형 격자 형태로 배열되어 있어 전자선은 6 MeV에서 25 MeV까지 광자선은 Co-60에서 25 MV까지 측정할 수 있다. 치료용 테이블 위에 MapCHECK™을 위치시키고 2 차원 선량 분포를 추출한 지점과 동일한 위치를 재연하기 위해 MapCHECK™ 장비 자체가 가지 고 있는 고유의 buildup (2.0 +- 0.1 g/cm2)을 고려하여 5 mm의 고체 물 팬텀을 올리고 Gammex 467을 고정하여 각 조건별로 30 회씩 측정하였다 [Fig. 3].
(a) SET-UP image (b) schematic diagram
Fig. 3. Measurement image at the treatment room.
측정된 선량 분포는 전용 소프트웨어 SNC Patient Ver. 3.3.0 (Sun nuclear, USA, Melbourne)을 이용하여 Eclipse에서 계획한 선량분포와 비교하여 두 지점의 비 율이 1 보다 작거나 같으면 신뢰할 수준의 측정값을 나타내는 Gamma Index 분석을 이용하여 선량 계획과 측정 지점의 동일한 지점 사이의 허용된 차이 값을 나 타내는 Percent difference (%Diff)를 5 %, 측정된 지점의 주변 반경을 3 mm로 설정하여 선량 계획한 값과 비교 하였다. 통계적 분석 방법으로 체적의 평균 비교는 비 모수 독립 K 표본 검정을 통해 비교 분석하였고, 선량 분포는 일표본 T 검정과 대응표본 T 검정을 통해 O-MAR 적용 전 후를 비교 분석하였다. 통계 분석은 SPSS Ver. 18.0 (SPSS Inc, USA, Chicago)을 사용하였고
Ⅲ. RESULT
1. 체적
Gammex 467의 원기둥 중 CT Number가 확연히 차 이 나는 SB3 Cortical Bone, AP6 Adipose, CB2-50%
CaCO3, CB2-30% CaCO3, BR-12 Breast, LN-300 Lung, LN-300 Lung, IB Inner Bone, LV 1 Liver, B200 Bone Mineral, 그리고 LN-450 Lung 의 평균 체적은 Original images에 O-MAR를 적용하였을 때는 체적의 변화가 거 의 없는 것을 알 수 있었다. Titanium을 삽입 하였을 때 BR-12 Breast가 16.8 % 그리고 LV 1 Liver가 36.8 % Original 보다 체적이 감소하였고 Titanium images에 O-MAR를 적용하였을 때는 BR-12 Breast는 16.8 % 그 리고 LV 1 Liver는 40.2 % O-MAR 적용 전 보다 증가 하여 Original images의 체적과 유사하게 나타났다. 그 러나 CB2-30% CaCO3는 Titanium을 삽입하였을 때는 체적의 변화가 거의 없었으나 Titanium images에 O-MAR를 적용하였을 때 32.1 % O-MAR 적용 전 보다 체적이 감소하였다 [Table 2].
unit: cm3
A B C D P
SB3 Cortical
Bone
10.35
±0.00 10.34
±0.00 10.33
±0.00 10.29
±0.00 0.000 AP6
Adipose 10.71
±0.01 10.80
±0.00 10.96
±0.25 10.84
±0.10 0.062 CB2-50%
CaCO3
10.23
±0.01 10.23
±0.01 10.22
±0.00 10.13
±0.01 0.000 CB2-30%
CaCO3
10.04
±0.01 10.05
±0.01 10.08
±0.01 6.84
±0.07 0.000 BR-12
Breast
11.66
±0.06 11.66
±0.06 9.69
±0.39 11.32
±0.20 0.000 LN-300
Lung
10.51±0 .01
10.51
±0.01 10.46
±0.01 10.4
±0.00 0.000 IB Inner
Bone
9.91
±0.00 9.91
±0.00 9.97
±0.03 10.07
±0.01 0.000 LV 1
Liver
9.29
±0.03 9.29
±0.03 5.87
±0.41 8.23
±0.14 0.000 B200 Bone
Mineral 9.94
±0.01 9.94
±0.01 10.05
±0.05 10.13
±0.03 0.000 LN-450
Lung
10.66
±0.00 10.66
±0.00 10.59
±0.03 10.09
±0.01 0.000 Table 2. Result of analysis of the rod volume uncorrected O-MAR technique (A), Rod volume corrected O-MAR technique (B), Titanium inserted volume image uncorrected O-MAR technique (C), Titanium inserted volume image corrected O-MAR technique (D) and p-values (P).
"J. Korean Soc. Radiol., Vol. 8, No. 5, August 2014"
2. 선량 분포
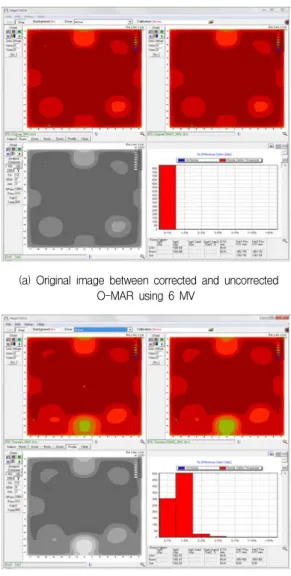
Eclipse에서 추출한 Original images와 Original O-MAR corrected images의 선량 분포를 비교하였을 때 선량 계획한 데이터 상에서는 미세한 차이가 있었으 나 3 mm / 5 % Difference 의 Auto Normalization의 % Pass는 100 % 선량 분포가 일치 하였다. 이는 Titanium 을 삽입 후 획득한 Titanium images와 Titanium O-MAR corrected images의 비교에서도 같은 결과가 나타났고 각 각의 에너지에서도 동일한 결과가 나타났다 [Fig.
4].
(a) Original image between corrected and uncorrected O-MAR using 6 MV
(b) Titanium inserted image between corrected and uncorrected O-MAR using 6 MV Fig. 4. Comparisons of dose distribution calculated.
실제 측정한 측정 데이터와 O-MAR를 적용하기 전 과 후에 계획한 선량 분포의 데이터와 비교 분석한 결 과는 Titanium이 없을 때의 선량 분포는 O-MAR를 적 용하기 전 영상의 선량 분포가 실제 측정한 선량 분포 와 좀 더 일치하였다. 이와 반대로 Titanium이 삽입된 선량 분포는 O-MAR를 적용한 영상의 선량 분포가 O-MAR를 적용하기 전의 선량 분포 보다 1.4 에서 1.6
% 높게 나타났다 [Table 3, 4].
N=30
Original
(%)
Original O-MAR (%)
Difference
(%) P
6 MV 99.3±0.0 98.6±0.0 -0.7 0.000
10 MV 99.9±0.1 99.7±0.0 -0.2 0.000
15 MV 100±0.0 100±0.0 0.0 0.000
Table 3. Result of analysis of measured and calculated dose distribution between uncorrected O-MAR and corrected O-MAR.
N=30
Titanium (%) Titanium O-MAR (%) P
6 MV 90.7±0.2 92.2±0.0 0.000
10 MV 93.2±0.1 94.5±0.1 0.000
15 MV 93.7±0.2 95.0±0.1 0.000
Table 4. Result of analysis of measured and calculated dose distribution with Titanium inserted between uncorrected O-MAR and corrected O-MAR.
Ⅳ. DISCUSSION AND CONCLUSION
방사선 치료는 정상 조직에는 최대한 적은 양의 방 사선을 조사하며 종양 조직을 괴사 시키는데 목적이 있다. 그러나 인공허상은 보고자 하는 영역의 조직 또 는 종양 등의 경계를 명확하게 구분하지 못하고 치료 계획 시 미세한 부분의 윤곽을 그리는데 거짓된 정보 를 전달할 수 있다. 이에 CT 촬영 시 금속물로 인한 인공허상을 제거 하려는 방법들이 많은 보고 되고 있
다[16~22]. 최근에는 Metal Artifact Reduction for
Orthopedic Implants (O-MAR) 기술이 개발 되었다.
O-MAR는 금속으로 인한 인공허상을 감소시키고 영상 의 품질을 개선할 수 있다고 보고되었다. O-MAR는 첫 번째로 금속 영상을 만들도록 입력 영상에 임계치를 적용하고 금속 영상은 금속으로 분류되는 픽셀을 제 외하고 모든 픽셀을 0으로 설정하도록 구성한다. 이
재 하지 않으면 더 이상의 처리는 실행되지 않는 방법 으로 원본의 입력 영상으로부터 제거된 수정된 출력 영상을 반복적으로 보정하는 기술이다[28].
Kidoh M. 등의 연구 결과에 따르면 O-MAR를 적용 하였을 때 영상의 잡음 등이 감소하여 영상의 질을 높 여 구강 진단 시 metal artifact로 인해 확인할 수 없었 던 구조물의 묘사가 가능하다고 보고되었다[24]. 이것은 본 연구의 전산화치료계획 시스템의 Auto Contouring 소프트웨어를 이용한 체적 분석의 결과와 같이 O-MAR를 적용하면 금속으로 인한 영상의 왜곡이 제 거 되면서 주변의 다른 CT Number를 가지는 물질과 경계를 좀 더 뚜렷하게 구분 하는 것으로 기존의 연구 결과를 뒷받침 하고 있다.
Bazalova M. 등의 연구는 metal artifact를 줄이고 선 량 계산을 하면 화질의 개선 효과가 매우 커 좀 더 정 확한 선량 계산을 할 수 있다고 Monte Carlo 치료 계획 을 통해서 보여 주었고 metal artifact 감소의 필요성에 대해 강조 하였다[29]. 이는 전산화 치료계획 시스템에 서 추출한 O-MAR 적용 전 후의 선량 분포 데이터와 MapCHECK™을 이용하여 선형가속기실에서 실제 측 정한 선량 분포 데이터와 비교한 실험 결과에서 보는 거와 같이 metal artifact 가 존재하는 영상은 보정을 통 하여 왜곡을 최대한 줄여서 치료 계획해야 정확한 선 량 분포를 나타내는 것을 알 수 있었다.
O-MAR 재구성 알고리즘은 금속으로 인한 인공음 영을 감소 시켜 관심 부위의 미세 부분을 좀 더 정확 하계 경계를 구분 지을 수 있었다. 그리고 방사선의 선량 분포 또한 임상적으로 허용 가능한 수준이기는 하였으나 오차를 줄여 방사선 치료의 효율성을 높일 수 있는 것으로 연구 결과를 얻었다. 하지만 인공음영 이 없는 영상에 O-MAR를 적용한 CT 영상을 이용하여 치료 계획을 하면, 실제 측정한 선량 분포와 비교 하 였을 때 임상적으로 유의한 수준은 아니었으나 정확 성이 최대 0.7 % 떨어졌다.
따라서 방사선 치료 계획 시 CT 영상에 인공음영이 발생 하지 않았을 때는 O-MAR를 적용하지 않을 것을 권고하고, 인공음영이 있는 영상은 치료 부위나 주변
Reference
[1] Jarritt PH et al., "Use of Combined PET/CT Images for Radiotherapy Planning: Initial Experiences in Lung Cancer,"
BIR, Vol. Suppl. 28, No. 1, pp.33-40, 2005.
[2] Yang W et al., "Adequacy of Inhale/Exhale Breathhold CT Based ITV Margins and Image-Guided Registration for Free-Breathing Pancreas and Liver SBRT." Radiat Oncol, Vol.
9, No.11, 2014.
[3] Smyth G et al., "A Dose Distribution Overlay Technique for Image Guidance During Prostate Radiotherapy." BIR, Vol. 81, Issue. 971, pp. 890-896, 2008.
[4] Wu WC et al., "A Study on The Influence of Breathing Phases In Intensity-Modulated Radiotherapy of Lung Tumours Using Four-Dimensional CT." BIR, Vol. 83, Issue. 987, pp. 252-256, 2010.
[5] Kim YJ et al., “A Comparison Between Three Dimensional Radiation Therapy and Intensity Modulated Tadiation Yherapy on Prostate Cancer” Journal of the Korean Society of Radiology, Vol. 7, No. 6, pp. 409-414, 2013.
[6] Chris C, James C. Harrington, and Larry A DeWerd. "An Electron Density Calibration Phantom for CT-Based Treatment Planning Computers." Medical physics, Vol. 19, No. 2, pp.
325-327, 1992.
[7] Schneider Uwe Eros Pedroni and Antony Lomax. "The Calibration of CT Hounsfield Units for Radiotherapy Treatment Planning." Phys. Med. Biod, Vol. 41, No.1, pp.111-124, 1996.
[8] Thomas SJ. "Relative Electron Density Calibration of CT Scanners for Radiotherapy Treatment Planning." BIR, Vol. 72, Issue. 860, pp.781-786, 1999.
[9] Tsukihara, Masayoshi et al., "Conversion of The
Energy-Subtracted CT Number to Electron Density Based on A Aingle Linear Relationship: An Experimental Verification Using A Clinical Dual-Source CT Scanner." Phys. Med. Biol, Vol. 58, No. 9, pp.135-144, 2013.
[10] Skrzy-ski, Witold et al., "Computed Tomography As A Source of Electron Density Information For Radiation Treatment Planning." Strahlentherapie und Onkologie, Vol. 186, No. 6, pp.327-333, 2010.
[11] Yohannes, Indra et al., "A Formulation of Tissue-And Water-Equivalent Materials Using The Stoichiometric Analysis Method for CT-Number Calibration In Radiotherapy Treatment
"J. Korean Soc. Radiol., Vol. 8, No. 5, August 2014"
Planning." Phys. Med. Biol, Vol. 57, No. 5, pp.1173-1190, 2012.
[12] Hounsfield GN. "Picture Quality of Computed Tomography."
AJR, Vol. 127, No. 1, pp.3-9, 1976.
[13] AAPM Report 1. "Phantoms for Performance Evaluation and Quality Assurance of CT Scanners." Medical Physics Publishing, 1977.
[14] AAPM Report 60. "Instrumentation Requirements of Diagnostic Radiological Physicists." Medical Physics Publishing, 1998.
[15] Barrett, Julia F, and Nicholas Keat. "Artifacts in CT:
Recognition and Avoidance1." Radiographics, Vol. 24, No. 6, pp.1679-1691, 2004.
[16] Kalender, Willi A, Robert Hebel, and Johannes Ebersberger.
"Reduction of CT Artifacts Caused by Metallic Implants."
Radiology, Vol. 164, No. 2, pp.576-577, 1987.
[17] Glover, Gary H, and Norbert JP. "An Algorithm for The Reduction of Metal Clip Artifacts in CT Reconstructions."
Medical physics, Vol. 8, No. 6, pp.799-807, 1981.
[18] Wang G et al., "Iterative Deblurring for CT Metal Artifact Reduction." IEEE Transactions on Medical Imaging , Vol. 15, No. 5, pp.657-664, 1996.
[19] Robertson, Douglas D et al., "Total Hip Prosthesis Metal-Artifact Suppression Using Iterative Deblurring Reconstruction." Journal of computer assisted tomography, Vol.
21, No. 2, pp.293-298, 1997.
[20] Zhao, Shiying et al., "X-ray CT Metal artifact Reduction Using Wavelets: An Application for Imaging Total Hip Prostheses."
IEEE Transactions on Medical Imaging, Vol. 19, No. 12, pp.1238-1247, 2000.
[21] Watzke, Oliver, and Willi AK. "A Pragmatic Approach to Metal Artifact Reduction in CT: Merging of Metal Artifact Reduced Images." European radiology, Vol. 14, No. 5, pp.849-856, 2004.
[22] Zhuge Y et al., "SU-E-I-51: Metal Artifact Reduction in CT Using Deformable Tissue-Class Modeling." Medical Physics, Vol. 40, No. 6, pp.136-137, 2013.
[23] Glide-Hurst C et al., "Changes Realized from Extended Bit-Depth and Metal Artifact Reduction in CT." Medical physics, Vol. 40, No. 6, pp.061711, 2013.
[24] Kidoh M et al., "Reduction of Dental Metallic Artefacts in CT:
Value of A Newly Developed Algorithm for Metal Artifact Reduction (O-MAR)." Clinical radiology, Vol. 69, No. 1, pp.
e11-e16, 2014.
[25] Hilgers, Guido, Tonnis Nuver, and Andre Minken. "The CT
Number Accuracy of a Novel Commercial Metal Artifact Reduction Algorithm for Large Orthopedic Implants." Journal of Applied Clinical Medical Physics, Vol. 15, No. 1, pp.274-278, 2014.
[26] Hounsfield GN. "Computerized Transverse Axial Scanning (Tomography): Part I. Description of System." British Journal of Radiology, Vol. 45, pp.1016-1022, 1973.
[27] Constantinou, Chris, James C. Harrington, and Larry A DeWerd.
"An Electron Density Calibration Phantom for CT-Based Treatment Planning Computers." Medical physics, Vol. 19, No.
2, pp.325-327, 1992.
[28] Philips CT Clinical Science: Metal Artifact Reduction for Orthopedic Implants (O-MAR), white paper [Internet]. Andover, MA: Philips Healthcare USA; 2012. [cited 2013 Jun 26].
Available from:
http://clinical.netforum.healthcare.philips.com/us_en/Explore/White- Papers/CT/Metal-Artifact-Reductionfor-Orthopedic-Implants-(O-MA R)
[29] Bazalova, Magdalena et al., "Correction of CT Artifacts and Its Influence on Monte Carlo Dose Calculations." Medical physics, Vol. 34, No. 6, pp.2119-2132, 2007.