반도체디스플레이기술학회지 제18권 제4호(2019년 12월)
Journal of the Semiconductor & Display Technology, Vol. 18, No. 4. December 2019.
Blur Detection through Multinomial Logistic Regression based Adaptive Threshold
Muhammad Tariq Mahmood
*, Shahbaz Ahmed Siddiqui
*and Young Kyu Choi
*†*†
Korea University of Technology and Education, School of Computer Science and Engineering
ABSTRACT
Blur detection and segmentation play vital role in many computer vision applications. Among various methods, local binary pattern based methods provide reasonable blur detection results. However, in conventional local binary pattern based methods, the blur map is computed by using a fixed threshold irrespective of the type and level of blur.
It may not be suitable for images with variations in imaging conditions and blur. In this paper we propose an effective method based on local binary pattern with adaptive threshold for blur detection. The adaptive threshold is computed based on the model learned through the multinomial logistic regression. The performance of the proposed method is evaluated using different datasets. The comparative analysis not only demonstrates the effectiveness of the proposed method but also exhibits it superiority over the existing methods.
Key Words : Blur detection, Multinomial logistic regression, Blur map, Blur Segmentation, Local binary pattern
1. Introduction
1In general, images acquired from various optical devices contain blur and other artifacts. Blur can be categorized mainly into defocus blur and motion blur. Defocus blur is caused by improper adjustment of the focal length of the imaging system at the time of image acquisition[1-3].
Defocus blur can lead to the loss of valuable information.
Hence, detection and segmentation of blurred and sharp regions play vital role in many computer vision applications including medical imaging like magnetic resonance imaging (MRI), computed tomography (CT) ultrasonography (USG) and magnetic resonance angiography (MRA)[4, 5].
In literature, a number of techniques have been proposed to address this problem [6-8]. In general, these techniques consist of two steps. First, a blur measure operator is applied to discriminate the blurred pixels from the sharp pixels in the image. This step provides an initial blur map. Then, a classification method is applied to segment the blur map into two classes: blue pixels and sharp pixels. The accuracy of
†
E-mail: [email protected]
segmentation results depends on the blue map estimation.
Therefore, accurate blur measure is important in blur segmentation. Zhuo and Sim [4] proposed the ratio of gradients of the input and re-blurred images to estimate the initial defocus blur and then matting Laplacian is applied to enhance the initial blur measures. Golestaneh and Karam [9]
exploited the variations of coefficients in frequency domain
for blur and non-blur regions of the image. They computed
the spatially varying blur by applying multiscale fusion of the
high-frequency discrete cosine transform (DCT) sorted
coefficients (HiFST). Yi and Eramian [8] proposed an
algorithm for detection and segmentation of blurred and sharp
regions. Their method consists of three steps: 1) local binary
patterns (LBP) based multi-scale sharpness map generation, 2)
application of alpha matting for enhancement of initial blur
map, 3) segmentation of blur map using multi-scale sharpness
inference. In another method (HE) , blur map is estimated
based on the entropy and range of the histogram of the image
[10]. Liu, R et al. suggested several blur features modeled by
image color, gradient, and spectrum information. Then, these
features are used for classification of the blurred regions in
the images [11]. Recently, a blur metric based on Multiscale
Blur Detection through Multinomial Logistic Regression based Adaptive Threshold 111
SVD fusion is proposed where different sub-bands of the selected singular values are fused in multiscale image windows [12]. In another method, a multi-stream bottom-top- bottom fully convolutional network (BTBNet) is proposed to gradually integrate nearby feature levels of bottom to top and top to bottom. The deep learning method also included a residual learning architecture that gradually restore finer structures from the small scale to the large scale [1]. Zeng, K., et al proposed a convolutional neural networks (ConvNets) to automatically obtain the local metric map for defocus blur detection [13].
In this paper, we propose an effective blur measure based on the local binary pattern (LBP) with an adaptive threshold for blur detection. The sharpness metric developed based on LBP uses a fixed threshold irrespective of the type and level of blur that may not be suitable for images with variations in imaging conditions and blur amount and type. Contradictory, the proposed measure uses an adaptive threshold for each image based on the image and blur properties to generate improved sharpness metric. The adaptive threshold is computed based on the model learned through the multinomial logistic regression (MLR). To develop the MLR based model, first, we prepare the training data which consists of a feature vector and target value for each image. The feature consists of various measures that capture the variations in the image. The performance of the proposed method is evaluated using different datasets. The comparative analysis not only demonstrates the effectiveness of the proposed method but also exhibits it superiority over the existing methods.
2. Proposed Method 2.1 Motivation
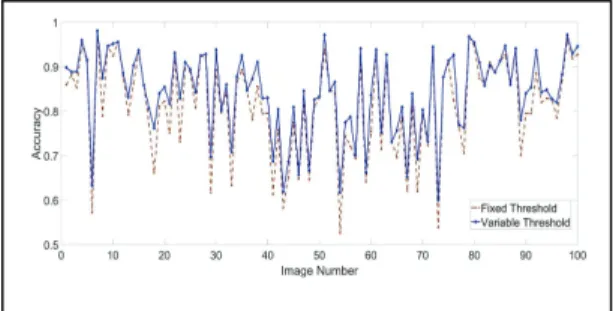
We have observed that the LBP based method [8] uses fixed threshold i.e. = 0.016 to compute the sharpness metric for all the images in the dataset. In our analysis, we generate the sharpness metric of different images on different threshold empirically, and we observed that the accuracy of the sharpness metric changes when we vary the threshold i.e. most of images in the data set do not provide best sharpness metric for fixed threshold used in LBP based method. Threshold can be vary based on level and type of blurriness and scene of the image. Figure 1 compares the performance of blur segmentation through LBP based
methods using fixed and variable thresholds, which clearly shows that the fixed threshold to calculate the sharpness metric is not the optimal solution and performance of LBP based method can be significantly increase by using adaptive threshold.
Fig. 1. Accuracy comparison between fixed and variable threshold based blur segmentation.
In this paper, we developed a method to find the best threshold for every image based on the properties of blur in the image (i.e. level and type of blurriness and scene). This best threshold is then used to generate the improved blur map using LBP based method. The block diagram of the proposed method is shown in Fig. 2. First, the feature vector f is generated from the input image I. Then, the best threshold for that image is predicted from multinomial logistic regression based model ĝ(f). I n the next step, an improved blur map of each image is computed using its best threshold in LBP based method. Lastly, The segmentation of improved blur map achieved by Otsu’s method. The proposed method is further explained in subsequent subsections.
Fig. 2. Proposed method framework.
2.2 Multinomial Logistic Regression
Logistic regression is one of most popular and widely used
learning algorithm in the field of statistics now a days. It used
to automatically predict the outcome based on the learning
Muhammad Tariq Mahmood, Shahbaz Ahmed Siddiqui and Young Kyu Choi 112
model. Logistic regression can be bi or multinomial. In binomial logistic regression the outcome is of 2 categories or classes. In Binomial logistic regression, generally the outcome is coded into "0" and "1" or "Positive" and
"Negative" class. Multinomial Logistic regression deals with three or more outcomes categories i.e. dependent variable ( ) taking 3 or more possible outcomes and the outcomes are nominal (consisting of unordered categories) in nature.
Multinomial logistic regression analyses the correlation between a categorical dependent variables and usually a continuous independent variables ( ) and evaluate the probabilities of "success" for each category.
Logistic Model with categories of dependent variable will have − 1 logit functions with separate parameters for each. Let the last category ( ) is the baseline, then the logit function for each category is given by equation:
log = + , = 1, . . , − 1, (1)
where Π denotes the response probabilities of ℎ category, satisfying Π = 1, α and β are the intercept parameters respectively. Note that the choice of baseline category is arbitrary, in our experiment we had taken the last category.
The multinomial logit model can be defined in terms of the response probabilities as:
Π = , = 1, … , (2)
From the eq (2) we can estimate the probability of each category with respect to baseline category. It is given by:
Π =
⋯(3)
Π =
⋯(4)
…
Π =
⋯(5)
The “1” term in each denominator and in the numerator of Π represents e for each α = β = 0 with the baseline category.
2.3 Model Learning
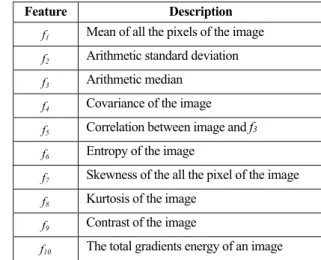
The development of adaptive threshold model has two main steps (a) Preparation of training data =
, t . (b) Learning of multinomial logistic regression model ĝ(f). In data preparation, we computed a feature vector f create with ten useful features ( , , … , ). Details for the feature vector are provided in Table 1. In this way, for each image 1 × 10 dimensional features vector = ( , , … , ) is computed. To train a model every feature vector f should have a target value t, which is the best threshold for each image in our case. The best threshold t is computed empirically. Once training data = , t is prepared then we developed a multiclass classifier model.
The multinomial logistic regression model ĝ(f) is a multiclass classifier which takes input as feature vector and classify it into one of the nine classes i.e. (0,1,..,8).
Table 1. Detail about feature vector
Feature Description
f1
Mean of all the pixels of the image
f2Arithmetic standard deviation
f3Arithmetic median
f4
Covariance of the image
f5Correlation between image and f
3 f6Entropy of the image
f7
Skewness of the all the pixel of the image
f8Kurtosis of the image
f9
Contrast of the image
f10
The total gradients energy of an image
2.4 Computing Blur Map ( )
Once the classifier ĝ(f) is developed, threshold prediction becomes a simple and straightforward process. The feature vector f of an image is provided to the classifier, and it returns an integer value for that image . The feature vector is classified into the range of '0-8' threshold value. This is then used as an input to the LBP process represented as below.
,
= ∑ ( − ) , (6)
S (x) = 0 v < T ,
1 v ≥ T , (7)
Blur Detection through Multinomial Logistic Regression based Adaptive Threshold 113
Then the improved blur map is generated using the expression.
M (x, y) = ∑ LBP
,( , ), (8)
where and
are the intensity of the central pixel and neighboring pixel located on the circular radius at coordinate (
, ) and (
, ) respectively. We use
instead of as the new predicted threshold to generate the improved blur map
,. Finally, the blur segmentation is carried out using the blur map.
3. Results
In our experiment, we have used the publically available dataset which consists 704 defocus partially blurred images [5, 6]. This dataset contains a variety of images with different magnitude of defocus blur. Each image of this dataset is provided with a hand-segmented ground truth image indicating the blurred and non-blurred regions. The proposed method is compared with the five state-of-art methods these are (1) LBP based segmentation defocus blur [6], (2) high frequency discrete cosine transform (DCT) coefficients (HiFST) [9], (3) histogram entropy (HE) [10], (4) discriminative blur detection features using local power spectrum (LPS) [11], (5) discriminative blur detection features using kurtosis (LK) [5]. The performance of different methods is evaluated using three well-known evolution criteria, Accuracy, Precision, and F-measure.
Fig. 3. Figure shows the segmented map achieved by different method.
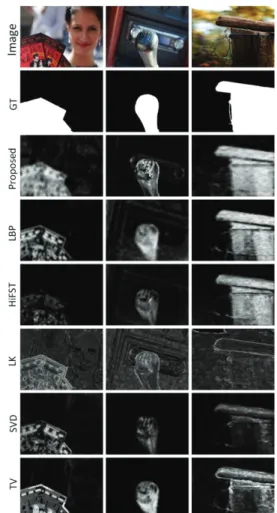
Fig. 4. Figure shows the blur map achieved by different methods.
First, blur maps for all images in the dataset are computed through the various methods LBP, HiFST, HE, LK and LPS, and the proposed method then these blur maps are segmented using simple threshold method. Finally, evaluation metrics are computed by using ground truths and the segmented results.
Quantitative comparisons of the proposed method with other comparator methods for all images in the dataset are shown in Fig. 3. The accuracy, precision, and f-measure of all the methods are compared. The metrics clearly show that the proposed method has higher performance than LBP based method with fixed threshold, as well as superior to the other conventional methods.
Qualitative performance is also evaluated on some random
images with different scenarios as well as the different
degrees of blur on the datasets and compared with other state
of art method. Figure 4 shows the comparison of segmented
Muhammad Tariq Mahmood, Shahbaz Ahmed Siddiqui and Young Kyu Choi 114
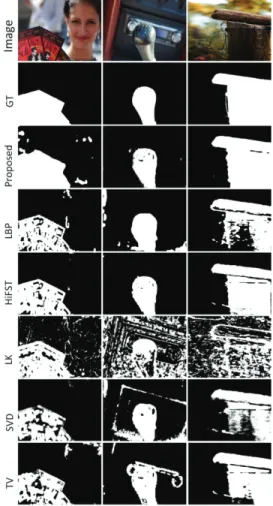
Fig. 5. Figure shows the segmented results achieved by different methods.
maps of all methods. Results shown in the figure clearly indicate that our proposed method can produce better blur maps than other methods with higher accuracy regardless of the blur type and scenario. Hence the performance of our method is greater as compared to the LBP with a fixed threshold and other methods. Again, Fig. 5 shows the segmentation results comparison of all the methods. Results shown in the figure clearly indicate that our proposed method can produce better segmented results than other methods with higher accuracy regardless of the blur type and scenario.
Hence, it can be concluded that the performance of our method is superior to the LBP with fixed threshold and other conventional methods.
4. Conclusion
In this article, to improve the performance of the LBP method in blur detection, we have proposed an adaptive threshold based method. First, we trained a model using MLR which can predict the threshold based on the image features, and then respective thresholds are used to acquire the blur map of the images using LBP. We have evaluated the performance of the proposed method in terms of accuracy and precision and F-measure using benchmark dataset. The results show the effectiveness of the proposed method to achieve good performance over a wide range of images, which outperforms the state-of-the-art defocus segmentation methods.
Acknowledgement
This work was supported by Korea University of Technology and Education (KOREATECH) Education and Research Promotion Program (2019).
References
1. Zhao, W., et al., Defocus Blur Detection via Multi- Stream Bottom-Top-Bottom Network. IEEE transactions on pattern analysis and machine intelligence, 2019.
2. M. T. Mahmood and Y. K. Choi, “3D Surface Reconstruction by Combining Focus Measures through Genetic Algorithm,” Journal of the Semiconductor &
Display Technology, vol. 13, no. 2, pp. 27-32, 2014.
3. M. T. Mahmood, U. Ali and Y. K. Choi, “Enhancing Focus Measurements in Shape From Focus through 3D Weighted Least Square,” Journal of the Semiconductor
& Display Technology, vol. 18, no. 3, pp. 66-71, 2019.
4. Zhuo, S. and T. Sim, Defocus map estimation from a single image. Pattern Recognition, 2011. 44(9): p. 1852- 1858.
5. Shi, J., L. Xu, and J. Jia. Discriminative blur detection features. in Proceedings of the IEEE Conference on Computer Vision and Pattern Recognition. 2014.
6. Shi, J., L. Xu, and J. Jia. Just noticeable defocus blur detection and estimation. in Proceedings of the IEEE Conference on Computer Vision and Pattern Recognition. 2015.
7. Kim, B., et al. Defocus and Motion Blur Detection with Deep Contextual Features. in Computer Graphics Forum.
2018. Wiley Online Library.
8. Yi, X. and M. Eramian, LBP-based segmentation of
defocus blur. IEEE transactions on image processing,
2016. 25(4): p. 1626-1638.
Blur Detection through Multinomial Logistic Regression based Adaptive Threshold 115