ISSN 1225-1534 (Print) http://dx.doi.org/10.5303/PKAS.2012.27.4.321 Publications of the Korean Astronomical Society
27: 321 ∼ 324, 2012 September
° 2012. The Korean Astronomical Society. All Rights Reserved.c
A MULTI-WAVELENGTH STUDY OF PAH-SELECTED STARBURST GALAXIES
T. Takagi1, H. Matsuhara1, T. Wada1, Y. Ohyama2, and S. Oyabu3
1Institute of Space and Astronautical Science, JAXA, Sagamihara, Kanagawa 229-8510, Japan
2Academia Sinica, Institute of Astronomy and Astrophysics, Taiwan
3Graduate School of Science, Nagoya University, Furo-cho, Chikusa-ku, Nagoya, Aichi 464-8602, Japan E-mail: [email protected]
(Received July 03, 2012; Accepted August, 12, 2012)
ABSTRACT
Using extensive mid-IR datasets from AKARI, i.e. 9-band photometry covering the wavelength range from 2 µm to 24 µm and the unbiased spectroscopic survey for sources with Sν(9 µm)>
0.3 mJy, we study starburst galaxies specifically at the redshift of z ∼ 0.5, whose mid-IR spectra are clearly dominated by the PAH emission features. PAH-selected galaxies, selected with extremely red mid-IR colour due to PAHs, have high rest-frame PAH-to-stellar luminosity ratios, comparable to those in the most active regions in nearby starburst galaxies. Thus, they seem to have active starburst regions spreading over the whole body. Furthermore, some of PAH-selected galaxies are found to have peculiar rest-frame 11-to-8 µm flux ratios, which is systematically smaller than nearby starburst/AGN spectral templates. This may indicate a systematic difference in the physical condition of ISM between nearby and distant starburst galaxies.
Key words: infrared: galaxies; galaxies: starburst; ISM: evolution; dust
1. INTRODUCTION
Mid-infrared (IR) surveys are a powerful tool for study- ing the infrared luminosity function as a function of redshift, an important measure of the cosmic star for- mation history of the universe (e.g. Goto et al., 2010).
However, the empirical estimate of the star formation rate from the mid-IR luminosity suffers uncertainty from the assumption on the mid-IR spectral energy dis- tributions (SEDs), which are usually dominated by the emission from very small grains and PAHs. In many IR extragalactic surveys, PAHs are the only dust species detectable in most of distant galaxies, because of rel- atively good sensitivity in the mid-IR range. Thus, a better understanding of the mid-IR spectral features, such as the PAH emission, is vital for the study of star formation activity in the distant universe.
2. NEP SURVEY
Along with the all-sky survey, AKARI performed 5,088 pointed observations in selected areas of sky during its cold phase with liquid helium. Using 13% of these pointed-observation opportunities, we conducted extra- galactic surveys around the North Ecliptic Pole (NEP).
A salient characteristics of this survey is its comprehen- sive mid-IR wavelength coverage, using 9 photometric bands to span the wavelength range from 2 to 24 µm.
Furthermore, we utilized a slit-less spectroscopic ca- pability of the IRC onboard AKARI for an unbiased spectroscopic survey in the mid-IR wavelengths.
2.1. Photometric Survey (NEP-Deep)
The NEP survey is two-tiered, consisting of the NEP- Deep and NEP-Wide surveys with the circular area of 0.6 deg2 and 5.8 deg2, respectively. The field configu- ration of the NEP-Deep survey is shown in Figure 1.
Here we mainly use the data from the NEP-Deep survey
http://pkas.kas.org 321
322 TAKAGI ET AL.
Outer Annulus
Inner Annulus
part Central
S9W
Fig. 1. Coverage map of the NEP-Deep survey at 9 µm. Square patterns indicate the field-of-view of the MIR- S channel of the IRC, each covering 100× 100.
which has follow-up observations over the whole elec- tromagnetic spectrum from X-ray to radio. Detailed descriptions of the NEP-Deep survey and the mid-IR source catalogue are found in Wada et al. (2008) and Takagi et al. (2012), respectively.
2.2. Slit-less spectroscoPIC surveY of galaxies (SPICY)
In the SPICY program, we obtained 5 – 15 µm spectra of mid-IR sources which are flux-limited sample with Sν(9 µm) > 0.3 mJy. The SPICY fields are patchily distributed around the NEP-Deep field, covering ∼ 1,000 arcmin2 in total. Most of the SPICY fields lie inside the NEP-Deep field. The spectral resolution of the IRC slit-less spectroscopy is R ' 50 and there- fore the narrow fine-structure lines, if any, would be smoothed out. The PAH 6.2, 7,7, and 8.6 µm were si- multaneously fitted along with the continuum. From these PAH features, we measured the PAH luminos- ity as well as the redshift for more than 50 galaxies at z < 0.5. The PAH luminosity [νLν(7.7 µm)] is found to be 109–1011 L¯. The SPICY project and spectral analyses will be presented elsewhere (Ohyama et al., in prep).
3. PAH-SELECTED GALAXIES
The excellent mid-IR wavelength coverage of the NEP survey enables us to photometrically identify galax- ies whose mid-IR emission is clearly dominated by PAHs. Takagi et al. (2007) demonstrated that the AKARI/IRC all-band photometry is capable of identi-
0 0.5 1 1.5 2
zspec 0
5 10 15
Flux ratio (S 11/S 7)
0.1 Gyr 0.2 Gyr
>0.3 Gyr M82 Arp220 Starburst age
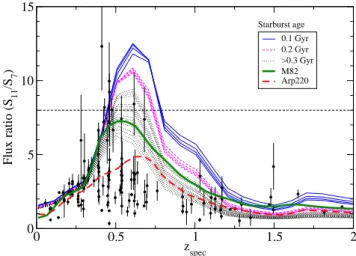
Fig. 2. Flux ratio of 11 to 7 µm as a function of redshift. Expected flux ratios from Arp220 and M82 are depicted as thick dashed and solid lines, respectively. A starburst SED model of Takago et al. (2003) is used for other lines. Horizontal lines indicate the flux ratio of 8, a selection criterion of PAH-selected galaxies. All-band- detected sources with spectroscopic redshift are indicated with solid circles.
fying the approximate spectral shape of the PAH emis- sion, specifically the steep rise in flux at the blue side of the PAH 6.2 µm feature. Based on this fact, we selected PAH-dominated galaxies at z ∼ 0.5 using a single colour, i.e. the 11-to-7 µm flux ratio as shown in Figure 2. This flux ratio corresponds to the PAH- to-stellar luminosity ratio for galaxies at z ∼ 0.5. We call galaxies with this flux ratio grater than 8 as PAH- selected galaxies. These galaxies are expected to have high specific star formation rate (SFR). Using a longer wavelength filters, such as 9 and 15 µm bands, PAH- selected galaxies at z ∼ 1 can be identified (Takagi et al., 2010).
For local galaxies, such high PAH-to-stellar luminos- ity ratios are found only in intensive star-forming re- gions (e.g. Wang et al., 2004). For PAH-selected galax- ies, we found high PAH-to-stellar luminosity ratios in global measurements. As is found in some of local lu- minous infrared galaxies, a small region could dominate the total infrared luminosity (e.g. Inami et al., 2010).
Even in such extreme cases, PAH-to-stellar luminosity ratio of a galaxy as a whole cannot be as high as ∼ 10, owing to the contribution of stellar luminosity from the other quiescent regions. PAH-selected galaxies seem to be dominated by starburst components with a large
A MULTI-WAVELENGTH STUDY OF PAH-SELECTED STARBURST GALAXIES 323
Fig. 3. Example of the SED fitting with SBURT. Filled circles and data with error bars indicate the model fluxes with filter convolution and the observed fluxes, respectively.
specific SFR, spreading over the whole body.
4. SED FITTING
We analysed the SED of PAH-selected galaxies using an evolutionary SED model of starburst galaxies (SBURT;
Takagi et al., 2003), and also with spectral templates of local galaxies. SBURT is a radiative transfer model of the spherical starburst region, which has centrally con- centrated stars and uniformly distributed dust clouds.
Fitting parameters are the starburst age, total mass of the system, the compactness of the starburst region (controlling the optical depth), and the type of the ex- tinction curve (MW, LMC, or SMC). In Figure 3, we show the example of the best-fitting SED models for optical-NIR and AKARI/IRC all-band photometries.
PAH-selected galaxies are all fitted with the dust model of the MW, which has the highest PAH fraction in dust, i.e. 5%.
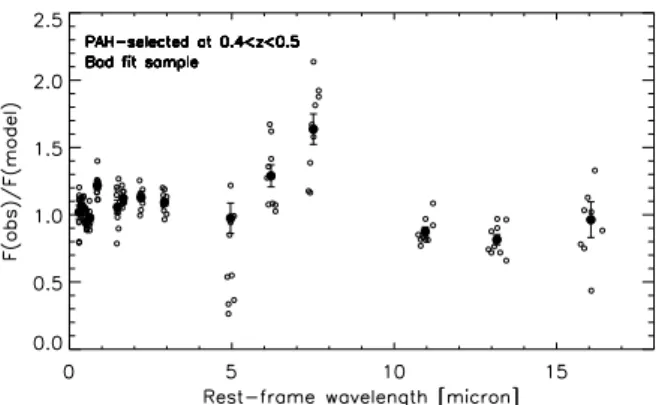
We found that SBURT can provide acceptable mod- els for the half of PAH-selected galaxies based on the χ2values. For the rest half of the sample, we show the ratio of the observed to model fluxes as a function of the rest-frame wavelength in Figure 4. These flux ra- tios indicate that the fit is rather good, except for the 5–7 µm wavelength range where the most prominent PAH features are found. A similar trend can be seen for the good fit sample as well, although it is less sig- nificant. Figure 4 shows that the model reproduces the rest-frame 11–15 µm fluxes well, and indicates a large anomaly in the rest-frame 11-to-8 µm flux ratio, i.e. the flux ratio of C-H to C-C mode emission of PAHs. A possible origin of this deviation is the ionization state of PAHs, which affect the absorption cross section of
Fig. 4. The ratio of the observed to model fluxes of PAH-selected galaxies at 0.4 < z < 0.5 as a function of the rest-frame wavelengths. The circles with error bars indicate the average flux ratios.
PAHs specifically around 8 µm (Li & Draine, 2001).
5. PAH INTERBAND FLUX RATIO
The SED fitting analyses indicate a systematic varia- tion of the PAH features, compared to the local tem- plate of the PAH features. From the SPICY dataset, we measured the inter-band flux ratio of PAH 6.2- to-7.7 µm and found that this ratio is similar to the values of nearby starburst galaxies. Unfortunately, the wavelength coverage of the SPICY is not wide enough to cover the PAH 11.3 µm. However, the ex- cellent wavelength coverage of photometric data allows us to estimate the PAH luminosity without a signif- icant k-correction, specifically at 7.7 µm. With the SPICY data, we confirmed that photometrically mea- sured PAH 7.7 µm luminosities linearly correlate with
324 TAKAGI ET AL.
0.3 0.4 0.5 0.6
Redshift 0
0.5 1 1.5 2
Flux ratio (L15 / S11)
Spoon 1C PAH-selected Starbursts Spoon 2C GTC spec.
SPICY Spoon 2B Spoon 3B
Fig. 5. The 15-to-11 µm flux ratio of PAH-selected galaxies at zspec ∼ 0.4. This flux ratio corresponds to 11- to-8 µm flux ratio at z = 0.4. Solid lines indicate the flux ratios expected from nearby starburst galaxies/AGNs taken from Soopn et al. (2007).
the spectroscopic measurements.
We investigated the rest-frame 11-to-8 µm flux ratio of PAH-selected galaxies at z ' 0.4 – 0.5, for which the spectroscopic redshift is available. At this redshift, the rest-frame 11-to-8 µm flux ratio can be measured with the AKARI 15-to-11 µm flux ratio. In Figure 5, we compare these flux ratios with those expected from a spectral template of Spoon et al. (2007) which has spectra with a wide variety of the PAH equivalent width and the silicate absorption. We found that the observed flux ratios of PAH-selected galaxies are too small to be reproduced by the nearby spectral tem- plate. In a resolved IRC image of M82 (Arimatsu et al., in prep), similar anomaly of the inter-band flux ra- tio can be found only in small spots around the centre.
In PAH-selected galaxies, such anomaly is found for global measurements, indicating the systematic differ- ence in the physical condition of ISM between nearby and distant starburst galaxies.
ACKNOWLEDGEMENTS
This research is based on observations with AKARI, a JAXA project with the participation of ESA. We would like to thank the AKARI team members for their extensive efforts.
REFERENCES
Goto, T., Takagi, T., Matsuhara, H., et al., 2010, Evo- lution of Infrared Luminosity Functions of Galax- ies in the AKARI NEP-Deep Field. Revealing the Cosmic Star Formation History Hidden by Dust, A&A, 514, A6+
Inami, H., Armus, L., Surace, J. A., et al., 2010, The Buried Starburst in the Interacting Galaxy II Zw 096 as Revealed by the Spitzer Space Telescope, AJ, 140, 63
Li, A. & Draine, B. T., 2001, Infrared Emission from Interstellar Dust. II. The Diffuse Interstellar Medium, ApJ, 554, 778
Spoon, H. W. W., Marshall, J. A., Houck, J. R., et al., 2007, Mid-Infrared Galaxy Classification Based on Silicate Obscuration and PAH Equiva- lent Width, ApJ, 654, L49
Takagi, T., Arimoto, N., Hanami, H., 2003, Evolu- tionary Spectral Energy Distribution Diagnostics of Starburst Galaxies: Signature of Bimodality, MNRAS, 340, 813
Takagi, T., Matsuhara, H., Goto, T., et al., 2012, The AKARI NEP-Deep Survey: a Mid-Infrared Source Catalogue, A&A, 537, A24
Takagi, T., Matsuhara, H., Wada, T., et al., 2007, Multi-Wavelength Analysis of 18 µm-Selected Galaxies in the AKARI/Infrared-Camera Moni- tor Field Towards the North Ecliptic Pole, PASJ, 59, 557
Takagi, T., Ohyama, Y., Goto, T., et al., 2010, Poly- cyclic Aromatic Hydrocarbon (PAH) Luminous Galaxies at z ∼ 1, A&A, 514, A5+
Wada, T., Matsuhara, H., Oyabu, S., et al., 2008, AKARI/IRC Deep Survey in the North Ecliptic Pole Region, PASJ, 60, 517
Wang, Z., Fazio, G. G., Ashby, M. L. N., et al., 2004, The Off-Nuclear Starbursts in NGC 4038/4039 (The Antennae Galaxies), ApJS, 154, 193