말소리와 음성과학 제3권 제3호 (2011) pp. 19~26
Acoustic correlates of prosodic prominence in conversational speech of American English, as perceived by ordinary listeners
Mo, Yoonsook1)
ABSTRACT
Previous laboratory studies have shown that prosodic structures are encoded in the modulations of phonetic patterns of speech including suprasegmental as well as segmental features. Drawing on a prosodically annotated large-scale speech data from the Buckeye corpus of conversational speech of American English, the current study first evaluated the reliability of prosody annotation by a large number of ordinary listeners and later examined whether and how prosodic prominence influences the phonetic realization of multiple acoustic parameters in everyday conversational speech. The results showed that all the measures of acoustic parameters including pitch, loudness, duration, and spectral balance are increased when heard as prominent. These findings suggest that prosodic prominence enhances the phonetic characteristics of the acoustic parameters.
The results also showed that the degree of phonetic enhancement vary depending on the types of the acoustic parameters.
With respect to the formant structure, the findings from the present study more consistently support Sonority Expansion Hypothesis than Hyperarticulation Hypothesis, showing that the lexically stressed vowels are hyperarticulated only when hyperarticulation does not interfere with sonority expansion. Taken all into account, the present study showed that prosodic prominence modulates the phonetic realization of the acoustic parameters to the direction of the phonetic strengthening in everyday conversational speech and ordinary listeners are attentive to such phonetic variation associated with prosody in speech perception. However, the present study also showed that in everyday conversational speech there is no single dominant acoustic measure signaling prosodic prominence and listeners must attend to such small acoustic variation or integrate acoustic information from multiple acoustic parameters in prosody perception.
Keywords: prosodic prominence, phonetic enhancement, F0, overall intensity, duration, formants
1. Introduction
Speech utterances are more than the linear concatenation of individual phonemes or words and organized by prosodic structures comprising phonological prosodic units of different sizes and the prominence relations among them. Prosodic units demarcate chunks of speech that group semantically coherent words in an utterance together. Within a chunk of speech, prominence highlights a word or a phrase that carries information about the message as discourse-new or focused.
1) Gwangju Institute of Science and Technology, [email protected]
Recieved: August 8, 2011 Revised: September 8, 2011 Accepted: September 17, 2011
Transferring information as intended by speakers to listeners is the main goal of speech communication. To communicate pragmatic and discourse meaning in everyday speech communication, speakers signal prosodic structures assigned to an utterance by modulating phonetic patterns of speech. Prosody is therefore a major source of phonetic variation in speech and the elements at the edges of prosodic units and under prominence are phonetically distinct from the other elements that are not at the edges of prosodic phrases nor prominent. From listeners’
standpoint, they must attend to the phonetic variation, more specifically, the acoustic variation, to reconstruct prosodic structures and further to understand the meaning as intended by speakers.
The main objective of this research is to uncover the phonetic nature in spontaneous conversational speech of American English
as produced for the natural communicative purposes, focusing on speech variability arising from prosodic prominence as identified by “ordinary” (untrained, non-expert and thus naïve in terms of phonetics and phonology of prosody annotation) listeners. More specifically, the current paper examines whether and how prosodic prominence influences the phonetic realization of acoustic parameters in speech, including F0, F1, F2, overall intensity, and duration, and whether ordinary listeners are sensitive to prosody-associated phonetic variation.
F0 is traditionally described as a primary acoustic correlate of prominence in many languages (e.g., Beckman, 1986;
Gussenhoven, Repp, Reitveld, Rump, and Terken, 1997; Ladd, 1996; Pierrehumbert, 1980). For example, in their perception studies, Gussenhoven and his colleagues demonstrated that the change of F0 relative to the abstract baseline of F0 affects the perception of prominence. Findings from more recent studies challenge, however, the view that F0 is the primary correlate of and the most salient cue for prominence (Heldner and Strangert, 1997; Kochanski, 2006; Kochanski, Grabe, Coleman, and Rosner, 2005; Fant and Kruckenberg, 1994; Sluijter and van Heuven, 1995). Their findings indicated other acoustic features including duration, intensity, spectral properties as the acoustic correlates of and the acoustic cues for prominence. For example, Kochanski and his colleagues (2005, 2006) claimed that F0 plays a minor role in the realization and the perception of prominence but rather loudness is more important in prominence classification. Turk and White (1999) showed that durational expansion affects the perception of prominence.
Although prior studies provided a cornerstone to understand the acoustic characteristics of prominence, there are some drawbacks as in the following: (1) most production studies employed laboratory speech such as carefully elaborated short or pseudo sentences, and (2) in most perception studies, the locations of prominence are annotated by a few highly trained experts. In other words, it is still not answered how prosodic prominence is phonetically implemented and how listeners perceive such prosodic prominence in everyday speech. The current study, therefore, examines the relationship between acoustic variability and prosodic prominence, drawing on the spontaneous, conversational speech of American English which is prosodically annotated by a large group of ordinary native listeners of American English.
The present study further attempts to evaluate two distinct hypotheses on the influence of prosodic prominence on vowel formant structures. It was shown that vowel quality is also
influenced by prosodic structures by prior laboratory, articulatory studies (Beckman, Edwards, and Fletcher, 1992; Cho, 2005; de Jong, 1995; Erickson, 2002). There are two distinct hypotheses that attempt to explain the relationship between prominence and formant structures: Hyperarticulation and Sonority Expansion Hypothesis. de Jong (1995) and Erickson (2002) claimed that vowels are hyperarticulated when a word is prominent (stressed or emphasized). On the other hand, Beckman and her colleagues (1992) and Cho (2005) claimed that sonority of vowels increases when they are pitch accented. These two hypotheses provide a conflicting prediction about the influence of prosodic prominence on vowel formant structures in height dimension:
Hyperarticulation Hypothesis predicts that high vowels will be higher and low vowels lower when they are prominent, while Sonority Expansion Hypothesis predicts that prominent vowels will be lowered regardless of vowel height. Therefore, according to Hyperarticulation Hypothesis, high vowels will have lower F1s and low vowels will higher F1s, whereas according to Sonority Expansion Hypothesis, all prominent vowels will have higher F1s.
The present study will look at how vowel formant structures are affected by prosodic prominence and further evaluate which hypothesis can provide a better account for the relationship between prosodic prominence and vowel formant structures in everyday conversational speech of American English.
2. Methods and Materials
2.1 Database
The present study draws on speech materials from the existing Buckeye corpus of spontaneous conversational speech in American English which was originally established by a group of researchers at the University of Ohio (Pitt, Dilley, Johnson, Kiesling, Raymond, Hume, and Fossler-Lussier, 2007). It contains 30 to 60 minute interviews between an interviewer and an interviewee. Forty Central Ohio natives (20 males and 20 females) were recruited from the Columbus, Ohio community in 2000. There were two age groups (under 30 and over 40) and balanced in terms of gender. The interviews were conducted in a small seminar room by one of two interviewers, a 32-year-old male or a 25-year-old female. During the interview, the interviewer asked a couple of questions about the interviewee and small questions about which the interviewee could express their
‘everyday’ opinions, e.g. education, religion, school life, and politics, were prompted by the interviewer. The conversations between the interviewer and the interviewee were spontaneous and
natural, and the interviewee’s turns were only recorded with high quality.
The recorded interviews were orthographically and phonemically transcribed. Once obtaining the orthographic transcriptions, the phonemic transcriptions were performed by two phases: the automatic phone transcription using the Entropic Aligner software in the first phase and the manual correction in the second phase. The transcriptions contained non-speech events including silences, non-vocal and vocal noises, disfluent events including cut-offs, errors, and fillers as well as lexical items and phones.
2.2 Rapid Prosody Transcription (RPT) task
A total of 54 speech excerpts (27 speech excerpts from male and female interviewees, respectively) were extracted from the Buckeye corpus of spontaneous speech of American English for prosody annotation (Pitt et al., 2007). Each speech excerpt, 11-58 second long, were carefully selected to minimally include speech errors and disfluencies and to contain the equal number of speech excerpts from the beginning, middle, and end part of interviews.
After extracting all the speech excerpts, the loudness of each excerpt was normalized with respect to the maximum root-mean-square (RMS) intensity, in order to equalize the loudness between sound files. Then the speech excerpts were grouped into two versions in order to balance the order of prosody transcription. In the first version, boundary annotations were obtained first and then prominence annotation, and in the second version, listeners marked prominence first and boundary next. The speech excerpts were presented on the computer in the randomized order. The corresponding orthographic transcripts were also prepared in a separate paper in the same order as the speech excerpts so that listeners can mark prominence and boundary while listening to the speech excerpts. In the orthographic transcripts, words were separated by a space with no punctuation or capitalization.
97 ordinary (untrained, non-expert) listeners, who are naïve in terms of phonetics and phonology of prosody transcription and have never been trained about prosody transcription before, were recruited from undergraduate Linguistics courses at the University of Illinois at Urbana-Champaign. They were all native speakers of American English and with no known hearing disorders. Before the transcription tasks, the listeners were provided a 5 minute introduction with simple definitions of prominence and boundary and completed the language background survey. The listeners performed the practice of prosody annotation together with a
recording of an arbitrary sequence of 7 numbers (e.g., 345-6789).
The prerecorded arbitrary 7 numbers instead of a word phrase were used for transcription practice in order to eliminate any possible influence of annotation practice on the transcription tasks.
While practicing prosody annotation, the listeners were asked to check the volume of the headset and the presentation file. The subjects were then provided the orthographic transcripts. During the transcription tasks, the subjects marked the locations of prominence and boundary on the orthographic transcripts with the same order of the sound files, while listening to the speech excerpts in randomized order. Each presentation began either with prominence block for a half of the subjects or with boundary block for the rest half of the subjects. They were provided one practice sound file in the beginning of each block of transcription in order for them to be ready for the transcription task: one for prominence and the other for boundary. There was no feedback afterwards. Once beginning the transcription task, each subject was able to listen to one sound file twice in the predetermined randomized order on their own pace. In other words, the intervals between the play of each speech excerpt were regulated by each subject although they were not able to stop and restart the sound files in the middle of playing. Each sound file was presented after a beeping sound so that the listeners were able to be informed when the actual sound files would begin.
2.3 Distribution of prosodic scores
After collecting prosodic transcriptions by multiple ordinary listeners, prosody annotations from 3 subjects who are not native speakers of American English or bilinguals or failed to follow the instructions were excluded. Pooling prosody annotations from all the subjects, each word in the speech excerpts were assigned a probabilistic prominence (P-score) and boundary (B-score) scores depending on the number of listeners who hear the word as prominent or as followed by a boundary as shown in Fig. 1. For example, if all the subjects marked a word as prominent, then its P-score is 1. If a half of the listeners marked a word as followed by a boundary, its B-score is 0.5. In Fig. 1, the first word, ‘I’ is heard as prominent by around 35% of ordinary listeners but no listener hears that word as followed by a prosodic boundary.
Figure 1. The distribution of probabilistic prominence scores (P-scores, solid line) and boundary scores (B-scores,
dotted line) for each word in a sample utterance from the excerpts of Speaker 26
2.4 Reliability Test
The reliability of prosody annotations by a group of ordinary listeners was then evaluated by using Fleiss’ kappa statistics.
Fleiss’ kappa multi-transcribers’ agreement scores have advantages over Cohen’s pairwise agreement scores, which have often been employed in the reliability test of prosody transcription. First, a Cohen’s kappa only allows to compare pairwise agreement scores, and therefore, if there are more than 2 transcribers, then it is difficult to evaluate the agreement scores among all transcribers.
Second, Cohen’s kappa does not allow to statistically evaluate transcribers’ agreement scores. In most prior studies, therefore, the average pairwise agreement scores were reported to assess the overall transcribers’ agreement. On the other hand, a Fleiss’
kappa can be employed to evaluate the reliability of more than 2 transcribers, which further allows to statistically compare the agreement scores among multiple transcribers. In this study, Fleiss’ multi-transcribers’ kappa agreement scores are used to assess the reliability of ordinary listeners’ transcription because 97 listeners transcribed the speech excerpts. Fleiss’ multi-transcribers’
kappa agreement scores (κ) range from 0.346 to 0.448 for prosodic prominence and from 0.532 to 0.640 for prosodic boundary, and their corresponding z-statistics range from 21.5 to 33.4 for prosodic prominence and from 26.8 to 44.3 for prosodic boundary. It is shown that all the kappa statistics are much above a chance with the 99% confidence interval (z = 2.33, p < 0.001).
These findings suggest that, first, ordinary listeners’ prosody annotation is not arbitrary but systematic and consistent, second, ordinary listeners generally agree with the locations of prosodic prominence and boundary, and third, ordinary listeners agree with the locations of prosodic boundary more consistently than those
of prosodic prominence. More thorough discussion about the reliability of RPT will be reported in a separate paper.
3. Acoustic Measurements
Once confirming that ordinary listeners’ prosody annotation is consistent and reliable, I investigated how prosodic prominence is related to the acoustic realization of the target segments. The following acoustic measures were taken from the 3,275 lexically stressed vowels, which are metrically the most prominent segment in a word: (1) vowel duration from the onset to the offset of the lexically stressed vowels, (2) overall RMS intensity in Pascal (later converted to dB), (3) local F0 maximum, and (4) bandpass filtered intensities using Hanning bandpass filters (0-500, 500-1000, 1000-2000, and 2000-4000Hz). The first and second formants of 10 monophthongs were also extracted from the vowel midpoints with two different ceiling frequencies (5000 Hz for male speakers and 5500 Hz for female speakers). The extracted acoustic measures except F0 measures were then normalized by phone within each speaker in order to allow to perform statistical analyses between P-scores and the acoustic measures across vowels. The F0 measures were normalized within a 400-ms time window centered on the midpoint of each vowel.
4. Results
The present study mainly discusses the relationship between P-scores and the measures of acoustic parameters even if both P- and B-scores were obtained in the transcription tasks. The relationship between B-scores and the acoustic measures will later be discussed in a separate paper.
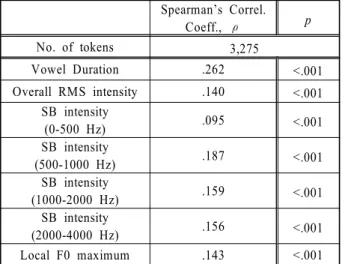
Table 1 summarizes the results from Spearman’s non-parametric correlation analyses between P-scores and the normalized acoustic measures from 3,275 lexically stressed vowels, including vowel duration, overall intensity, subband intensities, and local F0 maximum. Spearman’s non-parametric correlation analysis was chosen because P-scores are highly negatively skewed (many non-prominent words and few prominent words) and Spearman’s correlation analysis does not require the variables (P-scores and the acoustic measures) to be normally distributed.
As seen in Table 1, all the acoustic measures are positively correlated with P-scores. Their correlation coefficients (ρ) range from 0.095 to 0.262, which are all statistically significant within the 99% confidence interval, in general. Looking closely,
Spearman’s Correl.
Coeff., ρ p
No. of tokens 3,275
Vowel Duration .262 <.001
Overall RMS intensity .140 <.001 SB intensity
(0-500 Hz) .095 <.001
SB intensity
(500-1000 Hz) .187 <.001
SB intensity
(1000-2000 Hz) .159 <.001
SB intensity
(2000-4000 Hz) .156 <.001
Local F0 maximum .143 <.001
Vowels F1 F2
i .115* .188**
ɪ .190** -.014
ɛ .281** -.133**
æ .226** -.073
ɑ .106 -.185**
ʌ .357** -.147**
ɝ .331** -.138
ɔ .280** -.161**
ʋ .304** -.001
u .146* -.164*
however, the correlation coefficient of P-score with vowel duration is the largest and with subband intensity in 0-500 Hz is the smallest. The other acoustic measures are moderately correlated with P-scores, compared to vowel duration.
Table 1. The summary of Spearman’s non-parametric correlation analyses between P-scores and the normalized acoustic measures
Table 2. The distribution of Spearman’s non-parametric correlation coefficients of P-scores with F1s and F2s
measured at the vowel midpoint
*/**: The significant correlations are marked within a 95% (*) and 99% (**) confidence interval.
The correlation coefficients of P-scores with the first and second formants of 10 monophthongs are summarized in a separate table (Table 2), because the expected direction of correlation between P-scores and F1s and F2s varies depending on vowel identity according to Hyperarticulation Hypothesis. As seen, the results showed that prosodic prominence influences the phonetic realization of the formant structures. Firstly, Spearman’s non-parametric correlations of P-scores with F1s of monophthongs are significant. Looking closely, F1s of all monophthongs except the low vowel, /ɑ/, are significantly correlated with P-scores, and all their correlation coefficients are positive. Their correlation coefficients range from 0.115 to 0.357. Secondly, the second
formants of 6 monophthongs including /i, ɛ, ɑ, ʌ, ɔ, u/ are also correlated with P-scores. F2s of the front high vowel, /i/, are positively correlated with P-scores, and the other vowels including /ɛ, ɑ, ʌ, ɔ, u/ show significant negative correlations with P-scores. Their correlation coefficients range from -0.185 to 0.188. The second formants of the following three vowels /ɪ, æ, ɝ/ do not show a significant correlation with P-scores. Comparing the correlation of P-scores and F1s with that of P-scores and F2s, the larger number of vowels shows a significant correlation with F1s than with F2s, and the correlation coefficients with F1s are generally larger than those with F2s.
5. Discussion
The present study examined whether and how prosodic prominence as determined by ordinary listeners influences the phonetic modulation of acoustic parameters in everyday conversational speech. In other words, attempting to model everyday speech communication, this study looks at the influence of prosodic prominence on the phonetic realization of the acoustic parameters (1) in everyday spontaneous conversational speech and (2) as perceived by ordinary listeners.
The results of Spearman’s non-parametric correlation analyses between P-scores and the acoustic measures demonstrate that P-scores are positively correlated with the acoustic measures including vowel duration, overall intensity, local F0 maximum, and subband intensities in 0-500, 500-1000, 1000-2000, and 2000-4000 Hz. Consistent with prior studies, the findings from the present study suggest that prosodic prominence affects the phonetic implementation of the acoustic parameters in everyday conversational speech of American English. In other words, when a word bears prosodic prominence, the lexically stressed vowels of the word are temporally lengthened, increased in total energy and energy in each subband region, and raised in pitch.
First of all, this study demonstrates that, although prosodic prominence influences changes in all the acoustic parameters, vowel duration is the most strongly correlated with P-scores. This finding suggests that vowel duration is a primary correlate of prosodic prominence, and increased vowel duration is the strongest cue for prosodic prominence in conversational speech of American English.
However, the present study also demonstrates some findings that are inconsistent with prior studies’. The finding that the correlation of P-scores with F0 maximum is relatively weak, compared to the correlations of P-scores with other acoustic
measures such as vowel duration and subband intensities in mid- and high-frequency regions suggests that the local peak of F0 may not be a primary correlate of prosodic prominence and does not cue for prosodic prominence. That is, this study suggests that, although changes in F0 are influenced by the presence or absence of prosodic prominence, they are not a major maneuver of prosodic prominence, and are less important in the perception of prosodic prominence as claimed by Kochanski and his colleagues (2005 and 2006).
This study also shows that bandpass filtered intensities in mid and high frequency regions (500-4000 Hz), where most of vowels have their first three formants, are more strongly correlated with P-scores than that in low frequency region (0-500 Hz), although the overall intensity is also positively correlated with P-scores.
This finding suggests that when a word is under prosodic prominence, the energy in mid- and high frequency regions more greatly increases than the energy in other frequency bands.
Prosodic prominence also influences the formant structures of the lexically stressed vowels. When the lexically stressed monophthongs are prominent, the first resonant frequencies of the vowel increase regardless of vowel identity, but the second resonant frequencies of the front vowel are more front and of non-front vowels are more back. That is to say, under prosodic prominence, in height dimension, all the vowels except the low vowel, /ɑ/ are more lowered and in the front/back dimension, the front corner vowel, /i/ is more front, while other vowels tend to be more back. These findings are mostly consistent with Sonority Expansion Hypothesis, but not with Hyperarticulation Hypothesis in height dimension. In front/back dimension, the findings from the present study demonstrate that all the vowels are more hyperarticulated when they are prominent. On the basis of the findings in height dimension, where two hypotheses provide conflict predictions, the present study shows that, when perceived as prominent, lexically stressed vowels increase their sonority but hyperarticulated only when hyperarticulation does not interfere with sonority expansion in everyday spontaneous conversational speech of American English.
Taking into account the findings that prosodic prominence increases bandpass filtered energies of the vowels, especially, in formant frequency regions and vowels’ enhanced sonority as well as hyperarticulation together, the present study demonstrates that compared to their non-prominent counterparts, prominent vowels tend to have enhanced the formant structures both in frequency and energy dimension, which may enhance their auditorial perceptibility in speech communication.
Findings from the present study show that prosodic prominence influences the phonetic realization of all the acoustic measures in everyday conversational speech of American English. More specifically, prosodic prominence enhances the phonetic characteristics of the acoustic measures in all phonetic dimensions. The present study also shows that ordinary listeners’
perception of prosodic prominence is guided by such phonetic modulations in conversational speech.
On the other hand, the results show that the absolute values of the coefficients (ρ) of Spearman’s non-parametric correlation analyses between P-scores and the acoustic measures are relatively small, ranging from 0.095 to 0.357. Although this study indicates acoustic variation induced from prosodic prominence and its role in the perception of prosody, the present study also shows that the degree of prosodic influence vary depending on the types of the acoustic parameters, and there is no single dominant acoustic parameter that cues for prosodic prominence. This suggests that ordinary listeners must attend to small acoustic variation, and possibly integrate the gathered acoustic information to perceive prosodic prominence.
However, the reason that this study indicates only the small amount of acoustic variation associated with prosodic prominence might result from the nature of speech materials: corpus materials always have higher degree of freedom than controlled, laboratory materials. Therefore, there are some issues reserved for further discussion. In the present study, the possible effects of other linguistic and non-linguistic factors on listeners’ perception of prosody were not excluded. In my prior studies, it was shown that syntactic structure (Cole, Mo, and Baek, 2010) and word token frequency and word frequency in discourse (Cole, Mo, and Hasegawa-Johnson, 2010) affect listeners’ prosody perception.
For example, a word with high token frequency is likely to be heard as non-prominent and a word with low token frequency, as prominent. In addition to syntactic structure and word- and discourse-frequency, there are other factors that possibly interact with the phonetic realization of prosodic prominence or its perception. For example, Mo (2010) and Greenberg, Chang, and Hitchcock (2001) showed that vowel identity affects the tendency of vowels’ accentedness. However, it is very difficult to control all other factors and only to investigate a factor of interest due to data sparseness. There are two different approaches to take into account the complicated nature of spontaneous, conversational speech. First, it is very important to investigate the multi-faceted relationship between prosodic prominence, acoustic measures, and other linguistic and non-linguistic factors by employing advanced
statistical analyses e.g. regression and factor analysis (Mo, 2010).
Or in order to control various factors and to model the phonetic realization of prosody in everyday speech communication, it is required to obtain a very large scale of prosodically labeled corpus data.
6. Conclusion
The present study demonstrates that prosodic prominence influences the phonetic realization of acoustic parameters in everyday conversational speech of American English and ordinary listeners are sensitive to the phonetic modulation in speech communication. In other words, under prosodic prominence, all acoustic characteristics are phonetically enhanced, and ordinary listeners rely on the phonetic variation in the perception of prosodic prominence. However, this study also shows that the acoustic variation induced from prosodic prominence is not large and there is no single acoustic correlate of prosodic prominence in everyday conversational speech of American English, and therefore, listeners must be able to recover prosodic structures as intended by a speaker, attending to small acoustic variation in prosody perception.
Acknowledgment
This research is supported by NSF grants IIS 07-03624 and IIS-04-14117 to Jennifer Cole and Mark Hasegawa-Johnson, University of Illinois at Urbana-Champaign and by a SLCL fellowship, University of Illinois to Yoonsook Mo. The author would like to thank the members of Prosody-ASR group for their comments.
References
Beckman, M. E. (1986). Stress and non-stress, Dordrecht, The Netherlands: Foris Publications.
Beckman, M. E., Edwards, J., and Fletcher, J. (1992). “Prosodic structure and tempo in a sonority model of articulatory dynamics”. In Docherty, G. J. and Ladd, D. R. (Eds.), Papers in Laboratory Phonology II: Gesture, segment, prosody. Cambridge:
Cambridge University Press. pp. 68-86.
Cho, T. (2005). “Prosodic strengthening and featural enhancement:
Evidence from acoustic and articulatory realizations of /a, i/ in English”, Journal of the Acoustical Society of America, Vol. 117,
No. 6, pp. 3867-3878.
Cole, J., Mo, Y., Baek, S. (2010). “The role of syntactic structure in guiding prosody perception with ordinary listeners and everyday speech”, Language and Cognitive Processes, Vol. 25, No. 7-9, pp. 1141-1177.
Cole, J., Mo, Y., Hasegawa-Johnson, M. (2010). “Signal-based and expectation-based factors in the perception of prosodic prominence”, Laboratory Phonology, Vol. 1, No. 2, pp. 425-452.
de Jong, K. J. (1995). “The supraglottal articulation of prominence in English”, Journal of the Acoustical Society of America, Vol.
97, No. 1, pp. 497-504.
Erickson, D. (2002). “Articulation of extreme formant patterns for emphasized vowels”, Phonetica, Vol. 59, pp. 134-149.
Fant, G., Kruchenberg, A. (1994). “Notes on stress and word accent in Swedish”, STL-QPSR, Vol. 2-3. pp.125-144.
Greenberg, S., Chang, S., Hitchcock, L. (2001). “The relation between stress accent and vocalic identity in spontaneous American English discourse”, In the Proceedings of Prosody-2001. Red Bank, NJ, USA. pp. 51-16.
Gussenhoven, C., Repp, B. H., Rietveld, A., Rump, H. H., Terken, J. (1997). “The perceptual prominence of fundamental frequency peaks”, Journal of the Acoustical Society of America, Vol. 102, No. 5, pp. 3009-3022.
Heldner, M., Strangert, E. (1997). “To what extent I perceived focus determined by F0-cues?”, In the Proceedings of the 8th International Congress of Phonetic Sciences. Stockholm, Sweden. pp. 13-19.
Kochanski, G. (2006). “Prosody beyond fundamental frequency”. In Sudhoff, S., Lenertova, D., Meyer, R., Pappert, S., Augursky, P., Mleinek, I., Richter, N., Schlieber, J. (Eds.), Methods in empirical prosody research. New York: De Gruyter.
http://kochanski.org/gpk/papers/2005/2005BeyondF0.pdf
Kochanski, G., Grabe, E., Coleman, J., Rosner, B. (2005).
“Loudness predicts prominence: fundamental frequency lends little”, Journal of the Acoustical Society of America, Vol. 118, No. 2, pp. 1038-1054.
Ladd, D. R. (1996). Intonational Phonlogy. Cambridge: Cambridge University Press.
Mo, Y. (2010). “Prosody production and perception with conversational speech”. Ph.D. Dissertation. University of Illinois at Urbana-Champaign, Urbana, Illinois, USA.
Pierrehumbert, J. (1980). “The phonology and phonetics of English intonation”. Ph. D. Dissertation. MIT, Boston, Massachusetts, USA.
Pitt, M. A., Dilley, L., Johnson, K., Kiesling, S., Raymond, W.,
Hume, E., Fossler-Lussier, E. (2007). Buckeye Corpus of Conversational Speech (2nd release). [www.buckeyecorpus.osu.
edu] Columbus, OH: Department of Psychology, Ohio State University (Distributor).
Slujiter, A., van Hueven, V. J. (1995). “Effects of focus distribution, pitch accent, and lexical stress on the temporal organization of syllables in Dutch”, Phonetica, Vol. 52, pp. 71-89.
Turk, A. E., White, L. (1999). “Structural influences on accentual lengthening in English”, Journal of Phonetics, Vol. 27, pp.
171-201.
• Mo, Yoonsook
School of General Studies, GIST College Gwangju Institute of Science and Technology 261 Cheomdan-Gwagiro (Oryong-dong), Buk-gu Gwangju 500-712
Tel: 062-715-3653 Fax: 062-715-2300 Email: [email protected]
Areas of interest: phonetics, prosody, corpus study, L1 and L2 phonological development
Ph. D. Linguistics, University of Illinois at Urbana-Champaign