- 48 -
Identification of Palustrine Wetlands in Paldang Reservoir Using Spectral Mixture Analysis of Multi-temporal Landsat Imagery
Kim Sang-Wook1) and Park Chong-Hwa2)
1) Land Research Institute, Korea Land Corporation, 2)GSES, Seoul National University.
다중시기 위성영상의 분광혼합화소분석에 의한 팔당 상수원보호구역의 소택형 습지 판별
김상욱1)․박종화2)
1)한국토지공사 토지연구원․2)서울대학교 환경대학원
ABSTRACT
본 연구는 중․저해상도 위성영상을 이용하여 하천주변 습지를 판별해내는 보다 개선된 기 법을 개발해 내는데 그 목적이 있다. 중․저해상도 위성영상의 하나의 화소는 일반적으로 하 나의 동질한 물체의 분광반사값을 나타내기보다는 다양한 분광값을 가진 물체들의 대표값으 로 나타나게 된다. 특히 본 연구에서는 식생, 수문 및 토양요소의 혼합체인 습지의 판별을 위 해서, 하나의 화소가 하나의 물체를 대표함을 전제로 하는 기존의 분석방법 보다는, 혼합화소 (mixed pixel)를 대상지의 토지피복을 가장 잘 반영하는 순수한 화소값(endmember)들로 분해함 으로써 보다 정확한 판별 및 분류를 가능케 하고자 하였다. 이를 위하여 일반적으로 극세분광 위성영상의 분석에 활용되는 기법인 분광혼합화소분석(Spectral Mixture Analysis)을 이용하였 는데, 습지 각 화소의 식생, 수문 및 토양요소의 혼합정도를 분해한 후, 이들의 분할영상 (fraction images)을 추출해내고 이를 분석에 이용하였다. 팔당상수원보호구역의 소택형 습지를 대상으로 봄․가을의 Landsat 영상에 대한 분석을 수행하였으며, 도출된 결과는 다음과 같다.
첫째, 봄․가을 각각의 영상에 대하여 4개씩 endmember를 선정하였으며, 분할영상과 원자료 각각에 대하여 습지판별을 수행한 결과, 가을영상에 대하여 분할영상을 이용한 방법의 소택 형 습지 판별 정확도가 가장 높은 값을 보여주었다(생산자 정확도:83.3%, 사용자 정확도:
86.5%). 둘째, 소택형 습지로 판별된 지역만을 대상으로 보다 세분화된 분류가 가능한 지 알 아보기 위하여 소택형 습지로 판별된 지역의 영상에 대해 ISODATA 무감독분류를 수행한 결 과 2개의 클러스터로 대별되었다. 현장조사, 기존 연구의 수심자료 및 식생에 대한 조사를 바 탕으로 위의 2개의 클러스터를 조사한 결과, 수문조건에 따른 분류인 아계(subsystem) 단계의
‘영구적 침수형 소택형 습지’와 ‘계절적 침수형 소택형 습지’로 분류할 수 있었다.
Key Words:습지 판별, 분광혼합화소분석, 소택형 습지 분류, 생물계절주기, 습지 목록화.
Ⅰ. INTRODUCTION
For a sustainable development of a watershed, building accurate inventories and monitoring of wetlands at risk are very important. Studies about inland wetlands identification have adopted existing techniques like using vegetation indices such as NDVI(Patience et al, 1993; Ahl et al, 1995; Tamura et al, 1998; Jeon et al, 2000; Loveland 2000; Kim and Park 2003) and band combination(Koo 2002). For classification of wetlands from other land-covers, conventional routines like ISODATA and maximum likelihood classifier(MLC) were used((Jensen et al, 1997; Lu et al, 2002; Tian et al, 2003; Ju 2003) adopting image fusion technique(Jeon et al. 2000).
Wetland studies using SMA technique mostly focused on the vegetation factor of the land-cover(Blaricom et al, 1996; Williams et al, 1999; Oki et al, 2002), and there is little research to take into account soil and water factors as well as vegetation for identi- fication and classification of wetlands. However, the accuracy of identification and classification of inland wetlands among many land-cover classification levels was doubtful and often poorly classified, because pixels of wetland are the mixture of the heterogeneity of features of vegetation, water and soil and these mixed pixels in remotely sensed data are one of the main error sources resulting in poor classification accuracy when raw satellite imagery are only used (Elmore et al. 2000).
The main objectives of this study are 1) to inves- tigate image classification methods suitable for the identification of palustrine distribution accurately with Landsat Imagery. It is possible to obtain better results if the mixed pixels of wetlands are decomposed into different proportions of selected components and linear Spectral Mixture Analysis(SMA) is one of the most often used methods in handling the spectral mixture problem. This study aims to achieve an appropriate processing routine of SMA to identify and classify palustrine wetlands. And 2) to investigate
appropriate identification methods of palustrine wetlands based on phenological characteristics in Paldang Reservoir using multi-temporal Landsat imagery. The temporal factor is not only the plant's phenological cycle but also soil moisture, biomass and understory materials present. This study was conducted to determine the optimum time of a year to identify and classify palustrine wetlands using multi-temporal remotely sensed data.
Ⅱ. STUDY AREA AND DATA USED
1. Study Area
Paldang reservoir and catchment protection area and vicinity areas of four km buffers from the main river channels of the Hangang, Namhangang, Bukhangang and Kyungancheon River(Paldang Reservoir), were designated as the focal area for this study. The dominant flora in Paldang area are cattail(Typha angustata) community, reed(Phragmites communis) community, water chestnut(Trapa japonica) community, and so on. The dominant fauna are spot-billed duck(Anas poecilorhyncha), Coot(Fulica atra) and Grey Heron(Ardea cinerea)(Kyunggi Provincial Museum 2002). The mean water level of Kyungancheon River was stable at 34.0m above mean sea level and fluctuating within 30cm during most of the year in 2002.(HRFCO 2003). And these minute water level changes mean that the temporary submerged zone along the shoreline of Paldang Reservoir might be very narrow and can hardly be detected using low resolution satellite imagery. Therefore, the submerged zone changing from upland to submerged area in the rainy season due to the water level changes were disregarded in this study.
Phenological cycle of vegetation is very important when attempting to identify different vegetation types or to extract useful vegetation biophysical information from remotely sensed data(Jensen 2000). The possi- bility of accurate identification of palustrine wetlands may be increased by comparing seasonal characteristics
JUN Development
water JAN 0.5 (m) 1
FEB MAR APR MAY
Tillering Initial
Growth
Harvest
JUL AUG SEP OCT
100% Ground Cover
Maturity
NOV
JAN FEB MAR APR MAY JUN JUL AUG SEP OCT NOV
water (m)
2
1
Dormant Initial
Growth
Development Maturity Dormant
100% Ground Cover
Dent
Figure 1. The phenological characteristics of paddy(Oryza sativa) and cattail(Typha angustata) in Paldang Reservoir.
This data were obtained from field works in this study, and Rural Development Administration.
of spring and fall seasons. Phenologically in May, cattails grow to maturity but rice is transplanted to paddy fields. In September, rice and cattails are in maturity but the understory background material of paddy fields is wet soil, while the background of wetlands is saturated soil. Phenological cycles of cattail(Typha angustata) and rice (Oryza sativa) were investigated and presented through the field evaluation(Figure 1). To collect the changes, the heights and greenness of dominant vegetation species and their hydrologic conditions were observed every month from July 2002 through October 2003.
Through the phenological cycles of two dominant species, it may be possible to discriminate between cattails and rice field. If a late May image is selected, cattails have a greater canopy closure than rice field. And In fall, a late September or October image can differentiate the two species, because their canopy closures are similar but their background materials are different.
2. Field Survey
Through the field survey, ground truth data for the validation of the methodology were collected.
Basically Palustrine distributions were investigated from ‘Land-Cover Maps'(LCMs)(1/25,000) and
‘Land Environment Maps'(LEMs)(1/25,000). Among 49 palustrine wetlands in Paldang Reservoir, 31
palustrines were identified based on the LCMs and LEMs and Digital Topographic Maps', and 18 palustrines omitted from those maps were detected from the field survey, which were registered with GPS(Trimble Pathfinder) device to allow integration with spatial data in GIS and image processing systems. The appearance of obligate and facultative wetland vegetation was the main indicator for palustrine identification in the field survey. To overcome the inaccessibility to some of palustrine wetlands and mapping exact location of them, palustrine locations were checked directly by loading the maps onto PDA connected to the GPS receiver. Spatial data were processed and integrated as GIS layers using ArcView v3.2.
Ⅲ. METHODOLOGY
1. SMA for Palustrine Identification
SMA is a new technique that in theory would allow you to determine the fraction of each surface type in a pixel. In order to unmix a pixel, all pure pixels (endmembers) in an image must be known and their reflectance spectra should be different from each other(Hill et al, 1995; Roberts et al, 1998). It assumes that the spectrum measured by a sensor is a linear combination of the spectra of all components within the pixel(Roberts et al, 1998; Ustin et al,
1996).
Fitting a linear SMA involves two main steps:
(a) endmember identification and (b) abundance estimation. If we know how many distinctive sub- stances are mixed in a pixel and how much are the proportions of pure spectra for selected land- cover materials, often referred to as endmembers, we can calculate the abundance of endmembers within a pixel.
In the linear SMA process, spectral endmembers for palustrine identification in Paldang Reservoir, were driven from pure features in the imagery, and the tasseled cap plane was mainly utilized. This multispectral space of red band and near infrared bands have very distinctive three vertices, which make it easy to determine endmembers from imagery, and endmembers from these three vertices shows exact characteristics of three components of wetlands, such as green vegetation(GV), soil and water.
The next step in SMA is to estimate, for each pixel, the abundance of each endmember contained within it by applying a linear mixing equation (Adams et al, 1993; ENVI, 2002). The weight of each endmember spectrum(abundance) is proportional to the fraction of the pixel area covered by the endmember.
If there are L spectral bands, the spectrum of the pixel and the spectra of the endmembers can be represented by L-dimensional vectors(Manolakis et al. 2001). Therefore, the general equation for mixing by area is given by
x= ∑kM= 1a ksk+w ···(1) where
xspectrum of the mixed pixel sk spectra of the endmembers ak abundances of the endmembers M number of endmembers
wresiduals
Physical considerations dictate the following constraints.
ak≥0 (nonnegativity constraint)
∑M
k= 1= 1 (additivity constraint)
To develope high-quality fraction images, GV, bright soil, dark soil and water endmember were identified for the spring image and Green vegetation tree(GVt), Green Vegetation herbaceous(GVh), soil and water endmember were identified for the fall imagery respectively, of empirical trial and errors to compare the RMS error results of each SMA abundance estimation. These endmembers were deter- mined through the consideration of phenological, land-cover and land-use characteristics of Paldang Reservoir.
2. Comparison of SMA results
To evaluate SMA is an effective processing routine or not, and which season is appropriate to detect palustrine wetlands, four different processing methods were tested and their identification results using a MLC were compared. MLC results between SMA routine and raw Landsat 6 bands were compared to detect identification accuracy. The following is four different methods to compare the identification accuracy.
1) MRS:MLC using raw 6-band spring(May) TM image
2) MSS:MLC using constrained fraction images on 6-band Spring(May) TM image
3) MRF:MLC using raw 6-band fall(September) ETM+image
4) MSF:MLC using constrained fraction images on 6-band fall(September) ETM+ image
3. Palustrine type classification
When the most optimal procedure was selected through the comparison of the results of 4 different identification methods, classification of palustrine types was conducted to subdivide palustrines into perennial and seasonal wetlands in subsystem level.
ISODATA method among Unsupervised classification techniques were utilized to classify palustrine types.
For the ground truth data, palustrine wetland boundaries were delineated from the on-screen digitizing of the SPOT 5(November 17, 2002) image acquired in late-fall. The shoreline from the digital topographic maps(1/25,000) and site visits were supplemented to guarantee the moderate digitizing accuracy for the hydrophyte mapping using the high spatial resolution image(SPOT 5).
Ⅳ. RESULTS AND DISCUSSIONS 1. Fraction values of typical land-use classes
in Paldang Reservoir
Fraction characteristics of some typical land-use classes in the study area were illustrated in figure 2. In the GVt fraction, forest has significantly higher values. In the GVh fraction, paddy, palustrine and forest land-covers have significant difference in the spectral responses between the various endmembers.
In the soil fraction, bare-land including built-up area and paved roads, has highest value. In the water fraction, palustrine wetlands have higher value than forest and paddy, from which we can infer palustrine vegetation is affected by the background material of water. This figure indicates that fraction values from
Fraction Values of Typical Land-use Classes
-0.2 0 0.2 0.4 0.6 0.8 1 1.2 1.4
GVt GVh Soil Water
Endmembers
Values
Mean : Forest Mean : Paddy Mean : Barren Mean : Palustrine Mean : Waterbody
Figure 2. Fraction values of typical land-use classes of fall image(endmember 1:GVt, endmember 2:GVh, endmember 3:Soil, endmember 4:Water).
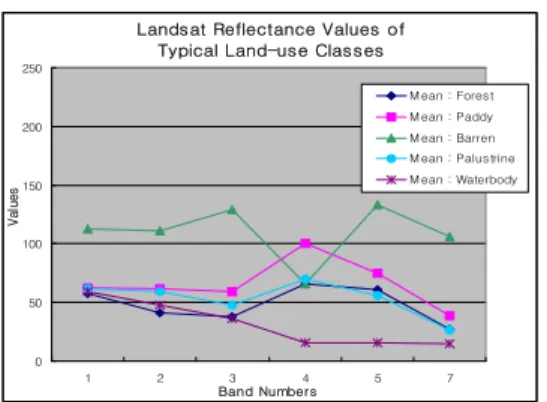
Landsat Reflectance Values of Typical Land-use Classes
0 50 100 150 200 250
1 2 3 4 5 7
Band Numbers
Values
M ean : Forest M ean : Paddy M ean : Barren M ean : Palustrine M ean : Waterbody
Figure 3. Landsat reflectance values of typical land- use classes of fall image.
the fall image have very distinctive characteristics, which make it easy to discriminate land-use classes.
On the other hand, figure 3 shows reflectance values of Landsat 6 bands to the same land-use classes. Spectral characteristics of forest, paddy and palustrine are very similar, which means it's so difficult to discriminate land-uses, especially vegeta- tion types, using raw bands of Landsat imagery.
2. Results of palustrine Identification
SMA adopting sub-pixel classification algorithm improved palustrine identification and this routine will be helpful to detect palustrine wetlands in regional scale. MLC method using fractions of a fall image(MSF) produced relatively higher producer's and user's accuracy of 83.3 and 86.5 percent, respectively.
Table 1. Comparison of Identification Accuracy from four different methods.
Error Matrix Resulting
Identification Accuracy (%) Spring(May 21, '99) Fall(Sep. 23, '01)
MRS MSS MRF MSF
Producer's
Accuracy 40.7 42.6 71.7 83.3
User's
Accuracy 42.1 44.1 82.7 86.5
Phenologically in Paldang Reservoir, a fall image is appropriate to identify palustrine wetlands from various land-covers. In spring time, wetland condition being in initial growth and development, make it difficult to identify exact palustrine wetland areas and similar phenological cycle of wetlands and forest growing to mature, make it difficult to identify palustrine wetlands from forests.
3. Results of palustrine Classification
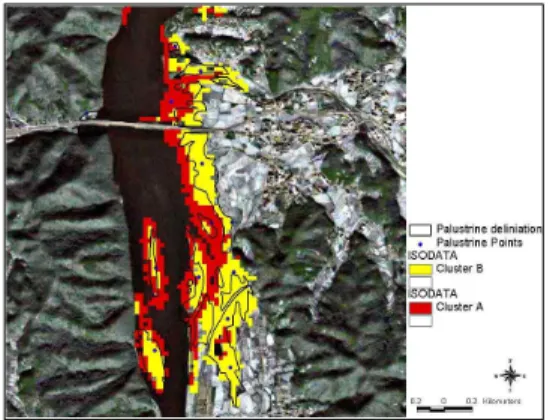
Type classification using Identified palustrine wetlands showed meaningful results in thesubsystem level of the classification system. ISODATA unsupervised classifier subdivided the MSF result into two distinctive clusters. Topographically one cluster(the dark colored one:Cluster A) was dis- tributed in the aquatic bed and the other cluster(the bright colored one:Cluster B) was distributed in the submerged zone and edges of the Paldang Reservoir (Figure 4). To clarify whether the cluster A is deep water or perennial palustrine wetlands, the results of Lee et al.(2002), were utilized. The cluster B was overlaid with palustrine location points and the palustrine boundary layer obtained from the SPOT 5 image. In Kwangdong-ri area, the digitized palustrine polygons were correspond to the cluster B(bright colored one) along the margin of the Paldang Reservoir(Figure 4).
Figure 4. Cluster A and B were overlayed with palustrine points and boundaries acquired from the field survey.
Ⅴ. CONCLUSIONS
This study tested the use of SMA in identification of palustrine wetlands in Paldang Reservoir. Several endmember models and identification methods were compared for their success in determining the spatial extent of the palustrine wetlands.
This study has indicated that SMA is an enhanced routine for identification of palustrine wetlands, and fall Landsat imagery are more appropriate to detect palustrine wetlands than that of spring imagery in Paldang Reservoir.
Based on the results, the following conclusions can be achieved:
1. SMA adopting sub-pixel classification algorithm improved palustrine identification and this routine will be helpful to detect palustrine wetlands in regional scale. MLC method using fractions of a fall image produced the highest producer's and user's accuracy of 83.3 and 86.5 percent, respectively.
2. For developing high-quality fraction images, four-endmember model of Green vegetation tree (GVt), Green Vegetation herbaceous(GVh), soil and water, for fall image, were selected using tasseled cap scatter-plot, which represents the characteristics of vegetation, soil and water which are three main indicators of wetlands. Interactive selection of endmember bundles from the tasseled cap scatter- plot and validation of the homogeneity and purity of each endmember pixel through the field visits and the SPOT 5 high spatial image successfully identified palustrine wetlands in Paldang Reservoir.
3. To appreciate the dynamics of the palustrine ecosystem, it is necessary to take into account plant's phenological cycle but also soil moisture, biomass and understory materials present through time.
Phenologically in Paldang Reservoir, a fall image is appropriate to identify palustrine wetlands from various land-covers.
4. Type classification using Identified palustrine wetlands shows meaningful results in the subsystem
levelof the classification system. ISODATA classifier subdivided the MSF results into two distinctive clusters. And through the boundary overlay and water depth investigations, it can be assumed that one cluster is the seasonal palustrine wetlands growing above the surface of the water and the other one is perennial palustrine, growing beneath the water surface.
While sub-pixel mapping in this study may appear as a promising technique, limitations to its usefulness undoubtedly exist. For the type classifica- tion of palustrine wetlands in class level, finer spatial and spectral resolution imagery should be adopted. The availability of high spatial resolution imagery to SMA technique make it easy to extract wetland information in plant community mapping level. In addition, higher radiometric resolution may positively influence to detect, classify and delineate wetland plant communities automatically. The SMA routine using hyperspectral imagery can be an enhanced tool to classify and extract plant com- munities effectively and exactly.
Despite the limitations, this technique shows promise as useful tools for identifying and monitoring the status of palustrine wetlands in Paldang Reservoir.
Through the technique, detected palustrine wetlands in regional scale are especially applicable as base maps for mapping and delineating wetlands to construct wetland inventory.
REFERENCES
Adams J. B., M. O. Smith. and A. R. Gillespie.
1993. Imaging spectroscopy:Interpretation based on spectral mixture analysis. In C. M.
Pieters & P. Englert(Eds.), Remote geochemical analysis:Elemental and mineralogical com- position, New York:Cambridge University Press, pp.145-166.
Ahl D., J. Spruce., K. Shepardson., R. Arrieta and B. Davis. 1995. Proceedings of national
interagency workshop on wetlands:Tech- nology Advances for Wetlands science.
Blaricom D. V., Basil Savitsky., S. P. Petitgout., S.
M. Jones., Mark A. Karaska and Robert L.
Huguenin. 1996. Classification of wetland gradient using subpixel detection of overstory indicator species in, TM imagery, Proceedings of the Southern Forested Wetlands Ecology and Management Conference.
Elmore, A. J., J. F. Mustard., S. J. Manning. and D. B. Lobell. 2000. Quantifying vegetation change in semiarid environments:Precision and accuracy of spectral mixture analysis and the normalized difference vegetation Index, Remote Sensing of Environment, 73 (1):87-102.
ENVI. 2002. ENVI Tutorial, Research Systems, Inc.
pp.359-456.
Hill J., J. Megier. and W. Mehl. 1995. Land degra- dation, soil erosion, and desertification monitoring in Mediterranean ecosystems.
Remote Sensing Reviews, 12, 1-7-130.
HRFCO. 2003. Annual report of Han river water level, MOCT.
Jensen J. R., X. Huang. and H. E. Mackey. 1997.
Remote sensing of successional changes in wetland vegetation in monitored during a four-Year drawdown of a former cooling lake, Applied Geographic Studies, 1(1):
31-44.
Jeon S. W., J. K. Cho. and W. C. Jung. 2000. Remote Sensing technique for mapping ecological naturality, KEI, pp.25-38.(in Korean) Ju W. H. 2003. A Comparative study on the Tumen
River downstream and eastern DMZ wetland classification and distribution characteristics, Doctor's Thesis. Department of Landscape Architecture, Seoul National University. pp.
68-89.(in Korean)
Kim S. W. and C. H. Park. 2003. Riparian iden- tification using multi-temporal vegetation
indices, Proceedings of KSRS, Spring, 170- 175.(in Korean)
Koo B. H. 2002. A study on the classification and mapping methods of wetlands in Korea, Doctor's Thesis. Department of Landscape Architecture, Seoul National University, pp.
10-23, 30-58.(in Korean)
Kyunggi Provincial Museum. 2002. Han river, Sci- entific Series of Kyunggi Provincail Museum.
(in Korean).
Lee K. W., M. K. Kim., C. Y. Ahn. and W. K. Sim.
2002. Characteristics of vegetation distribution with water depth and crossing slope at the shoreline of Reservoir Paldang, Journal of the Korea Society for Environmental Restora- tion and Revegetation Technology, 5(2):1-8.
(in Korean)
Loveland T. R., B. C. Reed., J. F., Brown, J. F., Ohlen, D. O., Zhu, Z., Yang, L. and Merchant.
J. 2000. Glob.al Land cover characteristics database(GLCCD) Version 2.0.
Lu D., M. Batistella. and E. Moran. 2002. Linear spectral mixture analysis of TM data for land-use and land-cover classification in Rodonia, Brazilian Amazon, Proceedings of Symposium on Geospatial Theory, Processing and Applications.
Manolakis D., C. Siracusa and G. Shaw. 2001.
Hyperspectral subpixel target detection using the linear mixing model, IEEE Transactions on Geoscience and Remote Sensing, 39(7):
1392-1409.
Oki K., H. Oguma and M. Sugita. 2002. Subpixel classification of alder trees using multitem-
poral landsat thematic mapper imagery, Photogrammetric Engineering & Remote Sens- ing, 68(1):77-82.
Patience, N. and V. V. Klemas. 1993. Wetland func- tional health assessment using remote sensing and other techniques:literature search. NOAA Technical Memorandum NMFS- SEFSC-319, 114.
Roberts D. A., M. Gardner., R. Church., S. Ustin., G.
Scheer and R. O. Green. 1998. Mapping chaparral in the Santa Monica Mountains using Multiple Endmembers Spectral Mixture Models, Remote Sensing of Environment, 65:267-279.
Tamura M., H. Shimazaki., H. Shimazaki., M.
Tomodada., F. Makita., Z. Wenjin and Y.
Yasuoka. 1998. Differentiation of wetland areas in the West Siberian Lowland Using NOAA/AVHRR Imagery, ACRS.
Tian, X. Y., J. Y. Liu., S. E. Jorgensen. and Q. H.
Ye. 2003. Landscape change detection of the newly created wetland in Yellow River Delta, Ecological Modelling, 164, 21-31.
Ustin, S. L., Q. J. Hart., L. Duan and G. Scheer. 1996.
Vegetation mapping on hardwood rangelands in California. International Journal of Remote Sensing, 17, pp.3015-3036.
Williams, D. J., D. A. White and A. Engelmann.
1999. Riparian characterization using sub-pixel analysis in an ecological risk framework.
Proc. of the Am. Soc. for Photogrammetry and Remote Sens. Annual Conference, Port- land, OR. May 21st 1999.
接受 2004年 3月 29日