Vulnerability assessment on the location of industrial complex considering climate change
-Focusing on physical and economic features of provinceㆍindustrial complex -
Yoonjung Kim*·Dongkun Lee*·Changwan Seo**·Jieun Ryu***·
Yeora Chae***·Gyounghye Baek*·Chae-young Bae***
Graduate School, Seoul National University, Department of Landscape Architecture and Rural System Engineering, Seoul National University*
Environmental Planning Institute, Seoul National University**
Graduate School, Seoul National University, Korea Environmental Institute***
(Manuscript received 15 August 2013; accepted 23 November 2013)
산업단지의 입지적 요건을 고려한 기후변화 취약성 평가
- 지자체 및 산업단지의 물리적ㆍ경제적 특성에 집중하여 -
김윤정*·이동근*·서창완**·류지은***·채여라***·백경혜*·배채영***
서울대학교 대학원, 서울대학교 조경ㆍ지역시스템공학부*, 서울대학교 환경계획연구소**
서울대학교 대학원, 한국환경정책평가연구원***
(2013년 8월 15일 접수, 2013년 11월 23일 승인)
Abstract
기후변화가 산업단지에 미치는 영향은 지자체에까지 확산될 수 있으며 물리적, 경제적인 영향이 미 쳐지므로 어떠한 물리적, 경제적 변수에 의해 산업단지의 피해가 초래되는지 규명될 필요가 있다. 따 라서 본 연구는 국가 산업단지를 대상으로 산업단지 및 입지 시군구의 물리적, 경제적 특성을 기반으 로 한 기후변화 취약성 평가를 수행하고 산업단지 입지에 영향을 미치는 시간, 공간별 극한기후를 규 명하고자 하였다. 산업단지의 극한기후에 의한 취약성은 IPCC에서 제안한 상향식 취약성 평가 방법 을 따라 분석되었으며 전력요구도, 위험지역유무 등 단지의 물리적 입지조건과 입지 지자체의 기반시 설 현황, 지자체와 산업단지의 경제적 특성 등이 평가 기준으로 연구되었다. 기후노출, 민감도, 적응 능력의 항목별 가중치와 항목내 변수들의 가중치 분석에 AHP가 적용되었다. 본 연구는 홍수, 가뭄, 혹서, 혹한, 해수면상승에 대해 취약 입지 시군구를 밝혔고 홍수와 가뭄, 혹서와 혹한별로 대비되는 취약성 결과가 나옴을 고찰하였다. 또한, 각 극한기후별로 적응능력 함양이 시급한 시군구를 밝혀 지 자체 차원의 노력이 필요한 시군구를 규명하였다. 서울시 금천구는 산업단지 입지에 가장 취약한 지 역으로 나타났으며 홍수, 혹한에서 높은 취약성을 보임이 분석되었다. 한편, 극한기후의 발생에도 불 구하고 전반적으로 낮은 취약성을 보인 산업단지 입지 지자체는 광주광역시, 전라북도 익산, 제주시 연구논문
Corresponding Author: Changwan Seo, Environmental Planning Istitute, Seoul National University, Daehak-dong, Gwanak-gu, Seoul, Korea Tel: +82-2-877-4003 Fax:82-2-883-8620 E-mail: [email protected]
Ⅰ. Introduction
According to Yuk (2012), until recently, loca- tion of industrial complex was mainly deter- mined by local economic condition and several physical characteristics, including the factors such as GRDP, distance to major city, percentage of green spaces. This supports for traditional knowl- edge on industrial location. However, as attention on climate change has been kept growing, the needs to inspect the impacts of extreme events and to reflect those issues on adaptation acts became important issue to cope with.
Carter et al. (2007) pointed out that little is known about adaptability of industrial complex facing extreme climate events. On the other hand, many researchers already proved the fact that growing frequency of extreme climate events and rising mean temperature will eventually affect economic, industrial, and firm-level structures (Hay, 2002; Hertin et al., 2003; Lash & Wellington, 2007). However, not so much researches were undertaken concerning extreme climate events and locational issues on industrial complex.
In the mean time, traditionally, local economic conditions and physical features of industrial complex were important elements to decide loca- tion of industrial complex. Thus, we concluded that when we have been concerning climate change for locational issues of industrial complex, it is important to analyze extreme climate events’
impacts based on 1) physical characteristic and 2) economic condition not only covering industrial complex’s level, but also focusing to province’s level.
This study, therefore, aims to perform vulnera- bility assessment on the location of industrial complex through selecting the representative indices concerning physical, economical features.
That covers both physical, economical characteris- tic of industrial complex and province level. The results of vulnerability assessment were utilized to determine vulnerable provinces requiring urgent adaptation actions. We believe this will supports to discover which and what elements are to be considered in future for industrial com- plex’s location, and how to achieve adaptation ability in threatened location.
Ⅱ. Method
1. Study site
This study focused on national industrial com- plexes among provinces. Chosen national indus- trial complexes included various types of busi- 등으로 분석되었다. 따라서 본 연구는 산업단지의 업종에 따라 적합하지 않은 입지 지역을 규명하였 으며 향후 산업단지 입지의 잠재 기후변화 영향을 고려한 의사결정을 지원할 수 있다.
주요어 : Industrial complex location, extreme climate, climate vulnerability, climate adaptation
Figure 1. site distributions
ness such as oil, metal manufacture and so on (Table 1). The study sites were distributed across the country (Figure 1). Many of the industrial complexes were located near the sea. Few knowl- edge-based industrial complexes were located in inland area.
2. Extreme climate events
Five extreme climate events were chosen for this study. Refer to CSIRO(2007), Myeong(2009), and URS(2010)’s studies, the most important extreme climate events under climate change were heat wave, extreme cold, flood, drought, and rise in sea level. All chosen extreme climate events had damaged industrial complex, before (Bae et al., 2013).
3. Vulnerability assessment
Smith (1992) said vulnerability to impact is a multi-dimensional concept, encompassing biogeo-
physical, economic, institutional and sociocultural factors, so vulnerability is usually considered to be a function of a system’s ability to cope with stress and shock. Moreover, vulnerability assess- ment reveals the degree of incapability, and this makes vulnerability assessment to predict antici- pated impact and available adaptation options (Linnenluecke M.K. et al., 2011).
To evaluate those impacts and adaptation options, IPCC (2001) settled the assessment methodology comprised of Exposure (E), Sensitivity (S), and Adaptation (A). According to IPCC (2001), Exposure (E) standed for the nature and degree to which ecosystems are exposed to environmental change, Sensitivity (S) represented the degree to which a human-environment is affected by environmental change, and Adaptation (A) referred to adjustment in natural or human systems to a new or changing environ- ment. Finally, to assess the vulnerability, those E, S, and A were first defined through selected rep- resentative variables. Secondly, each defined E, S, and A values were aggregated within following mathematical form. Lastly, weighting parameter (a,b,c), vulnerability (V), Sensitivity (S), and Adaptation (A) were parameters for calculation.
V = (aE + bS) _ cA
In this study, Vulnerability (V) was calculated for each extreme climate events. The variables of Exposure (E) were chosen to reflect frequency and degree of each extreme weather events (e.g.
the number of days without rain). All of variables of Exposure (E) were the most relevantly used indices of former studies on vulnerability assess- ment. The standard to choose each Sensitivity (S) and Adaptation (A) variables were based on physical and economical features of industrial complex and province (Figure 2).
Table 1. Study sites
Region Industrial complex
Seoul Korea export(Seoul digital) Pusan Myeongji·Noksan(Myeongji district)
Daegu Science park
Incheon Korean exort(Bupyeong district), Daeduk research Kwangju Kwangju science industrial complex
Ulsan Korean export(Juan), Ulsan-mipo, Kwangju science, Onsan Gyeonggi-do Asan(poseung), Banwol special district,
Paju-tanhyeon
Gangwon-do Bukpyeong
Chungcheongbuk-do Osong life science, Boeun Chungcheongnam-do Gojung, Daejuk, Janghang,
Asan(Bugok)
Jeollabuk-do Gunjang,Iksan1
Jeollanam-do Yeosu, Kwangyang
Gyeongsangbuk-do Wolseoung, Gumi 4 Gyeongsangnam-do Changwon, Jinhae
Jeju Island Jeju science park
Physical locational features of industrial com- plex were covering following issues.
•Quantitative amount of transportation infrastructure in province scale (e.g.
Kwangyang, Donghae)
•Area and other physical features of indus- trial complex (e.g. Water area ratio, Impermeable area ratio)
•Whether industrial complex have been classified as affected area of extreme cli- mate events
•Quantitative amount of adaptation facili- ties, which reduces the impacts of extreme climate events (e.g. Electricity usage rate, Previously inundated area)
As for the economical features, Linnenluecke and Griffiths (2010) attested that climatic respons- es of industrial system and local economic condi- tion were having visible relationship. For that rea- son, financial capacity for industrial complex and province was considered. To reflect economic condition of industrial complex, indices such as gross regional domestic product and annual pro- duction of each industrial complex were consid- ered.
To validate the each chosen variables, and to assess the weighting parameters, AHP (Analytic Hierarchy Process) were conducted. AHP is one of the decision making process dealing with multi-standards or multi-variables (Kyeon et al.,
2006). In this study, pairwise comparison was conducted to rank the weights among the each variable for E, S, and A. Thirteen participated experts who conducted the researches about industrial complex, infrastructure and vulnerabili- ty assessment were chosen for weight assessment.
According to Jeoun et al. (2011), the consistency ratio can be reasonable under 0.1 values. Thus, this study only covered the answers that include consistency ratio under 0.1 values.
Finally, the overall vulnerability assessment was carried out with ArcGIS 9.3. for 2010, 2020, 2030, 2040, 2050, 2075 and 2100 years. All of the values for each variable were rescaled between 0~1 values. A changing temperature and precipi- tation were predicted through RCP 8.5 pathway scenario (Korean meteorological Administration, 2013).
Ⅲ. Results and Discussion
1. Assessment variables and weighting parameters
Chosen variables and assessed weights are illustrated in Table 2. The selected variables referred the former researches that include key- words such as climate change, extreme climate, industrial complex, industrial complex relocation and vulnerability assessment.Overall, variables for Sensitivity (S) mainly Figure 2. Assessment criteria of Sensitivity (S) and Adaptation (A)
consisted of physical factors regarding area of cli- mate-sensitive infrastructure, size of industrial complex, electricity usage rate and so on. Selected
variables for Adaptation (A) reflected economic factors such as GRDP and production rate of industrial complex. Exposure (E) representing Table 2. Chosen variables
extreme events
(weight) indices variables weight reference
Heat wave
Exposure (0.37)
Number of days of daily maximum temperature over
33˚C 0.54 J. K. Go(2011)
Number of days of daily minimum temperature
under 25˚C 0.29 J. K. Go(2011)
Heat wave index 0.17 J. K. Go(2011)
Sensitivity (0.24)
Cooling-degree day 0.43 Gh. R. Roshan et al.(2012)
Area of industrial complex 0.18 J. K. Go(2011)
Water area ratio(water area/area of industrial complex) 0.26 C. Y. Bae et al.(2013)
Area of road(m2) 0.3 M. J. Kang(2011)
Adaptation (0.49)
GRDP 0.23 S. J. Myeong(2009)
J. K. Go(2011) H. G. Kim et al.(2012) Production of industrial complex 0.37 M. K. Linnenluecke et al.(2011) Available water volume through nearby dam 0.49 Bull SR et al.(2012)
Extreme cold
Exposure (0.265)
Number of days under -10˚C 0.76 Korean occupational safety &
health agency (2009) Number of days of maximum temperature under 0˚C 0.23 C. Y. Bae et al.(2013) Sensitivity
(0.414)
Warming-degree day 0.34 Gh. R. Roshan et al.(2012)
Area of industrial complex 0.33 J. K. Go(2011)
Electricity usage rate 0.32 Kopytko N.(2011)
Adaptation (0.32)
GRDP 0.21 S. J. Myeong(2009)
J. K. Go(2011) H. G. Kim et al.(2012) Production of industrial complex 0.31 M. K. Linnenluecke et al.(2011) Area of heat supplying facilities (m2) 0.48 Kehlhofer R et al.(2011)
Flood
Exposure
(0.232) Number of days of daily precipitation over 80mm 0.64 S. J. Kim(2011)J. K. Go(2011) Maximum precipitation per every 5 days 0.35 H. K. Kim et al.(2012)
Sensitivity (0.544)
impermeable area ratio 0.26 Bull SR et al.(2007)
Area of industrial complex 0.14 J. K. Go(2011)
Area of previous inundated area 0.30 S. J. Myeong(2009) M. J. Kang(2011)
Area of road 0.11 M. J. Kang(2011)
Area of airport 0.09 M. J. Kang(2011)
Area of harbors 0.10 M. J. Kang(2011)
Adaptation (0.224)
GRDP 0.17 S. J. Myeong(2009)
J. K. Go(2011) H. G. Kim et al.(2012) Production of industrial complex 0.22 M. K. Linnenluecke et al.(2011)
Stream improvement rate 0.28 J. K. Go(2011)
Area of stream, reservoir or river 0.33 M. J. Kang(2011)
intensity and occurrence of each extreme climate events illustrated meterological thresholds.
Generally, Adaptation (A) had highest weight, and Exposure (E) was the second important indices.
2. industrial complex’s vulnerability assessment
Vulnerability map of each extreme climate events were suggested (Figure 2). Overall, the highest vulnerable tendency was observed in vul- nerability assessment of rise in sea level (Figure 3). Whereas, extreme cold had lowest vulnerable influence to industrial complex. Looking at vul- nerability map among 2010~2100 years, vulnera- bility values between flood and drought shown contrary results. Flood tended to be increased in Gyeonggi province and Chungcheongnam-do,but vulnerability of drought has been kept decreasing in these regions. In line with this fact, the results suggested that industrial complex will become more vulnerable to flood, but become safer to drought.
As flood and drought illustrated opposing results, heat wave and extreme cold had different vulnerable tendencies. Vulnerability of heat wave showed decreasing phase in initial stage, but it constantly increased after 2040 year. The results suggested that Cheongju and Gumi province’s industrial complex will constantly become vulner- able to heat wave after 2040 year. Whereas, industrial complex will become more safer to extreme cold. Except for industrial complex in Donghae province, majority of industrial com- plexes become safe.
Table 2. Contiuned extreme events
(weight) indices variables weight reference
Drought
Exposure(0.484) Number of days without rain 1 C. Y. Bae et al.(2013)
Sensitivity (0.212)
Area of industrial complex 0.32 J. K. Go(2011)
Usage of industrial water per ha(ton/day) 0.44 S. J. Kim(2011) Water area ratio(water area/area of industrial
complex)% 0.18 C. Y. Bae et al.(2013)
Adaptation (0.303)
GRDP 0.27 S. J. Myeong(2009)
J. K. Go(2011) H. G. Kim et al.(2012) Production of industrial complex 0.39 M. K. Linnenluecke et al.(2011) Area of stream, reservoir or river 0.34 M. J. Kang(2011)
Rising sea level
Exposure(0.439) Rising water level(cm) 1 K. W. Cho(2004)
Sensitivity (0.273)
Area of industrial complex 0.175 J. K. Go(2011) Area of previous inundated area 0.327 S. J. Myeong(2009)
M. J. Kang(2011)
Elevation 0.32 K. W. Cho(2004)
Area of road 0.104 M. J. Kang(2011)
Area of harbors 0.185 M. J. Kang(2011)
Adaptation (0.288)
GRDP 0.269 S. J. Myeong(2009)
J. K. Go(2011) H. G. Kim et al.(2012) Production of industrial complex 0.211 M. K. Linnenluecke et al.(2011)
Area of seawall(m2) 0.429 K. W. Cho(2004)
In the meantime, industrial complex’s vulnera- bility of rising sea level continually illustrated high vulnerable tendency. However, industrial complexes in Hampyeong-gun and Yeoungam- gun had lower vulnerability.
3. Influences of Exposure and Adaptation factors
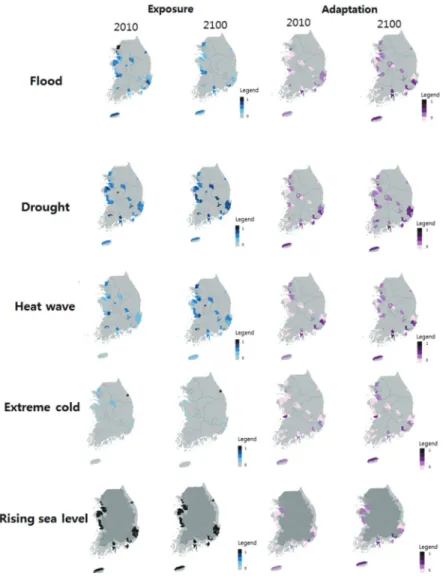
Illustrated vulnerability in figure were the results of factors reflecting Exposure (E), Sensitivity (S), and Adaptation (A). Within these factors, especially Exposure (E) and Adaptation(A)’s influence were observed in Fig 4. Exposure (E) represents occurrence tendency of extreme whether, which can explain pure extreme whether’s climatic impact. On the other hand, Adaptation (A) makes available to judge adaptive capacity of industrial complexes. Thus, it can be utilized to assess how industrial complex mitigate the impact of climate change.
In line with that, in this study, values for Exposure (E) and Adaptation (A) were predicted from the present to the future. That is, whole val- Figure 3. Vulnerability map
ues were separately assessed on each predicted years of 2010~2100. However, we started from the basic premise that values for Sensitivity (S) were same across whole years because there were no predicted factors for the future. Thus, observ- ing the results of Exposure (E) and Adaptation (A) make possible to evaluate the specific chang- ing tendency throughout assessment years.
The results illustrated that occurrences of flood and extreme cold were decreased during 2010~2100 years. At the same time, adaptive capacity between province and industrial com-
plex were increased, so the overall result indicat- ed lower vulnerability. Whereas, occurrences of drought and heat wave analyzed to be increased.
However, growing adaptive capacity due to eco- nomic growth tend to mitigate the vulnerabilities.
Vulnerability map, therefore, illustrated mitigated results, even though climatic hazards were high.
In the meantime, Exposure (E) values of rise in sea level shown constant same results, because it had been predicted by RCP 8.5 pathway sce- nario’s constant national sea level rising rate.
Figure 4. Map of Exposure and Adaptation
4. Top 20% vulnerable industrial complex located provinces
Comparing overall results, province which shown among the top 20% of vulnerability were suggested (Table 3). Provinces that have repeated-
ly illustrated top 20% of vulnerability were also shown in Figure 5.
Overall, the majority of vulnerable provinces to flood were also resulted not to be vulnerable to drought. The most redundant vulnerable Table 3. List of provinces obtained high vulnerability
Province Extreme climate events
Count Flood Drought Heatwave Extreme cold Rising Sealevel
Seoul Guro ○ 1
Seoul Geumcheon ○ ○ 2
Pusan Gangseo ○ 1
Daegu Dalseoung ○ 1
Incheon Namdong ○ ○ 2
Incheon Bupyeong ○ 1
Incheon Seogu ○ 1
Kwangju Bukgu 0
Kwangju Kwangsan 0
Ulsan Namgu ○ 1
Ulsan Donggu ○ 1
Ulsan Bukgu ○ 1
Ulsan Ulju ○ 1
Gyeonggi-do Pyeongtak ○ 1
Gyeonggi-do Sigeung ○ 1
Gyeonggi-do Paju ○ 1
Gyeonggi-do Hwaseong ○ 1
Kangwondo Donghae ○ 1
Chungcheongbuk-do Cheongwon ○ 1
Chungcheongbuk-do Boeun ○ ○ 2
Chungcheongnam-do Boryeong ○ 1
Chungcheongnam-do Seosan ○ 1
Chungcheongnam-do Seocheon ○ 1
Chungcheongnam-do Dangjin 0
Jeollabuk-do Gunsan 0
Jeollabuk-do Iksan 0
Jeollanam-do Yeosu ○ 1
Jeollanam-do Kwangyang ○ 1
Jeollanam-do Yeongam ○ 1
Jeollanam-do Hampyeong ○ 1
Gyeongsangbuk-do Kyeongju ○ 1
Gyeongsangbuk-do Gumi 0
Gyeongsangnam-do Changwon ○ 1
Gyeongsangnam-do Jinhae ○ 1
Gyeongsangnam-do Geoje 0
Jeju Isaland Jeju 0
province among assessed extreme whether events illustrated high vulnerability for two extreme cli- mate events. Seoul Geumchungu, Incheon Namdong-gu, Chungcheongbuk-do Choongju, and Chungcheongbuk-do Boeun assumed to have top vulnerabilities.
The provinces, which were analyzed to have lowest vulnerability include Kwangju, Jeollabuk- do Iksan, gunsan, Jeju and so on. Due to the low- est vulnerability under occurrences of extreme cli- mate events, those provinces can be assumed to be the most appropriate location for industrial complex considering climate change.
Ⅳ. Conclusion
This study has undergone vulnerability assess- ment of industrial complex considering physical and economical factors to assume locational cli- matic impacts under extreme whether events.
The results indicated that upmost redundantly vulnerable provinces were located in Seoul, Incheon and Chungcheongbuk-do. Each assessed
extreme climate events were shown opposed vul- nerability in accordance with general climate change trend. In line with that, results of flood and drought were in contradiction, and also extreme climate and heat wave had opposed vul- nerability.
Consideration of both industrial complex and province allowed to reflect not only industrial complex, but also located province’s adaptive capacity. This enabled to discern which province needed to enhance their adaptive capacity.
Moreover, assessing process and results of this study can be used to decide location or relocation of industrial complex.
Acknowledgement
This subject is supported by Korea Ministry of Environment as “Climate Change Correspondence R&D Program”
Reference
Bae, C.Y., Oh, Y.G., Back, G.H., Choi, K.R., Lee, S.H., Lee, D.K., 2013, A study on climate change vulnerability assessment index and weights of industrial sectors - focused on petroleum and automobile industries, Korean Planners Association 48(2): 313-328.
Jeon, J.H., Ha, S.W., 2011, A study on the preference among the employee benefit programs based on AHP technique, Korean Academy of Human Resource Management 18(1): 179-196.
Kwon, M.Y., Gu, B.J., Lee, G.H., 2006, Establishing the importance weight model of IT investment evaluation criteria Figure 5. Top 20% vulnerability ranked count
through AHP analysis, Information Systems Review 8(1): 265-285.
Yuk, K.C., 2012, Analytical study on the determinant factors of the land sale of industrial complex, Seoul National University.
Carter, T.R., Jones, R.N., Lu, X., Bhadwal, S., Conde, C., Mearns, L.O., O’Neill, B.C., Rounsevell, M.D.A., Zurek, M.B., 2007, New assessment methods and the characterisation of future conditions, Contribution of Working Group II to the Fourth Assessment Report of the Intergovernmental Panel on Climate Change. Cambridge University Press, Cambridge, UK.
CSIRO, 2006, Infrastructure and climate change risk assessment for Victoria, Report to the Victorian Goverment.
Hay, J., 2002, Integrating disaster risk management and adaptation to climate variability and change: needs, benefits and approaches from a South Pacific perspective. Paper presented at the UNDP Expert Group Meeting, Havana.
Hertin, J., Berkhout, F., Gann, D.M., Barlow, J., 2003, Climate change and the UK house building sector: perceptions, impacts and adaptive capacity, Building Research &
Information 31, 278-290.
IPCC, 2001, climate change 2001: the scientific basis, Contribution of Working Group 1 to the Third Assessment Report of the Intergovernmental Panel on Climate Change, Cambridge University Press, Cambridge, UK, and New York, USA.
Lash, J., Wellington, F., 2007, Competitive advantage on a warming planet, Harvard Business Review 85, 94-103.
Linnenluecke, M.K., Griffiths, A., 2010, Beyond adaptation: resilience of business in light of climate change and weather extremes, Business & Society 49, 477-511.
Linnenluecke, M.K., Stathakis, A., Griffiths, A., 2011, Firm relocation as adaptive response to climate change and weather extremes, Global environmental change 21: 123-133.
Myung, S.J., Kim, J.Y., Shin, S.H., An, B.W., 2009, Assessing vulnerability to climate change of the physical infrastructure and developing adaptation measures in Korea, Seoul: Korean Environmental Institute.
Smith, P.J., 2007, Climate change, mass migration and the military response, Orbis 51, 617-633.
URS Corporation Limited, 2010, Adapting energy, transport and water infrastructure to the long-term impacts of climate change, 115.
http://www.climate.go.kr
최종원고채택 13. 11. 26