†Corresponding author: Department of Mechanical Engineering, Mokpo National University, 1666 Youngsan-ro, Cheonggye-myeon, Muan-gun, Jeonnam 534-729, Republic of Korea, E-mail: [email protected], Tel: 061-450-2419 1 Department of Mechanical Engineering, Graduate School, Mokpo National University, E-mail: [email protected], Tel: 061-450-2419
The influence of guide vane opening on the internal flow of a francis turbine
Qingsheng Wei1 ․ Young-Do Choi†
(Received December 28, 2012; Revised March 6, 2013;Accepted April 25, 2013)
Abstract: The variable demand on the energy market requires a great flexibility in operating hydro turbines.
However, Francis turbine operated at off-design conditions poses technical challenges related to large unsteady forces given by residual swirl and angular momentum. In order to improve the performance of a Francis tur- bine, the paper presents a numerical investigation of the 3D flow in the turbine at off-design conditions and discusses the influence of variable guide vane openings on the internal flow of a Francis turbine with the help of computational fluid dynamics. First, the internal flow characteristics of Francis turbine operated by varied guide vane angle at off design condition are computed and the optimal guide vane angle is obtained.
Secondly, the Francis turbine is operated with guide vane number varies at the optimal guide vane angle.
Finally, pressure contours and velocity distributions in the distributor are discussed and compared.
Keywords: Francis turbine, Guide vane opening, Internal flow, Performance
1. Introduction
Francis turbine is the most widely used turbine in the world. It has a wide head range from 20m to 700m. And its connected generator output power var- ies from just a few kilowatts up to one gigawatt.
Besides, the most important fact is that its efficiency can be as high as over 90%.
However, guide vanes operated at off-design point resulting into the unsteady flow remains a challenge to overcome. Many studies were conducted ex- perimentally and computationally to reveal and solve the problem. Hasmatuchi et al. [1] experimentally pointed out that pressure fluctuation in the turbine has some relations to the guide vane channels and the large vaneless space between the runner and the guide vane at low opening. Khare et al. [2] also proved that the guide vane opening have large influ-
ence in the whirl velocity at runner outlet by CFD method. Muntean et al. [3][4] monitored the cav- itation performance of a Francis turbine operated at nominal head and variable discharge and obtained the proper guide vane axis location by simulating the 3-D flow characteristics for the whole operating range.
Alnaga et al. [5] developed an automatic iterative procedure for optimal design of distributors(including stay vane and guide vane) and successfully applied in a Francis turbine.
However, the influence of guide vane for a certain Francis turbine is hard to standardized. In order to examine the influence of the guide vane opening to the internal flow of a Francis turbine with specific speed of 80.5, a series of CFD analysis are conducted in this study. First, CFD analysis on the internal flow of a Francis turbine model for up to 9 guide vane an-
gles is performed and an optimal guide vane angle is obtained. Secondly, CFD analysis on the turbine with guide vane number varying from 12 to 20 are con- ducted to get the ideal value. Finally, relations of the angle and number of guide vane with the perform- ance of the turbine are examined using static pressure and circumferential velocity.
2. Turbine model
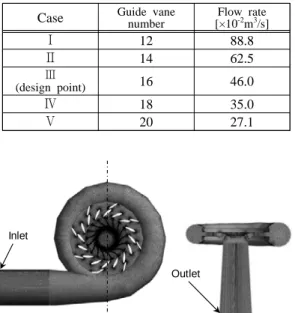
Figure 1 shows the schematic view of the Francis turbine model which is used for CFD analysis in this study. Figure 1 (a) shows the three dimensional view and Figure 1 (b) presents the two dimensional config- uration of the turbine. The runner outlet diameter De
is 0.350m. When the number of the blades is 17, the guide vane angle can be fully opened to 0.0694m(100%). The rotating speed of runner, effec- tive head, output power and flow rate at the design point are N=900min-1, H=60.73m, P=230kW and Q=0.46m3/s, respectively.
Figure 2 (a) shows the 3D modeling of the guide vane. The guide vane rotates to the pivot to change the guide vane angle αg as shown in Figure 2 (b).
Guide vane angle reaches its the maximum value of αgMAX. When the tip of vane reaches the inlet of run- ner or inversely, it shows a less αg. The area be- tween guide vane and runner is defined as vaneless area.
Moreover, Tables 1 and 2 show the cases of CFD analysis by the variation of guide vane angle and guide vane number. CFD analysis on the influence of guide vane angle is firstly carried out with guide vane number is 16 and optimal guide vane angle is obtained. Then CFD analysis on the influence of guide vane number is secondly conducted based on the optimal guide vane angle.
3. Numerical Methods
This study employs a commercial CFD code of ANSYS CFX [6] to conduct CFD analysis. As shown
in Figure 3, tetrahedral numerical grids of about 19.8×10⁶ are adopted for the analysis of the calcu- lation domain including inlet pipe, casing, runner and draft tube. Relatively dense grids are applied to the runner. Fine hexahedral numerical grids are employed for the draft tube of the turbine.
(a) (b)
Figure 1: (a) 3D view of Francis turbine model; (b) 2D view of Francis turbine model
(a) (b)
Figure 2: (a) Guide vane modeling with pivot; (b) Schematic view of guide vane angle(αg) variation
Table 1: Cases of CFD analysis by guide vane angle
Case Guide vane
angle [%]
Flow rate [×10-2m3/s]
1 10.0 15.1
2 19.5 27.0
3 23.4 30.3
4 31.2 10.0
5 35.0 44.2
6
(design point) 38.9 46.0
7 46.7 56.6
8 50.6 59.9
9 54.5 62.6
Table 2: Cases of CFD analysis by guide vane number
Case Guide vane
number
Flow rate [×10-2m3/s]
Ⅰ 12 88.8
Ⅱ 14 62.5
Ⅲ
(design point) 16 46.0
Ⅳ 18 35.0
Ⅴ 20 27.1
Inlet
Outlet
Figure 3: Numerical mesh of turbine model
Table 3: Numerical methods and boundary condition
Numerical methods
Mesh type
Tetra-hedral (turbine)&
tetra-hedral (draft tube) Mesh number 19.8×10⁶
y+ below 15(runner) below 50(casing) Turbulence
model SST
Calculation
type Steady state
Boundary condition
Rotor-stator
interface Frozen rotor Inlet of
turbine Constant pressure Outlet of
turbine Averaged outflow
Wall No-slip
The numerical methods and boundary condition are set as shown in Table 3. Shear stress transport(SST) model is adopted as turbulence model because of its relatively good convergence in the complicated flow
field of turbomachinery. The flow conditions are im- posed at boundary conditions related to constant pres- sure estimated by ρgH at the inlet and averaged out- flow at the outlet. At the interface between the rotat- ing domain (runner) and stationary domain (guide vane & draft tube) a frozen-rotor interface is used.
All calculations are conducted under the condition of steady state.
4. Results and Discussion
4.1 Performance curves
The flow field is investigated when guide vane openings (guide vane angle and guide vane number) are changed.
Figure 4 shows the performance curves of the Francis turbine model. The best efficiency point is taken as reference condition. As both guide vane an- gle and guide vane number are related to flow rate, flow rate ratios are considered to be the axis of ab- scissas and thus, the efficiency curves by two kinds of guide vane opening control methods can be easily compared. The axis of ordinates reveals normalized efficiency.
Figure 4: Efficiency curves by guide vane opening
The efficiency curve ηEXP is referred to the tur- bine manufacturer's design data [7]. The present CFD analysis result of efficiency curve by guide vane an-
gle presents a good convergence with the designed curve, which indicates that the adopted numerical method here is reliable.
Moreover, the CFD analysis result of efficiency curve by guide vane number shows a relatively better efficiency in partial load cases(Q/Qbep is less than 1) but a little lower efficiency in excessive load cases in comparison with those by the results of guide vane angle control.
Compared with Tables 1 and 2, an optimal guide vane opening with guide vane angle opened to 38.9%
and guide vane number equaled to 16 is obtained.
4.2 Pressure contours and velocity vectors by guide vane angle
Figure 5 shows the test plane and locations in the turbine. Figure 5 (a) shows the central plane for test pressure contours and velocity vectors because the da- ta here are quite representative. Figure 5 (b) shows the six radial locations of pressure and velocity dis- tributions on the plane. The inlet and outlet of guide vane, the vaneless area, the inlet, mid-radial and out- let of runner are noted as Locations 1 to 6.
(a) (b)
Figure 5: (a) Test plane of pressure contours and velocity vectors; (b) Radial locations of pressure and velocity on the plane shown in Figure 5 (a)
Static pressure contours and velocity vectors in the turbine by guide vane angle are shown in Figure 6.
Case 1 is chosen as representative for its typical in- ternal flow characteristic of partial load case which is quite different from that of Case 6. Case 6 is a case by the flow rate at the best efficiency point(bep) that
is considered as normal criterion. Similarly, Case 9 is chosen to present the internal flow characteristics of Francis turbine in over load condition.
Figure 6( a) shows a sharp pressure transition along the guide vane passages and lower pressure in the run- ner in Case 1 by partial load. On the contrary, pres- sure decreases gradually when water passes through relatively wide guide vane passages in Case 6.
Velocity vectors in Figure 6 (b) are taken from the same passage of the runner in Figure 6 (a).
Recirculation flow in the runner passage, which is shown as relative velocity vectors, and relatively high circumferential velocity, which is shown as absolute velocity vectors, in the vaneless area are observed in Case 1, which could be the reasons that the effi- ciency of Case 1 is quite lower than that of Case 6.
On the other hand, the velocity vectors in Case 9 show a quite uniform flow passing through the runner passage.
(a) Pressure contours (b) Velocity vectors Figure 6: Pressure contours and velocity vectors in the turbine by guide vane angle.
Figure 7: Pressure distributions in the turbine at the design point (Case 6).
Figure 8: Absolute circumferential velocity dis- tributions in the turbine at the design point (Case 6).
Figures 7 and 8 show the static pressure and ab- solute circumferential velocity distributions from Locations 1 to 6 at the designed flow rate range of Case 6. The test locations are shown in the Figure 5.
The pressure distributions at each location show gradual decrease of static pressure from Locations 1 to 6. The decreased static pressure changes to output torque in the runner passage.
Moreover, circumferential velocity distributions show that, from Locations 1 to 3, the velocity in- creases gradually due to the guided flow direction by the guide vane but decreases apparently from Locations 4 to 6, which means that the increased an-
gular momentum in the regions from Locations 1 to 4 changes to output torque in the Locations 4 to 6.
Figure 9 shows the pressure distributions in the Francis turbine by the differential pressure coefficient:
∆
(1)
where pin is the static pressure at the inlet of tur- bine casing and p is the local static pressure of test location, R is the diameter of runner inlet, and ω is angular velocity.
Figure 9: Averaged pressure distributions in the turbine by guide vane angle.
Figure 10: Averaged circumferential velocity dis- tributions in the turbine by guide vane angle.
The difference of static pressure increases drasti- cally between the Locations 1 and 2 in all case as shown in Figure 9, which implies that pressure de- crease occurs considerably at the guide vane passage because of the increased circumferential velocity in the guide vane passage. Especially, in the Case 1, the amount of pressure decrease is considerably larger than those of the other cases. The larger amount of pressure decrease at the guide vane passage may lead to the low efficiency in the partial load ranges.
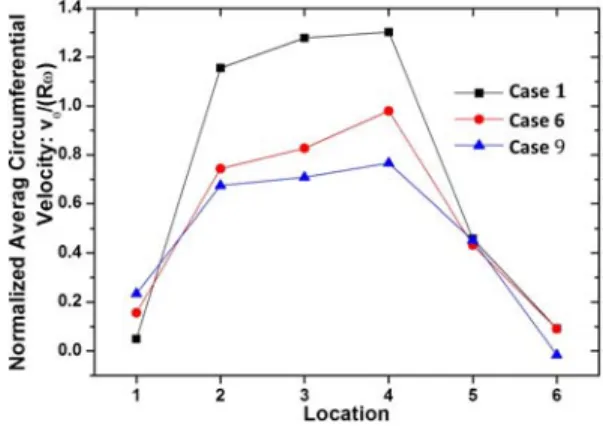
Figure 10 shows the averaged circumferential ve- locity distributions in those three cases. Case 1 shows relatively higher velocity from Locations 2 to 4 but decrease drastically from Locations 4 to 5, which means that there exists considerable hydraulic loss by recirculation flow in the runner passage as shown in Figure 6 (b).
4.3 Pressure contours and velocity vectors by guide vane number
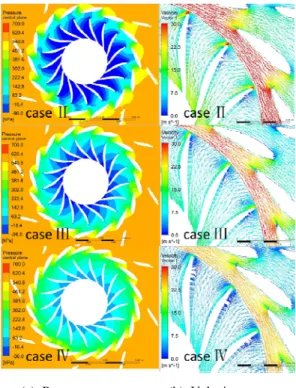
Corresponding to the flow rate in Case 1, Case 6 and Case 9, Case Ⅳ, Case Ⅲ and Case Ⅱ are chos- en as typical cases to analyse to internal flow charac- teristics in the Francis turbine influenced by the guide vane number, respectively. Figure 11 shows the pres- sure contours and velocity vectors on the test plane shown in Figure 5 (a) by guide vane number.
Unlike the cases by guide vane angle, the less of guide vane number is, the larger the guide vane opening will be. As the guide vane angle and inlet pressure are set to same value in all cases, and Case Ⅱ has the largest flow rate, static pressure at the runner passage in Case Ⅱ is lower than those of the other cases as shown in Figure 11 (a).
On the other hand, Unlike the velocity vectors of Case 1 in Figure 6 (b), there is no recirculation flow region in the runner passage even at the partial load condition in Case Ⅳ. Relatively higher guide vane
angle in Case Ⅳ than that of Case 1 should have lead the main stream of the flow into the runner passage without the occurrence of re- circulation flow.
Figure 12 shows the averaged pressure distributions by the differential pressure coefficient ∆ in the Francis turbine model according to the variation of guide vane number. Case Ⅱ shows relatively higher value of ∆ at all locations in comparison with those of Cases Ⅲ and Case Ⅳ. The tendency of pressure distribution in the turbine passage by the guide vane number is close to proportional to the flow rate by comparing the ∆ versus to test loca- tion curves of Case Ⅱ, Cases Ⅲ and Case Ⅳ.
(a) Pressure contours (b) Velocity vectors Figure 11: Pressure contours and velocity vectors in the turbine by guide vane number.
Figure 13 shows the averaged circumferential ve- locity distributions in the turbine by guide vane number. Due to the same guide vane angle, circum-
ferential velocity at the Locations 1 to 4 shows al- most same distribution pattern with the change of the velocity at each location according to the mass flow rate of the Cases Ⅱ to Ⅳ. And then, the circum- ferential velocity decrease abruptly from the Locations 4 to 6.
Figure 12: Averaged pressure distributions in the tur- bine by guide vane number.
Figure 13: Averaged circumferential velocity dis- tributions in the turbine by guide vane number.
5. Conclusions
According to the investigation of the influence of guide vane opening, which includes the variation of angle and number of the guide vane, guide vane opening gives considerable influence to the internal
flow and performance of the Francis turbine. The op- timum guide vane opening is obtained at a guide vane angle of 38.9% and at a guide vane number16.
Relatively larger variation of the pressure and veloc- ity distributions is found by guide vane angle in com- parison with that of guide vane number. Guide vane opening controlled by guide vane number shows a quite better efficiency in partial load condition than that by guide vane angle, other than almost equiv- alent efficiency in excessive load condition. More uniform flow in the turbine runner passage occurs in partial load cases by guide vane number. Therefore, in order to get a larger operating range, a possible way to is to control the mass flow rate with the guide vane number by keeping the guide vane angle.
Acknowledgements
This research was financially supported by the Ministry of Education, Science and Technology (MEST) and National Research Foundation of Korea(NRF) and Jeonnam Science & Technology Promotion Center (JNSP) through the research & de- velopment project of Jeonnam Science Park.
Reference
[1] V. Hasmatuchi, M. Farhat, P. Maruzewski, and F. Avellan, "Experimental investigation of a pump-turbine at off-design operating conditions,"
Proceedings of the 3rd International Association for Hydro-Environment Engineering and Research International Meeting of the Workgroup on Cavitation and Dynamic Problems in Hydraulic Machinery and Systems, pp. 339-347, 2009.
[2] R. Khare, V. Prasad, and S. Kumar, "CFD ap- proach for flow characteristics of hydraulics Francis turbine," International Journal of Engineering Science and Technology, vol. 2, no.
8, pp. 3824-3831, 2010.
[3] S. Muntean, R. F. Susan-Resiga, S. Bernad, and I. Anton, "Analysis of the GAMM Francis tur-
bine distributor 3D flow for the whole operating range and optimization of the guide vane axis location," Proceedings of the 6th International Conference on Hydraulic Machinery and Hydrodynamics, pp. 131-136, 2004.
[4] S. Muntean, I. Ninaci, R. Susan-Resiga, A.
Baya, and I. Anton, "Numerical analysis of the flow in the old Francis runner in order to de- fine the refurbishment strategy," University Politehnica of Bucharest Scientific Bulletin, Series D, vol. 72, no. 1, pp. 117-124, 2010.
[5] A. Alnaga and J. L. Kueny, " Optimal design of hydraulic turbine distributor," World Scientific and Engineering Academy and Society Transactions on Fluid Mechanics, vol. 3, no. 2, pp. 175-185, 2008.
[6] ANSYS CFX Documentation, http://www.ansys.com, Accessed May 20, 2012.
[7] Tanaka Suiryoku, Technical Design Book of Francis Hydro Turbine, Japan, 2012.