Biomedical Science Letters 2017, 23(3): 201~207 https://doi.org/10.15616/BSL.2017.23.3.201 eISSN : 2288-7415
Association of Uric Acid Levels with Arterial Stiffness in Korean Women and Non-smoking Men
Jae Woong Sull 1,† , Eun Na Koh 2 , Sung Kweon Cho 3 , Hyung-Joon Bae 4 and Sun Ha Jee 5
1
Department of Biomedical Laboratory Science, College of Health Sciences, Eulji University, Seongnam 13135, Korea
2
Exercise Medicine Center for Diabetes and Cancer Patients, Yonsei University, Seoul 03722, Korea
3
Department of Pharmacology, Yonsei University College of Medicine, Seoul 03722, Korea
4
Department of Clinical Laboratory Science, Daejeon Institute of Science and Technology, Daejeon 35408, Korea
5
Institute for Health Promotion & Department of Epidemiology and Health Promotion, Graduate School of Public Health, Yonsei University, Seoul 03722, Korea
Measuring the pulse wave velocity (PWV) is a non-invasive method for evaluating the stiffness of the vessel wall.
While previous studies investigated the association of uric acid level with arterial stiffness, most did not consider smoking status and obesity as covariates. The objective of this study was to investigate the relationship between uric acid levels and arterial stiffness, considering smoking status and obesity. We studied 3390 subjects (1940 males and 1450 females).
Abnormal PWV was also defined as the highest quartile of values in the subjects. Data were analyzed using Pearson correlation, t-test, and multiple regression analysis. Approximately 41.9% of men and 3.7% of women were current smokers. Prevalence of hypertension was 11.4% in men and 7.0% in women. In women, hyperuricemia was associated with abnormal PWV (OR 1.58; 95% CI 1.03~2.43). Hyperuricemia was also associated with abnormal PWV (OR 2.37;
95% CI 1.01~5.59) in non- or light male smokers with normal blood pressure. This study suggests that uric acid is associated with arterial stiffness in women and non-smoking men.
Key Words: Pulse wave velocity, Uric acid, Obesity, Smoking
INTRODUCTION
Elevated serum uric acid levels are associated with a variety of adverse health outcomes, including gout, hyperten- sion, diabetes mellitus, and cardiovascular diseases (Richette et al., 2010). Arterial stiffness represents vascular damage and indicates the degree of atherosclerosis (Cohn, 1999).
Measuring pulse wave velocity (PWV) is a noninvasive technique to assess atherosclerosis related to arterial stiffness.
Previous studies have reported that the association of uric
acid level with arterial stiffness remains controversial (Chen et al., 2010; Lim et al., 2010; Tsioufis et al., 2011; Fang et al., 2014; Saijo et al., 2005; Bae et al., 2013; Mulè et al, 2014).
Most of these studies did not consider smoking status and obesity as covariates. Some studies reported a significant negative correlation between serum uric acid level and the smoking status (Haj Mouhamed et al., 2011; Slater et al., 1985). Obesity factor which can be assessed by waist circum- ference (WC) is also positively associated with the occur- rence of cardiovascular events and diastolic dysfunction (Czernichow et al., 2005). Thus, the purpose of this study
Original Article
*
Received: July 23, 2017 / Revised: September 6, 2017 / Accepted: September 12, 2017
†
Corresponding author: Jae Woong Sull. Depratment of Biomedical Laboratory Science, College of Health Science, Eulji University, Seongnam 13135, Korea.
Tel: +82-31-740-7318, Fax: +82-31-740-7354, e-mail: [email protected]
○
CThe Korean Society for Biomedical Laboratory Sciences. All rights reserved.
○
CCThis is an Open Access article distributed under the terms of the Creative Commons Attribution Non-Commercial License (http://creativecommons.org/licenses/by-nc/3.0/) which
permits unrestricted non-commercial use, distribution, and reproduction in any medium, provided the original work is properly cited.
was to investigate the association of uric acid levels with peripheral PWV, considering smoking status and obesity.
SUBJECTS AND METHODS Study population
The study population consisted of 6,551 subjects who participated in the Korean Metabolic Syndrome Research Initiative and had routine health examinations at the Health Promotion Centers of university hospitals from January 2006 to December 2006. The objective and contents of this project were explained to the participants who volunteered to undergo the health examinations. The volunteer subjects were recruited only after informed consent was obtained (Yoon et al., 2008). A total of 3,390 subjects (1,940 males and 1,450 females) underwent PWV measurements. The Institutional Review Board of Human Research at Yonsei University approved this study (no. 4-2011-0277).
Data collection
Each participant was interviewed by using a structured questionnaire to collect the history of cigarette smoking (never smoked, ex-smoker, or current smoker) and alcohol consumption (non-drinker or drinker of any amount of alcohol), as well as other demographic characteristics such as age and sex. Pack-years were calculated by multiplying smoking duration with daily tobacco consumption (e.g. the number of cigarette per day). Waist circumference (WC) was measured midway between the lower rib and the iliac crest.
Weight and height were measured while the participants were wearing light clothing. Body mass index (BMI) was calculated as weight (kg) divided by the square of height (m
2). Blood pressure was measured of the participants in the sitting by a registered nurse or a blood pressure technician using a standard mercury sphygmomanometer or automatic manometer. Both systolic blood pressures (SBP) and diastolic blood pressures (DBP) were measured after a 15-min at rest.
Measurement of biomarkers
Serum for the clinical chemistry assays was separated from peripheral venous blood samples. The serum was obtained from each participant after a 12 hr fast and stored at -70℃
for 2 hr. Biomarkers of metabolic syndrome including fasting blood glucose (FBG), triglycerides, and uric acid levels were measured. Data quality control was performed in accordance with the procedures of the Korean Association of Labora- tory Quality Control. Peripheral PWV was measured using a PP-1000 pulse wave analyzer (Hanbyul Meditech Co., Jeonju, Korea), as described previously (Zeng et al., 2008;
Lee et al., 2009). Regional PWV values in the aorta and leg were calculated automatically 10 sec after the data were collected. Peripheral PWV data were collected from the femoral-dorsalis pedis artery distance.
Statistical analysis
The independent t-test was used to analyze the differences among the participants' characteristics. A Pearson's corre- lation analysis was also performed to evaluate the relation- ship between the PWV and various clinical factors. Multiple linear regression models were used to assess the association between uric acid level and peripheral PWV. Multiple logistic regression models were also used to assess the association between hyperuricemia and abnormal peripheral PWV.
Hyperuricemia was defined as the highest quartile of values, which was defined as a serum uric acid (SUA) level ≥6.9 mg/dL in men and ≥4.8 mg/dL in women. Abnormal PWV was also defined as the highest quartile of values in subjects.
We analyzed the data according to gender because the uric acid levels and the prevalence of smoking were significantly different between men and women. We divided the subjects into two groups (according to median values) of WC (<75 cm and ≥75 cm) in women to control potential confounding by WC because central obesity is associated with cardio- vascular disease (Czernichow et al., 2005; Park et al., 2010).
We also divided the study subjects according to smoking status in men. All analyses were conducted using SAS ver.
9.2 software (SAS Institute, Cary, NC, USA). All tests were two-sided, and significance was accepted at P < 0.05.
RESULTS
The majority of individuals examined were middle-aged
subjects (Table 1). In general, male subjects had higher WC,
BMI, FBG, TC, homeostasis model assessment of insulin
resistance (HOMA-IR), and peripheral PWV levels, but lower high density lipoprotein(HDL)-cholesterol levels than those in female subjects. In male subjects, mean levels of leg PWV were 9.81, 9.73, 9.78, and 9.81, respectively for smokers, non-smokers, normouricemic (<6.9 mg/dL), and hyperuricemic (≥6.9 mg/dL). In female subjects, mean levels of leg PWV were 9.05 and 9.29, respectively for normou- ricemic (<4.8 mg/dL) and hyperuricemic (≥4.8 mg/dL).
Approximately, 41.9% of men and 3.7% of women were current smokers. Prevalence of hypertension was 11.4% in men and 7.0% in women.
Peripheral PWV was significantly associated with SBP in men and women (P<0.0001), respectively, after adjusting for age, lipid level, and BMI (Table 2). Peripheral PWV was also marginally significantly associated with uric acid levels
in women (P=0.060), but it was not associated with uric acid levels in men (P=0.393). However, when the analyses were performed only in non-smokers and light smokers, peripheral PWV was significantly associated with uric acid levels in men (P=0.022). The data were further stratified by the median WC level in women. The relationship between peripheral PWV and uric acid was significant in women with WC <75 cm (P=0.031), but this relationship was not significant in the other groups (Table 2 and Fig. 1).
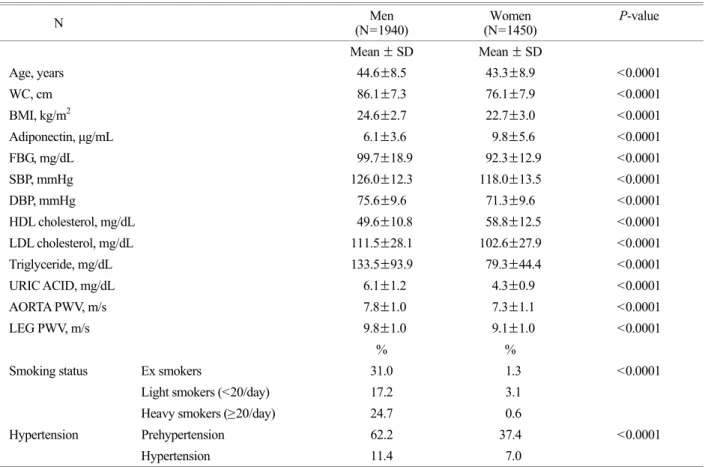
Table 3 shows logistic regression results in men and women. In women, hyperuricemia was associated with abnormal PWV (OR 1.58; 95% CI 1.03~2.43), but hyper- uricemia was not associated with abnormal PWV in men (OR 1.13; 95% CI 0.88~1.45). However, in men with nor- mal blood pressure, association of hyperuricemia with abnor- Table 1. General characteristics of participants (N=3390)
N Men
(N=1940) Women
(N=1450) P-value
Mean ± SD Mean ± SD
Age, years 44.6±8.5 43.3±8.9 <0.0001
WC, cm 86.1±7.3 76.1±7.9 <0.0001
BMI, kg/m
224.6±2.7 22.7±3.0 <0.0001
Adiponectin, μg/mL 6.1±3.6 9.8±5.6 <0.0001
FBG, mg/dL 99.7±18.9 92.3±12.9 <0.0001
SBP, mmHg 126.0±12.3 118.0±13.5 <0.0001
DBP, mmHg 75.6±9.6 71.3±9.6 <0.0001
HDL cholesterol, mg/dL 49.6±10.8 58.8±12.5 <0.0001
LDL cholesterol, mg/dL 111.5±28.1 102.6±27.9 <0.0001
Triglyceride, mg/dL 133.5±93.9 79.3±44.4 <0.0001
URIC ACID, mg/dL 6.1±1.2 4.3±0.9 <0.0001
AORTA PWV, m/s 7.8±1.0 7.3±1.1 <0.0001
LEG PWV, m/s 9.8±1.0 9.1±1.0 <0.0001
% %
Smoking status Ex smokers 31.0 1.3 <0.0001
Light smokers (<20/day) 17.2 3.1
Heavy smokers (≥20/day) 24.7 0.6
Hypertension Prehypertension 62.2 37.4 <0.0001
Hypertension 11.4 7.0
P-values refer to differences between groups as determined by t-test and χ
2test for continuous and categorical variables, respectively.
FBG: fasting plasma glucose, BMI: body mass index, WC: waist circumference, SBP: systolic blood pressure, DBP: diastolic blood
pressure, HDL: high density lipoprotein, LDL: low density lipoprotein
mal PWV was marginally significant (OR 1.71; 95% CI 0.96~3.06), and hyperuricemia was associated with abnor- mal PWV (OR 2.37; 95% CI 1.01~5.59) in male non- smokers or light smokers with normal blood pressure.
DISCUSSION
Relationships between arterial stiffness and uric acid have been widely analyzed over the past several years, with con- flicting results (Chen et al., 2010; Lim et al., 2010; Fang et al, 2014; Saijo et al., 2005; Bae et al., 2013). Fang et al.
(2014) reported that uric acid levels were associated with
the risk of arterial stiffness using peripheral PWV. Several other studies have also reported the association of uric acid with arterial stiffness (Saijo et al., 2005; Bae et al., 2013).
However, in several studies, uric acid levels were not associated with arterial stiffness in women (Chen et al., 2010; Lim et al., 2010). Another study in Korea reported that serum uric acid was associated with arterial stiffness in postmenopausal women (Park et al., 2012). Our results also demonstrate that hyperuricemia was associated with abnor- mal peripheral PWV in Korean women. The relationship between peripheral PWV and uric acid was stronger in lean women than in obese women. We also used aorta PWV, Table 2. Multiple linear regression analysis of Leg PWV
Men (N=1940)
Non or light male smokers (0~19/day)
(N=853)
Women (N=1450)
Women with WC <75 cm (N=682) Variables Regression
coefficients P value Regression
coefficients P value Regression
coefficients P value Regression
coefficients P value
Age 0.022 <0.0001 0.023 <0.0001 0.025 <0.0001 0.019 0.0003
BMI -0.079 <0.0001 -0.079 0.0015 -0.085 <0.0001 -0.087 0.0021
Waist 0.009 0.1128 0.009 0.3349 0.015 0.012 0.014 0.263
SBP 0.021 <0.0001 0.020 <0.0001 0.021 <0.0001 0.021 <0.0001
FBG 0.002 0.083 0.002 0.271 -0.001 0.651 -0.003 0.347
LDL-C -0.001 0.485 -0.001 0.780 -0.001 0.162 -0.002 0.219
HDL-C 0.002 0.852 0.001 0.974 -0.002 0.433 0.001 0.918
TG 0.0002 0.705 -0.001 0.680 0.001 0.031 -0.001 0.945
Uric acid 0.016 0.393 0.067 0.022 0.054 0.060 0.098 0.031
WC: Waist Circumference
Fig. 1. Mean levels of leg PWV in the quartile levels of PWV subgroup with nonsmoking or light smoking in men, and women with WC
<75 cm (WC: waist circumference, PWV: pulse wave velocity)
but it was not associated with uric acid levels in men and women. And the relationship between aorta PWV and uric acid was not associated in women with WC <75 cm (P=
0.0865) (Data not shown). Peripheral PWV was associated with uric acid levels in women, but it was not associated with uric acid levels in men. In a recent study in Taiwan, they reported that high serum uric acid was associated with greater risk of arterial stiffness in healthy women, but the relationship was not significant in men (Fang et al., 2014).
In another study, the relationship between arterial stiffness and uric acid was much stronger in women than in men (Kuo et al., 2010). One of the possible reasons for the discrepancy in results between men and women is the clear difference in smoking status between men and women. When the analyses were performed only in non-smokers and light smokers in the present study, peripheral PWV was associated with uric acid levels in men. In this study, we analyzed that the current smokers were divided into two groups (mild and heavy). Several other studies also reported a significant negative correlation between serum uric acid level and the smoking status including the average number of cigarettes smoked per day and the smoking duration (Haj Mouhamed et al., 2011; Slater et al., 1985). In the present study, we also used pack-years as a chronic parameter. However, when the analyses were performed only in non-smokers and smokers with less than 20 pack years, peripheral PWV was not asso-
ciated with uric acid in men (P=0.1414) (Data not shown).
The association of hyperuricemia with abnormal PWV was also marginally significant in men with normal blood pressure. In a study, arterial stiffness was increased in healthy Korean men (Shin et al., 2012). In the present study, hyper- uricemia was defined as the highest quartile of vales (≥6.9 mg/dL in men and 4.8 mg/dL in women). Several other studies also used the quartiles of serum uric acid (Lim et al., 2010; Fang et al., 2014; Shin et al., 2012; Ishizaka et al., 2007; Fang et al., 2000). A Japanese study reported that serum uric acid is associated with baPWV, and thus increased arterial stiffness (Ishizaka et al., 2007). In a cardiovascular disease study, compared with the lowest quartile of uric acid level, death rates for ischemic heart disease were signifi- cantly higher in quartile 4 for both men and women (Fang et al., 2000). Another recent study also reported that the highest quartile of serum uric acid (315.3~585.0 μmol/L) was positively associated with increased baPWV in women (Fang et al., 2014).
The mechanism underlying the relationship between uric acid and arterial stiffness remains unclear. However, it was shown that endothelial dysfunction was associated with hyperuricemia (Erdogan et al., 2005). High-normal uric acid levels may promote the development and progression of arterial stiffness by producing superoxide and oxidative stress via the xanthine oxidase pathway (Messerli et al., Table 3. Odds ratios (OR) of the abnormal peripheral PWV levels for abnormal uric acid levels in the population (n=3,390)
aNormal
(<10.323 m/s) Abnormal (≥10.323 m/s)
*Subjects Uric acid levels N (%) N (%) OR (95% CI
b) P-value
Men Normal 1084 (74.6) 360 (74.1) 1.00 (reference)
Abnormal (≥6.9 mg/dL) 370 (25.2) 126 (25.9) 1.13 (0.88~1.45) 0.3577 Men with normal blood pressure Normal 337 (79.9) 68 (75.6) 1.00 (reference)
Abnormal (≥6.9 mg/dL) 85 (20.1) 22 (24.4) 1.71 (0.96~3.06) 0.0696 Nonsmoking or light smoking men
with normal blood pressure Normal 153 (81.4) 28 (71.8) 1.00 (reference)
Abnormal (≥6.9 mg/dL) 35 (18.6) 11 (28.2) 2.37 (1.01~5.59) 0.0481
Women Normal 845 (77.2) 243 (68.5) 1.00 (reference)
Abnormal (≥4.8 mg/dL) 250 (22.8) 112 (31.6) 1.58 (1.03~2.43) 0.0374
a
Adjusted for age, systolic blood pressure, smoking status, fasting blood glucose levels, and body mass index
b