pISSN 2288-6575 • eISSN 2288-6796 https://doi.org/10.4174/astr.2021.100.2.86 Annals of Surgical Treatment and Research
Short- and mid-term outcomes of transanal versus laparoscopic total mesorectal excision for low rectal cancer: a meta-analysis
Jingqing Ren, Huixing Luo, Shaojie Liu, Bailin Wang, Fan Wu
Department of General Surgery, Guangzhou Red Cross Hospital, Medical College of Jinan University, Guangzhou, China
INTRODUCTION
Rectal cancer is a common malignant tumor of which low rectal cancer accounts for approximately 65%. The lesion is deep into the pelvis as the lower edge of the tumor being less than 5 cm from the dentate line, thus making operation more difficult [1]. The gold standard for curative resection remains total
mesorectal excision (TME), and the quality of the TME is one of the most important prognostic factors for local recurrence.
Laparoscopic TME (LaTME) is a classic surgical approach for low rectal cancer in recent years. Its safety, feasibility, and tumor radicalization has been confirmed by evidence-based medicine in recent years [2]. Proper TME specimens with negative resection margins are inherently challenging due to patient and
Received July 9, 2020, Revised September 30, 2020, Accepted November 3, 2020
Corresponding Author: Shaojie Liu
Department of General Surgery, Guangzhou Red Cross Hospital, Medical College of Jinan University, 396 Tongfu Middle Rd, Haizhu District, Guangzhou 510220, China
Tel: +86-13512789765, Fax: +86-20-84412233 E-mail: 51242743@qq.com
ORCID: https://orcid.org/0000-0001-8390-714X
Copyright ⓒ 2021, the Korean Surgical Society
cc Annals of Surgical Treatment and Research is an Open Access Journal. All articles are distributed under the terms of the Creative Commons Attribution Non- Commercial License (http://creativecommons.org/licenses/by-nc/4.0/) which permits unrestricted non-commercial use, distribution, and reproduction in any medium, provided the original work is properly cited.
Purpose: The current meta-analysis combining mid and low rectal cancer with no meta-analysis only for low rectal cancer was seen. This meta-analysis was to compare the short- and mid-term outcomes of the transanal total mesorectal excision (TaTME) vs. laparoscopic total mesorectal excision (LaTME) for low rectal cancer.
Methods: A systematic literature search was conducted using the web-based databases; China National Knowledge Infrastructure, Chinese BioMedical Database, PubMed, Embase, Cochrane Central Register of Controlled Trials, and Wanfang Database. Randomized controlled trials (RCTs) were evaluated using the Jadad scale and non-RCTs (NRCs) were evaluated using the Newcastle-Ottawa Scale.
Results: Ten studies (2 RCTs and 8 NRCs) involving 772 patients were included. Among them, 378 patients underwent TaTME and 394 patients underwent LaTME. Compared with the LaTME group, the conversion rate was low (risk ratio [RR], 0.25; 95% confidence interval [CI], 0.11–0.54; P < 0.001), the circumferential resection margin (CRM) involvement was low (RR, 0.48; 95% CI, 0.27–0.86; P = 0.010), and the hospital stay was short (mean difference, –1.72; 95% CI, –2.89 to –0.55;
P = 0.004) in the TaTME group. No significant differences were seen in the mesorectal resection quality, CRM distance, distal resection margin (DRM) involvement, DRM distance, local R1 resection, intraoperative complications, morbidity, anastomotic leakage, severe morbidity, mortality, operative time, intraoperative blood loss, harvested lymph nodes, and local recurrence rate (P > 0.05).
Conclusion: The TaTME is a promising surgical technique and is fully a safe and efficacious option in managing low rectal cancer.
[Ann Surg Treat Res 2021;100(2):86-99]
Key Words: Laparoscopic surgery, Rectal cancer, Transanal endoscopic surgical procedures
tumor-related factors. These difficulties have not been overcome with the advent of the laparoscopic approach. Transanal TME (TaTME) is an innovative surgical technique developed to overcome the limitations in exposure and instrumentation in low pelvic surgery. It was suggested that TaTME appeared to be superior to LaTME for mid-to-low rectal cancer by meta-analysis [3,4], but these studies did not distinguish between mid rectal cancer and low rectal cancer. Most of the TaTME studies [5]
reported that the distal rectal margin of rectal cancer was less than 5 cm. Therefore, distal resection of the mesorectum was also less than 5 cm, which was unable to achieve the TME principle for mid rectal cancer. For mid rectal cancer, the transabdominal approach itself is not too difficult, whereas the transanal approach increases the difficulty of surgery instead.
Also, for low rectal cancer, difficulty existed in exposure with transabdominal approach. However, the proposal of TaTME provided a new method to solve this problem. TaTME for rectal malignancies is largely referred to as treatment of mid to low, especially low, rectal cancer. There is currently no precise definition for low rectal cancer. Chen et al. [6] believe that low rectal cancer should be defined as cancer below the peritoneal reflex, generally less than 7 cm from the anal verge.
The current meta-analysis combines mid and low rectal cancer.
For low rectal cancer, it is still inconclusive whether TaTME is more advantageous [7], and any meta-analysis purely for low rectal cancer is not seen yet. Therefore, this study conducted a meta-analysis of TaTME and LaTME comparative studies for low rectal cancer to provide a basis to evaluate the safety and efficacy of the procedure.
METHODS
Institutional Review Board approval for this study was obtained from Guangzhou Red Cross Hospital, Medical College of Jinan University (No. 2020-162-01), and the written informed consent from the patient was exempted.
A systematic literature search was conducted using the web- based databases, China National Knowledge Infrastructure, Chinese BioMedical Database, PubMed, Embase, Cochrane Central Register of Controlled Trials, and Wanfang Database from database establishment to May 2020. Search terms included the following words: (transanal total mesorectal excision OR TaTME OR transanal minimally invasive surgery OR TAMIS OR natural orifice transluminal endoscopic surgery OR NOTES) AND (laparoscopy OR laparoscopic OR laparoscopic- assisted) AND (total mesorectal excision OR TME) AND (rectal cancer OR rectal carcinoma OR rectal adenocarcinoma OR rectal neoplasms). Published studies were considered for inclusion if they met the following criteria: the study design was randomized controlled trials (RCTs) or cohort studies, or matched case-control studies; the study population comprised
patients definitely diagnosed with low rectal cancer (the distance of the tumor from the anal verge was less than 7 cm);
outcomes of interest were compared between the TaTME and LaTME groups; outcome indicators included at least one of the least: intraoperative indicators, postoperative complications, oncology index, and follow-up results. If there are duplicates in the literature, choose the latest one. Whereas, studies with benign lesions only, or no distinct group of malignant rectal tumor, studies on other surgical methods, studies in languages other than English or Chinese, and correspondences, letters, case reports, reviews, meta-analysis, and conference abstracts were excluded.
The initial studies were retrieved, and data were extracted independently by 2 investigators (JR and HR), and any disagreements were resolved by consulting another author (SL).
The extracted information mainly included: basic information, including author, year, country, etc.; baseline characteristics of the study, including sample size of each group, patient age, sex, body mass index (BMI), American Society of Anesthesiologists physical status (ASA PS) classification [8], TNM stage; the main outcome indicators included conversion, mesorectal resection quality, circumferential resection margin (CRM) involvement, CRM distance, distal resection margin (DRM) involvement, DRM distance, local R1 resection, intraoperative complications, morbidity, anastomotic leakage, severe morbidity, mortality, and local recurrence; secondary outcome indicators included operative time, intraoperative blood loss, harvested lymph nodes, and hospital stay. RCTs were evaluated using the Jadad scale [9] and non-RCTs (NRCs) were evaluated using the Newcastle-Ottawa Scale [10].
All analyses were performed using Review Manager (ver.
5.3, Cochrane Collaboration; available at http://community.
cochrane.org/tools/review-production-tools/revman-5). For dichotomous data, risk ratios (RRs) and 95% confidence intervals (CIs) were generated for comparison between TaTME and LaTME. For continuous data, mean differences (MDs) and 95% CIs were generated. It was considered indicative of low, moderate and high heterogeneity when I2 ≤ 25%, 25% < I2 <
50%, and I2 ≥ 50%, respectively. When no obvious inter-study heterogeneity was identified from an I2 test, the results of the fixed-effect model were also provided for reference. If there was statistical heterogeneity among the results of each study, the source of heterogeneity was further analyzed. After excluding the influence of obvious clinical heterogeneity, the random effect model was applied. Sensitivity analysis was applied for significant heterogeneity. Differences were considered statistically significant at a P-value of ≤0.05.
RESULTS
Characteristics of included studies
A total of 804 relevant publications were identified on initial literature search. Of these, 2 RCT [11,12] and 8 NRCs [6,13-19]
with high quality, involving 772 patients, met the inclusion criteria. The study selection process was illustrated in Fig. 1.
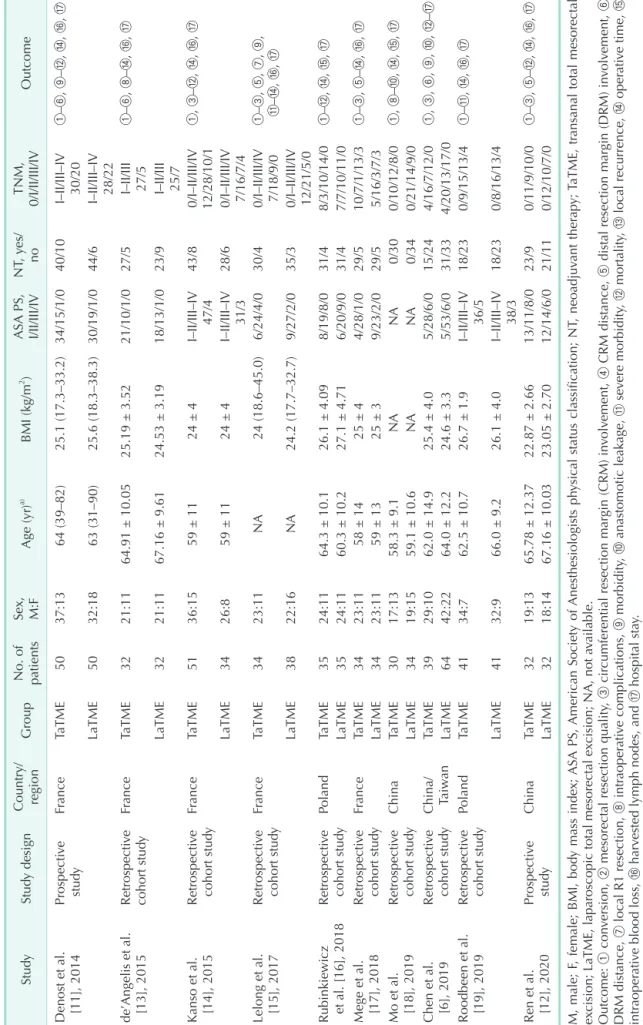
Among these, 378 patients (49.0%) underwent TaTME and 394 (51.0%) underwent LaTME. The characteristics of the studies were shown in Table 1. No statistically significant differences were seen in baseline data such as age, sex, BMI, ASA PS classification, neoadjuvant therapy, and TNM stage between the 2 groups. The RCTs with a score of 4 on the Jadad scale was considered to be of high quality. All NRCs ranging from 7 to 8 stars on the Newcastle-Ottawa Scale were indicative of high quality, shown in Table 2.
Meta-analysis results
Conversion
Conversion was defined as a procedure that was started with the intention of performing a laparoscopic dissection but was completed as an open resection requiring a midline laparotomy. Ten studies [6,11-19] mentioned the conversion.
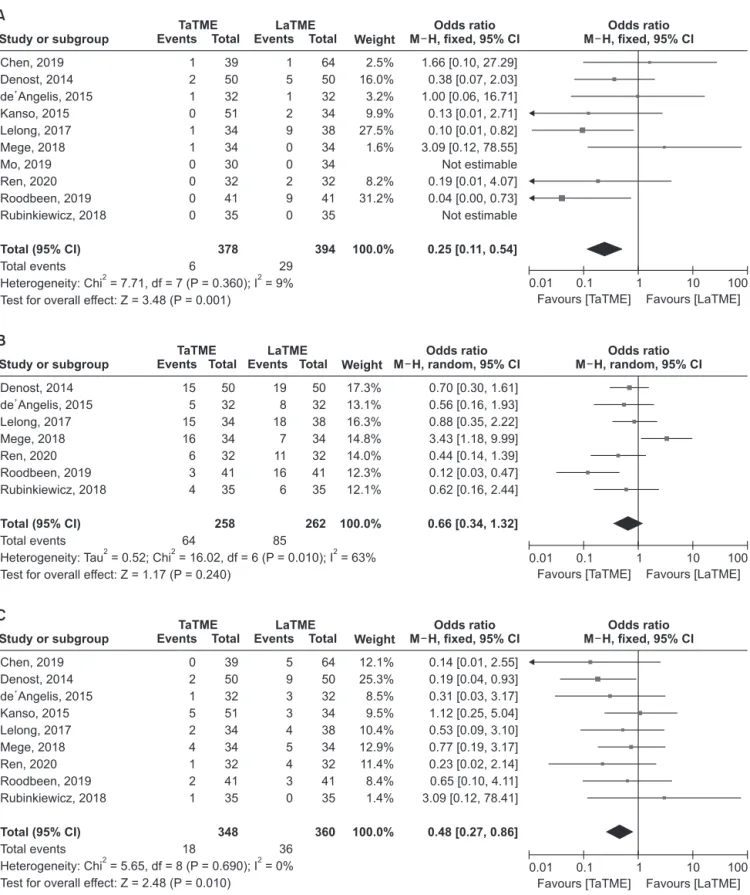
The conversions were significantly lower in TaTME group as compared to those in LaTME group (RR, 0.25; 95% CI, 0.11–0.54;
P = 0.001). Additionally, heterogeneity among the studies was not significant (P = 0.360, I2 = 9%) (Fig. 2A).
Mesorectal resection quality
Seven studies [11-13,15-17,19] reported mesorectal resection quality. No significant difference was discovered between the 2 groups with respect to mesorectal resection quality (RR, 0.66;
95% CI, 0.34–1.32; P = 0.240). Nonetheless, heterogeneity was obviously significant (P = 0.010, I2 = 63%) and the random
effects model was used (Fig. 2B).
Circumferential resection margin involvement
Nine studies [6,11-17,19] reported the CRM involvement, the rate of CRM involvement was significantly lower in TaTME group as compared to those for LaTME group (RR, 0.48; 95% CI, 0.27–0.86; P = 0.010). No heterogeneity was observed in CRM involvement (P = 0.690, I2 = 0%) (Fig. 2C).
Circumferential resection margin distance
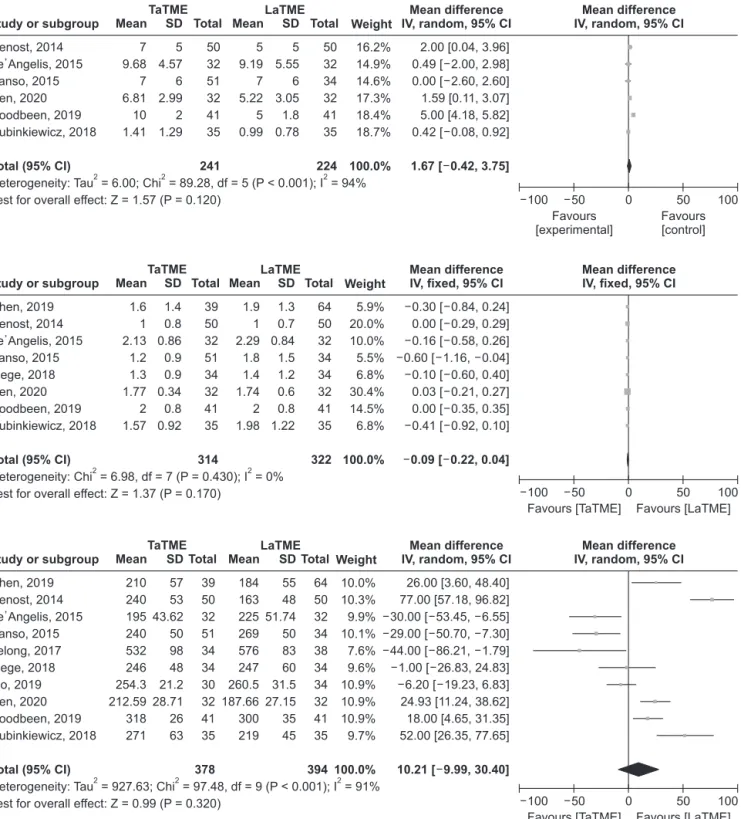
Six studies [11-14,16,19] described the data. The intergroup difference in terms of DRM distance was not significant (MD, 1.67; 95% CI, –0.42–3.75; P = 0.120). However, heterogeneity was highly significant (P < 0.001, I2 = 94%); therefore, the random effects model was used (Fig. 3A).
Distal resection margin involvement
Eight studies [11-17,19] revealed DRM involvement. No significant difference was discovered between the 2 groups with respect to DRM involvement (RR, 0.67; 95% CI, 0.30–1.49; P
= 0.330). Heterogeneity among the studies was not significant (P
= 0.420, I2 = 1%) (Fig. 2D).
Distal resection margin distance
Eight studies [6,11-14,16,17,19] described the DRM distance.
No significant difference was observed when comparing TaTME group with LaTME group in DRM distance (MD, –0.09; 95% CI, –0.22–0.04, P = 0.170). Heterogeneity was not significant again (P = 0.430, I2 = 0%) (Fig. 3B).
Local R1 resection
Six studies [12,14-17,19] revealed the local R1 resection.
No significant difference was found with respect to local R1 resection between the 2 groups (RR, 0.68; 95% CI, 0.38–1.22; P
= 0.190). Meanwhile, no heterogeneity was observed in this
Records identified through database searching (n = 804)
Records after duplicate removed (n = 572)
Full-text articles assessed for eligibility (n = 181)
Studies included in qualitative synthesis (n = 11)
Eligible studies included in meta-analysis (n = 10)
After screening titles and abstracts excluded Letters (n = 31)
Expert opinions (n = 28) Commentaries (n = 32) Review articles (n = 76) Other themes (n = 224)
Full-text articles excluded Non-comparative studies (n = 134) Reporting on robotic approach (n = 36)
Not low rectal cancer (n = 1)
Fig. 1. Schematic illustration for literature search and inclusion of studies in the meta-analysis.
Table 1. Clinical and demographic characteristics of included studies in the meta-analysis StudyStudy designCountry/ regionGroup No. of patients
Sex, M:FAge (yr)a) BMI (kg/m2 )ASA PS, I/II/III/IVNT, yes/ noTNM, 0/I/II/III/IVOutcome Denost et al. [11], 2014Prospective studyFranceTaTME5037:1364 (39–82)25.1 (17.3–33.2)34/15/1/040/10I–II/III–IV 30/20①–⑥, ⑨–⑫, ⑭, ⑯, ⑰ LaTME5032:1863 (31–90)25.6 (18.3–38.3)30/19/1/044/6I–II/III–IV 28/22 de’Angelis et al. [13], 2015Retrospective cohort studyFranceTaTME3221:1164.91 ± 10.0525.19 ± 3.5221/10/1/027/5I–II/III 27/5①–⑥, ⑧–⑭, ⑯, ⑰ LaTME3221:1167.16 ± 9.6124.53 ± 3.1918/13/1/023/9I–II/III 25/7 Kanso et al. [14], 2015Retrospective cohort studyFranceTaTME5136:1559 ± 1124 ± 4I–II/III–IV 47/443/80/I–II/III/IV 12/28/10/1①, ③–⑫, ⑭, ⑯, ⑰ LaTME3426:859 ± 1124 ± 4I–II/III–IV 31/328/60/I–II/III/IV 7/16/7/4 Lelong et al. [15], 2017Retrospective cohort studyFranceTaTME3423:11NA24 (18.6–45.0)6/24/4/030/40/I–II/III/IV 7/18/9/0①–③, ⑤, ⑦, ⑨, ⑪–⑭, ⑯, ⑰ LaTME3822:16NA24.2 (17.7–32.7)9/27/2/035/30/I–II/III/IV 12/21/5/0 Rubinkiewicz et al. [16], 2018Retrospective cohort studyPolandTaTME3524:1164.3 ± 10.126.1 ± 4.098/19/8/031/48/3/10/14/0①–⑫, ⑭, ⑮, ⑰ LaTME3524:1160.3 ± 10.227.1 ± 4.716/20/9/031/47/7/10/11/0 Mege et al. [17], 2018Retrospective cohort studyFranceTaTME3423:1158 ± 1425 ± 44/28/1/029/510/7/1/13/3①–③, ⑤–⑭, ⑯, ⑰ LaTME3423:1159 ± 1325 ± 39/23/2/029/55/16/3/7/3 Mo et al. [18], 2019Retrospective cohort studyChinaTaTME3017:1358.3 ± 9.1NANA0/300/10/12/8/0①, ⑧–⑩, ⑭, ⑮, ⑰ LaTME3419:1559.1 ± 10.6NANA0/340/21/14/9/0 Chen et al. [6], 2019Retrospective cohort studyChina/ TaiwanTaTME3929:1062.0 ± 14.925.4 ± 4.05/28/6/015/244/16/7/12/0①, ③, ⑥, ⑨, ⑩, ⑫–⑰ LaTME6442:2264.0 ± 12.224.6 ± 3.35/53/6/031/334/20/13/17/0 Roodbeen et al. [19], 2019Retrospective cohort studyPolandTaTME4134:762.5 ± 10.726.7 ± 1.9I–II/III–IV 36/518/230/9/15/13/4①–⑪, ⑭, ⑯, ⑰ LaTME4132:966.0 ± 9.226.1 ± 4.0I–II/III–IV 38/318/230/8/16/13/4 Ren et al. [12], 2020Prospective studyChinaTaTME3219:1365.78 ± 12.3722.87 ± 2.6613/11/8/023/90/11/9/10/0①–③, ⑤–⑫, ⑭, ⑯, ⑰ LaTME3218:1467.16 ± 10.0323.05 ± 2.7012/14/6/021/110/12/10/7/0 M, male; F, female; BMI, body mass index; ASA PS, American Society of Anesthesiologists physical status classification; NT, neoadjuvant therapy; TaTME, transanal total mesorectal excision; LaTME, laparoscopic total mesorectal excision; NA, not available. Outcome: ① conversion, ② mesorectal resection quality, ③ circumferential resection margin (CRM) involvement, ④ CRM distance, ⑤ distal resection margin (DRM) involvement, ⑥ DRM distance, ⑦ local R1 resection, ⑧ intraoperative complications, ⑨ morbidity, ⑩ anastomotic leakage, ⑪ severe morbidity, ⑫ mortality, ⑬ local recurrence, ⑭ operative time, ⑮ intraoperative blood loss, ⑯ harvested lymph nodes, and ⑰ hospital stay. a) Median (range) or mean ± standard deviation.
respect (P = 0.440, I2 = 0%) (Fig. 2E).
Intraoperative complications
Seven studies [12-14,16-19] described the intraoperative complications. Pooled analysis indicated that the intergroup difference in terms of intraoperative complications was not significant (RR, 1.90; 95% CI, 0.84–4.29; P = 0.120). Heterogeneity among the studies was not significant (P = 0.660, I2 = 0%) (Fig.
2F).
Morbidity
All studies [6,11-19] revealed morbidity, whose intergroup difference was not statistically significant (RR, 0.84; 95% CI, 0.61–1.16; P = 0.290). Again, heterogeneity across the studies was not significant (P = 0.880, I2 = 0%) and the fixed effects model was used (Fig. 2G).
Anastomotic leakage
Nine studies [6,11-14,16-19] described the data. Pooled analysis indicated that the intergroup difference in terms of severe morbidity was not statistically significant (RR, 0.79; 95%
CI, 0.48–1.31; P = 0.360), again with no heterogeneity (P = 0.310, I2 = 15%) (Fig. 2H).
Severe morbidity
Severe morbidity was described as Clavien-Dindo classification III–V [20]. Eight studies [11-17,19] reported the data. Pooled analysis demonstrated no significant difference with respect to the rates of severe morbidity (RR, 0.83; 95% CI, 0.51–1.35; P = 0.450). No heterogeneity was observed (P = 0.690, I2 = 0%) (Fig.
2I).
Mortality
Only 2 studies [11,14] had perioperative mortality, which were similar between the 2 groups (RR, 0.81; 95% CI, 0.11–6.16; P = 0.840). The heterogeneity was not significant (P = 0.430, I2 = 0%) (Fig. 2J).
Local recurrence
Only 4 eligible studies [6,13,15,17] mentioned local recurrence.
No significant difference was found with respect to local recurrence between the 2 groups (RR, 0.55; 95% CI, 0.15–2.07;
P = 0.380). Meanwhile, no heterogeneity was observed in this respect (P = 0.660, I2 = 0%) (Fig. 2K). However, the follow-up time was quite different among different groups. The mean follow-up was 32.06 months for the TaTME group and 62.91 months for the LaTME group in the study of de’Angelis et al. [13], 31.9 months and 60.3 months in the study of Lelong et al. [15], 13 months and 25 months in the study of Mege et al. [17], and 26.3 months in the study of Chen et al. [6].
Table 2. Newcastle-Ottawa Scale of the included studies Study
Selection Comparability
Outcome
Total score
Representativeness score of exposed cohort
Selection of the non-exposed
cohort
Ascertainment of exposure
Outcome of interest not present at start
Assessment of outcome
Length of follo
w-upAdequacy of follow-up de’Angelis et al. [13], 2015110121118 Kanso et al. [14], 2015110121118 Lelong et al. [15], 2017110111117 Rubinkiewicz et al. [16], 2018110121118 Mege et al. [17], 2018110121118 Mo et al. [18], 2019110111117 Chen et al. [6], 2019110111117 Roodbeen et al. [19], 2019110121118
Study or subgroup
TaTME LaTME
Chen, 2019 Denost, 2014 de Angelis, 2015 Kanso, 2015 Lelong, 2017 Mege, 2018 Ren, 2020 Roodbeen, 2019 Rubinkiewicz, 2018
Total events
Heterogeneity: Chi = 5.65, df = 8 (P = 0.690); I = 0%
Test for overall effect: Z = 2.48 (P = 0.010) Total (95% CI)
2 2
0 2 1 5 2 4 1 2 1
18 Events Total
39 50 32 51 34 34 32 41 35 348
Weight 12.1%
25.3%
8.5%
9.5%
10.4%
12.9%
11.4%
8.4%
1.4%
100.0%
5 9 3 3 4 5 4 3 0
36 64 50 32 34 38 34 32 41 35 360 Events Total
0.14 [0.01, 2.55]
0.19 [0.04, 0.93]
0.31 [0.03, 3.17]
1.12 [0.25, 5.04]
0.53 [0.09, 3.10]
0.77 [0.19, 3.17]
0.23 [0.02, 2.14]
0.65 [0.10, 4.11]
3.09 [0.12, 78.41]
0.48 [0.27, 0.86]
Odds ratio M H, fixed, 95% CI
Favours [TaTME] Favours [LaTME]
Odds ratio M H, fixed, 95% CI
100
0.01 0.1 1 10
C
Study or subgroup
TaTME LaTME
Chen, 2019 Denost, 2014 de Angelis, 2015 Kanso, 2015 Lelong, 2017 Mege, 2018 Mo, 2019 Ren, 2020 Roodbeen, 2019 Rubinkiewicz, 2018
Total events
Heterogeneity: Chi = 7.71, df = 7 (P = 0.360); I = 9%
Test for overall effect: Z = 3.48 (P = 0.001) Total (95% CI)
2 2
1 2 1 0 1 1 0 0 0 0
6 Events Total
39 50 32 51 34 34 30 32 41 35 378
Weight 2.5%
16.0%
3.2%
9.9%
27.5%
1.6%
8.2%
31.2%
100.0%
1 5 1 2 9 0 0 2 9 0
29 64 50 32 34 38 34 34 32 41 35 394 Events Total
1.66 [0.10, 27.29]
0.38 [0.07, 2.03]
1.00 [0.06, 16.71]
0.13 [0.01, 2.71]
0.10 [0.01, 0.82]
3.09 [0.12, 78.55]
Not estimable 0.19 [0.01, 4.07]
0.04 [0.00, 0.73]
Not estimable 0.25 [0.11, 0.54]
Odds ratio M H, fixed, 95% CI
Favours [TaTME] Favours [LaTME]
Odds ratio M H, fixed, 95% CI
100
0.01 0.1 1 10
A
Study or subgroup
TaTME LaTME
Denost, 2014 de Angelis, 2015 Lelong, 2017 Mege, 2018 Ren, 2020 Roodbeen, 2019 Rubinkiewicz, 2018
Total events
Heterogeneity: Tau = 0.52; Chi = 16.02, df = 6 (P = 0.010); I = 63%
Test for overall effect: Z = 1.17 (P = 0.240) Total (95% CI)
2 2 2
15 5 15 16 6 3 4
64 Events Total
50 32 34 34 32 41 35 258
Weight 17.3%
13.1%
16.3%
14.8%
14.0%
12.3%
12.1%
100.0%
19 8 18 7 11 16 6
85 50 32 38 34 32 41 35 262 Events Total
0.70 [0.30, 1.61]
0.56 [0.16, 1.93]
0.88 [0.35, 2.22]
3.43 [1.18, 9.99]
0.44 [0.14, 1.39]
0.12 [0.03, 0.47]
0.62 [0.16, 2.44]
0.66 [0.34, 1.32]
Odds ratio M H, random, 95% CI
Favours [TaTME] Favours [LaTME]
Odds ratio M H, random, 95% CI
100
0.01 0.1 1 10
B
Fig. 2. Forest plots of risk ratio between transanal total mesorectal excision (TaTME) group and laparoscopic total mesorectal excision (LaTME) group. (A) Conversion. (B) Mesorectal resection quality. (C) Circumferential resection margin involvement. (D) Distal resection margin involvement. (E) Local R1 resection. (F) Intraoperative complications. (G) Morbidity. (H) Anastomotic leakage. (I) Severe morbidity. (J) Mortality. (K) Local recurrence. CI, confidence interval; df, degree of freedom.
Operative time
All studies [6,11-19] described the operative time. Pooled analysis indicated that the intergroup difference in terms of operative time was not significant (MD, 10.21; 95% CI, –9.99–
30.40; P = 0.320). Nevertheless, a significant heterogeneity was observed (P < 0.001, I2 = 91%) (Fig. 3C). Six studies [6,11,12,16- 18] adopted a 1-team approach, 1 study [13] adopted a 2-team approach, it was not mentioned in 3 studies [14,15,19].
Intraoperative blood loss
Only 3 eligible studies [6,16,18] reported the data. Pooled analysis demonstrated no significant difference with respect to the intraoperative blood loss (MD, 13.99; 95% CI, –16.39–44.37, P = 0.370). The heterogeneity was significant (P = 0.050, I2 = 66%) (Fig. 3D).
Study or subgroup
TaTME LaTME
Kanso, 2015 Lelong, 2017 Mege, 2018 Ren, 2020 Roodbeen, 2019 Rubinkiewicz, 2018
Total events
Heterogeneity: Chi = 4.83, df = 5 (P = 0.440); I = 0%
Test for overall effect: Z = 1.31 (P = 0.190) Total (95% CI)
2 2
8 2 5 1 2 5
23 Events Total
51 34 34 32 41 35 227
Weight 11.1%
13.0%
18.7%
21.2%
17.3%
18.8%
100.0%
3 4 6 6 5 6
30 34 38 34 32 41 35 214 Events Total
1.92 [0.47, 7.83]
0.53 [0.09, 3.10]
0.80 [0.22, 2.94]
0.14 [0.02, 1.24]
0.37 [0.07, 2.02]
0.81 [0.22, 2.93]
0.68 [0.38, 1.22]
Odds ratio M H, fixed, 95% CI
Favours [TaTME] Favours [LaTME]
Odds ratio M H, fixed, 95% CI
100
0.01 0.1 1 10
E
Study or subgroup
TaTME LaTME
Denost, 2014 de Angelis, 2015 Kanso, 2015 Lelong, 2017 Mege, 2018 Ren, 2020 Roodbeen, 2019 Rubinkiewicz, 2018
Total events
Heterogeneity: Chi = 7.07, df = 7 (P = 0.420); I = 1%
Test for overall effect: Z = 0.98 (P = 0.330) Total (95% CI)
2 2
1 2 4 0 1 0 0 0
8 Events Total
50 32 51 34 34 32 41 35 309
Weight 26.7%
3.1%
3.7%
9.5%
6.6%
16.8%
23.5%
10.1%
100.0%
4 0 0 1 1 2 3 1
12 50 32 34 38 34 32 41 35 296 Events Total
0.23 [0.03, 2.18]
5.33 [0.25, 115.50]
6.54 [0.34, 125.45]
0.36 [0.01, 9.19]
1.00 [0.06, 16.67]
0.19 [0.01, 4.07]
0.13 [0.01, 2.65]
0.32 [0.01, 8.23]
0.67 [0.30, 1.49]
Odds ratio M H, fixed, 95% CI
Favours [TaTME] Favours [LaTME]
Odds ratio M H, fixed, 95% CI
100
0.01 0.1 1 10
D
Study or subgroup
TaTME LaTME
de Angelis, 2015 Kanso, 2015 Mege, 2018 Mo, 2019 Ren, 2020 Roodbeen, 2019 Rubinkiewicz, 2018
Total events
Heterogeneity: Chi = 3.23, df = 5 (P = 0.660); I = 0%
Test for overall effect: Z = 1.54 (P = 0.120) Total (95% CI)
2 2
0 1 7 2 2 1 4
17 Events Total
32 51 34 30 32 41 35 255
Weight
6.7%
18.3%
10.1%
10.8%
33.7%
20.4%
100.0%
0 0 2 1 1 3 2
9 32 34 34 34 32 41 35 242 Events Total
Not estimable 2.05 [0.08, 51.80]
4.15 [0.79, 21.66]
2.36 [0.20, 27.39]
2.07 [0.18, 24.01]
0.32 [0.03, 3.18]
2.13 [0.36, 12.46]
1.90 [0.84, 4.29]
Odds ratio M H, fixed, 95% CI
Favours [TaTME] Favours [LaTME]
Odds ratio M H, fixed, 95% CI
100
0.01 0.1 1 10
F
Fig. 2. Continued 1.
Harvested lymph nodes
Eight studies [6,11-15,17,19] described the data. Pooled analysis manifested that the harvested lymph nodes were comparable
in TaTME group and in LaTME group (MD, 1.16; 95% CI, –0.56–
2.87; P = 0.190), but the heterogeneity was significant (P = 0.007, I2 = 64%) (Fig. 3E).
Study or subgroup
TaTME LaTME
Chen, 2019 Denost, 2014 de Angelis, 2015 Kanso, 2015 Lelong, 2017 Mege, 2018 Mo, 2019 Ren, 2020 Roodbeen, 2019 Rubinkiewicz, 2018
Total events
Heterogeneity: Chi = 4.51, df = 9 (P = 0.880); I = 0%
Test for overall effect: Z = 1.07 (P = 0.290) Total (95% CI)
2 2
4 16 8 24 11 7 6 6 19 6
107 Events Total
39 50 32 51 34 34 30 32 41 35 378
Weight 5.9%
18.5%
11.1%
12.6%
11.1%
9.8%
8.4%
5.0%
9.3%
8.2%
100.0%
7 22 12 16 14 10 9 5 14 8
117 64 50 32 34 38 34 34 32 41 35 394 Events Total
0.93 [0.25, 3.41]
0.60 [0.27, 1.35]
0.56 [0.19, 1.63]
1.00 [0.42, 2.39]
0.82 [0.31, 2.17]
0.62 [0.20, 1.89]
0.69 [0.21, 2.25]
1.25 [0.34, 4.59]
1.67 [0.68, 4.06]
0.70 [0.21, 2.28]
0.84 [0.61, 1.16]
Odds ratio M H, fixed, 95% CI
Favours [TaTME] Favours [LaTME]
Odds ratio M H, fixed, 95% CI
100
0.01 0.1 1 10
G
Study or subgroup
TaTME LaTME
Chen, 2019 Denost, 2014 de Angelis, 2015 Kanso, 2015 Mege, 2018 Mo, 2019 Ren, 2020 Roodbeen, 2019 Rubinkiewicz, 2018
Total events
Heterogeneity: Chi = 9.40, df = 8 (P = 0.310); I = 15%
Test for overall effect: Z = 0.92 (P = 0.360) Total (95% CI)
2 2
1 1 3 14 1 3 2 5 3
33 Events Total
39 50 32 51 34 30 32 41 35 344
Weight 1.1%
14.3%
18.5%
15.2%
14.2%
4.9%
8.2%
10.2%
13.3%
100.0%
0 5 7 6 5 2 3 4 5
37 64 50 32 34 34 34 32 41 35 356 Events Total
5.03 [0.20, 126.47]
0.18 [0.02, 1.63]
0.37 [0.09, 1.58]
1.77 [0.60, 5.17]
0.18 [0.02, 1.59]
1.78 [0.28, 11.43]
0.64 [0.10, 4.14]
1.28 [0.32, 5.17]
0.56 [0.12, 2.56]
0.79 [0.48, 1.31]
Odds ratio M H, fixed, 95% CI
Favours [TaTME] Favours [LaTME]
Odds ratio M H, fixed, 95% CI
100
0.01 0.1 1 10
H
Study or subgroup
TaTME LaTME
Denost, 2014 de Angelis, 2015 Kanso, 2015 Lelong, 2017 Mege, 2018 Ren, 2020 Roodbeen, 2019 Rubinkiewicz, 2018
Total events
Heterogeneity: Chi = 4.78, df = 7 (P = 0.690); I = 0%
Test for overall effect: Z = 0.75 (P = 0.450) Total (95% CI)
2 2
6 2 8 2 4 2 9 3
36 Events Total
50 32 51 34 34 32 41 35 309
Weight 17.2%
13.1%
14.1%
17.4%
4.9%
7.9%
15.2%
10.2%
100.0%
7 5 5 7 2 3 7 4
40 50 32 34 38 34 32 41 35 296 Events Total
0.84 [0.26, 2.70]
0.36 [0.06, 2.01]
1.08 [0.32, 3.63]
0.28 [0.05, 1.44]
2.13 [0.36, 12.51]
0.64 [0.10, 4.14]
1.37 [0.46, 4.10]
0.73 [0.15, 3.51]
0.83 [0.51, 1.35]
Odds ratio M H, fixed, 95% CI
Favours [TaTME] Favours [LaTME]
Odds ratio M H, fixed, 95% CI
100
0.01 0.1 1 10
I
Fig. 2. Continued 2.
Hospital stay
Hospital stay was reported in 8 studies [6,13-19]. The hospital stay was significantly shorter in TaTME group than that in LaTME group (MD, –1.72; 95% CI, –2.89 to –0.55; P = 0.004).
However, the heterogeneity was obvious (P < 0.001, I2 = 79%) (Fig. 3F).
Sensitivity analysis
Sensitivity analysis was performed on outcomes with high heterogeneity (mesorectal resection quality, CRM distance, operative time, intraoperative blood loss, harvested lymph nodes, and hospital stay), and each study was excluded 1 by 1 to test the stability of relevant results. For mesorectal resection quality (RR, 0.66; 95% CI, 0.34–1.32; P = 0.240, I2 = 63%), after removing the study of Mege et al. [17], pooled analysis indicated that the TaTME group had better results (RR, 0.53;
95% CI, 0.32–0.88; P = 0.010, I2 = 21%). For CRM distance (MD, 1.67; 95% CI, –0.42–3.75; P = 0.120, I2 = 94%), pooled analysis demonstrated that of the TaTME group was longer (MD, 0.69;
95% CI, 0.12–1.26; P = 0.020, I2 = 9%) after removing the study of Roodbeen et al. [19]. Also, intraoperative blood loss was less in LaTME group (MD, 29.99; 95% CI, 0.39–59.59; P = 0.050, I2
= 0%) after removing the study of Mo et al. [18]. For operative
time, harvested lymph nodes, and hospital stay, the change of I2 value was not obvious after we excluded each study 1 by 1, and the statistical results of combined effect were not reversed, indicating the stability of each study.
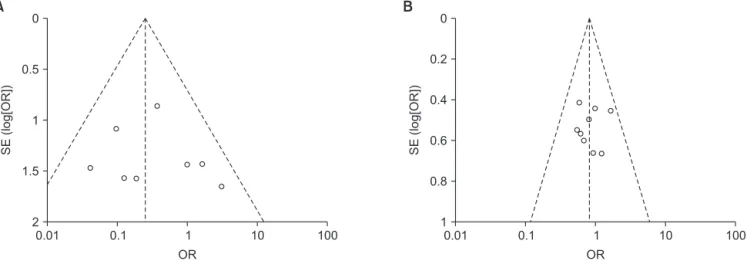
Publication bias
Funnel plot analysis based on conversion (Fig. 4A) and morbidity (Fig. 4B) did not indicate significant publication bias.
No obvious asymmetry was observed in the shape of the funnel plot.
DISCUSSION
Since Heald et al. proposed the theory of TME for rectal cancer in 1982 [19], this principle became the gold standard for middle and low rectal cancer surgery. Laparoscopic surgery was conditionally recommended in the treatment of rectal cancer in the 2016 edition of the National Comprehensive Cancer Network (NCCN), “Clinical Practice Guidelines for Rectal Cancer” [21]. However, for male, obesity, and lower rectal cancer patients with narrow pelvis, difficulty existed in exposure whether with open approach or laparoscopic surgery [21], which lead to incomplete resection of rectal mesentery, insufficient
Study or subgroup
TaTME LaTME
Chen, 2019 Denost, 2014 de Angelis, 2015 Kanso, 2015 Lelong, 2017 Mege, 2018 Ren, 2020 Rubinkiewicz, 2018
Total events
Heterogeneity: Chi = 0.62, df = 1 (P = 0.430); I = 0%
Test for overall effect: Z = 0.20 (P = 0.840) Total (95% CI)
2 2
0 0 0 1 0 0 0 0
1 Events Total
39 50 32 51 34 34 32 35 307
Weight
71.9%
28.1%
100.0%
0 1 0 0 0 0 0 0
1 64 50 32 34 38 34 32 35 319 Events Total
Not estimable 0.33 [0.01, 8.21]
Not estimable 2.05 [0.08, 51.80]
Not estimable Not estimable Not estimable Not estimable 0.81 [0.11, 6.16]
Odds ratio M H, fixed, 95% CI
Favours [TaTME] Favours [LaTME]
Odds ratio M H, fixed, 95% CI
100
0.01 0.1 1 10
J
Study or subgroup
TaTME LaTME
Chen, 2019 de Angelis, 2015 Lelong, 2017 Mege, 2018
Total events
Heterogeneity: Chi = 0.84, df = 2 (P = 0.660); I = 0%
Test for overall effect: Z = 0.88 (P = 0.380) Total (95% CI)
2 2
0 1 2 0
3 Events Total
39 32 34 34 139
Weight 41.5%
30.5%
28.0%
100.0%
3 2 2 0
7 64 32 38 34 168 Events Total
0.22 [0.01, 4.42]
0.48 [0.04, 5.62]
1.13 [0.15, 8.46]
Not estimable 0.55 [0.15, 2.07]
Odds ratio M H, fixed, 95% CI
Favours [experimental]
Favours [control]
Odds ratio M H, fixed, 95% CI
100
0.01 0.1 1 10
K
Fig. 2. Continued 3.
or excessive distal margin. For such so-called “difficult pelvis”
patients, there were still huge challenges to complete high- quality TME surgery. The proposal of TaTME provided a new method to solve this problem. In 2010, Sylla et al. [22] reported
the first case of TaTME performed with transanal endoscopic microsurgery combined with laparoscopy. TaTME, also known as ‘bottom-up’ TME, had been pioneered to overcome these difficulties. The approach from below offers clear, direct
Study or subgroup
TaTME LaTME
Denost, 2014 de Angelis, 2015 Kanso, 2015 Ren, 2020 Roodbeen, 2019 Rubinkiewicz, 2018
Heterogeneity: Tau = 6.00; Chi = 89.28, df = 5 (P < 0.001); I = 94%
Test for overall effect: Z = 1.57 (P = 0.120) Total (95% CI)
2 2 2
7 9.68 7 6.81 10 1.41
Weight 16.2%
14.9%
14.6%
17.3%
18.4%
18.7%
100.0%
2.00 [0.04, 3.96]
0.49 [ 2.00, 2.98]
0.00 [ 2.60, 2.60]
1.59 [0.11, 3.07]
5.00 [4.18, 5.82]
0.42 [ 0.08, 0.92]
1.67 [ 0.42, 3.75]
Mean difference IV, random, 95% CI
Favours [experimental]
Favours [control]
Mean difference IV, random, 95% CI
100
100 50 0 50
A
5 4.57 6 2.99 2 1.29
50 32 51 32 41 35 241 Mean SD Total
5 9.19 7 5.22 5 0.99
5 5.55 6 3.05 1.8 0.78
50 32 34 32 41 35 224 Mean SD Total
Study or subgroup
TaTME LaTME
Chen, 2019 Denost, 2014 de Angelis, 2015 Kanso, 2015 Mege, 2018 Ren, 2020 Roodbeen, 2019 Rubinkiewicz, 2018
Heterogeneity: Chi = 6.98, df = 7 (P = 0.430); I = 0%
Test for overall effect: Z = 1.37 (P = 0.170) Total (95% CI)
2 2
Weight 5.9%
20.0%
10.0%
5.5%
6.8%
30.4%
14.5%
6.8%
100.0%
0.30 [ 0.84, 0.24]
0.00 [ 0.29, 0.29]
0.16 [ 0.58, 0.26]
0.60 [ 1.16, 0.04]
0.10 [ 0.60, 0.40]
0.03 [ 0.21, 0.27]
0.00 [ 0.35, 0.35]
0.41 [ 0.92, 0.10]
0.09 [ 0.22, 0.04]
Mean difference IV, fixed, 95% CI
Favours [TaTME] Favours [LaTME]
Mean difference IV, fixed, 95% CI
100
100 50 0 50
B
1.6 1 2.13 1.2 1.3 1.77 2 1.57
1.4 0.8 0.86 0.9 0.9 0.34 0.8 0.92
39 50 32 51 34 32 41 35 314 Mean SD Total
1.9 1 2.29 1.8 1.4 1.74 2 1.98
1.3 0.7 0.84 1.5 1.2 0.6 0.8 1.22
64 50 32 34 34 32 41 35 322 Mean SD Total
Study or subgroup
TaTME LaTME
Chen, 2019 Denost, 2014 de Angelis, 2015 Kanso, 2015 Lelong, 2017 Mege, 2018 Mo, 2019 Ren, 2020 Roodbeen, 2019 Rubinkiewicz, 2018
Heterogeneity: Tau = 927.63; Chi = 97.48, df = 9 (P < 0.001); I = 91%
Test for overall effect: Z = 0.99 (P = 0.320) Total (95% CI)
2 2 2
Weight 10.0%
10.3%
9.9%
10.1%
7.6%
9.6%
10.9%
10.9%
10.9%
9.7%
100.0%
26.00 [3.60, 48.40]
77.00 [57.18, 96.82]
30.00 [ 53.45, 6.55]
29.00 [ 50.70, 7.30]
44.00 [ 86.21, 1.79]
1.00 [ 26.83, 24.83]
6.20 [ 19.23, 6.83]
24.93 [11.24, 38.62]
18.00 [4.65, 31.35]
52.00 [26.35, 77.65]
10.21 [ 9.99, 30.40]
Mean difference IV, random, 95% CI
Favours [TaTME] Favours [LaTME]
Mean difference IV, random, 95% CI
100
100 50 0 50
C
210 240 195 240 532 246 254.3 212.59 318 271 Mean
57 53 43.62 50 98 48 21.2 28.71 26 63 SD
39 50 32 51 34 34 30 32 41 35 378 Total
184 163 225 269 576 247 260.5 187.66 300 219 Mean
55 48 51.74 50 83 60 31.5 27.15 35 45 SD
64 50 32 34 38 34 34 32 41 35 394 Total
Fig. 3. Forest plots of mean difference between transanal total mesorectal excision (TaTME) group and laparoscopic total mesorectal excision (LaTME) group. (A) Circumferential resection margin distance. (B) Distal resection margin distance. (C) Operative time. (D) Intraoperative blood loss. (E) Harvested lymph nodes. (F) Hospital stay. SD, standard deviation; IV, inverse variance methods; CI, confidence interval; df, degree of freedom.