INTRODUCTION
External quality control, external quality assessment (EQA), and proficiency testing (PT) assessment refer to the process of using interlaboratory comparisons to control for variability in the accuracy of an analytical method [1]. Belk and Sunderman [2] introduced clinical laboratory-based PT in the 1940s to assess interlaboratory performance and to standardize results; such assessments improve the
long-term accuracy of analytical methods. The mean of measurements provided by peer laboratories is compared with the measurement of an individual laboratory [3].
PT results can be interpreted using the standard deviation index (SDI), which is defined as the difference between an individual laboratory’s result and the group mean divided by the group standard deviation (SD). Evaluations using SDIs are based on groups with consistent analytical methods, instruments, and reagents,
External Quality Assessment of Institutions and Instruments Using a Linear Mixed Model
Jinsook Lim
1, Sungho Won
2, Suyeon Park
3, Jimyung Kim
1, Sun Hoe Koo
1, and Gye Choel Kwon
11
Department of Laboratory Medicine, Chungnam National University Hospital, Daejeon;
2
Department of Public Health Science, Graduate School of Public Health, Seoul National University, Seoul;
3Department of Biostatistics,
Soonchunhyang University Seoul Hospital, Seoul, Korea
Background: External quality assessment (EQA) uses a standard deviation index (SDI), based on a peer group, to evaluate laboratory performance. However, evaluations using peer group SDIs often have limited applicability, because they are not statistically valid unless the number of institutions in the same peer group is large. The present study proposes a statistical model for simultaneously evaluating the performance of all participating institutions, as well as the performance of instruments on the market.
Methods: By assuming that proficiency test results were affected by the manufacturer, the instrument, and the institution, the effects of those factors were estimated using a linear mixed model. We used these effect estimates to calculate manufacturer, instrument, and institution SDIs. Using simulation, we evaluated the false positive rates and efficiencies of the proposed linear mixed model.
Results: Simulations showed that the linear mixed model empirical type I error rates preserved the nominal significance level. This model was also more statistically efficient than the peer group SDI. Rates of unacceptability were lower when using institution SDI than they were when using peer group SDI. Additional outliers that could not be evaluated using the current system were detected by the institution SDI statistic. The instrument SDI statistic detected outliers among different instrument groups.
Conclusions: Institution and instrument SDIs are robust and efficient tools for EQA, and they can replace the currently used system of peer group SDI.
(J Lab Med Qual Assur 2016;38:43-51)
Key Words: Quality assurance, Laboratory proficiency testing, Linear mixed model
Corresponding author:
Gye Choel Kwon Department of Laboratory Medicine, Chungnam National University Hospital, 282 Munhwa-ro, Jung-gu, Daejeon 35015, Korea
Tel: +82-42-280-7799 Fax: +82-42-257-5365 E-mail: [email protected] pISSN: 2384-2458
eISSN: 2288-7261 Received November 11, 2015, Revision received February 22, 2016, Accepted February 22, 2016
to minimize effects other than the performance of the institutions in question [4]. Absolute SDI values larger than 2 or 3 indicate that a laboratory is not in agreement with the other laboratories in the program [3]. From 1970 to the 1990 publication of the revised Clinical Laboratory Improvement Amendments regulations, the College of American Pathologists classified results within ±1 SDI as ‘good,’ those within ±2 SDI as ‘acceptable,’ and those outside ±2 SDI as ‘unacceptable’ [5]. These criteria continue to be used for PT evaluations in South Korea.
Monitoring rules based on SDIs have been further shown to provide useful information for the interpretation of proficiency data [6].
However, there are limitations to peer group SDI evaluations. First, unless the number of institutions in each peer group is above 10, the peer group SDI cannot be used for the evaluation of institutions [4]. In such instances, total SDI is used; however, total SDI cannot assess institutional proficiency on a per-measurement basis. A measurement-specific instrument malfunction cannot be detected if the biases for both effects are masked. Furthermore, statistical results from small-sized peer groups tend to generate large variations in estimates.
The use of this system may result in unnecessary corrective actions, as there may be a high probability that a measurement assessment will fall outside the acceptable SDI range of ±2, when in fact performance is acceptable (false unacceptability) [7]. If the peer group size is too small, apparent issues with performance can be exaggerated.
External quality assessments assume that no bias is attributable to instruments in the market because they successfully passed extensive evaluations made according to Clinical and Laboratory Standards Institute guidelines before (or just after) launching. Although comparisons of the mean, SD, and coefficient of variation can be used as indicators of an instrument’s performance, they are not sufficient tools for making comparisons, because they do not account for other factors that potentially influence measurements.
Based on the foregoing shortcomings of the current system, in this study we propose a new quality
assessment process. This process evaluates an institution’
s performance based on total participating institutions, and uses linear mixed models to improve statistical confidence. Linear mixed models can identify the effects of various factors and evaluate significant differences between SDIs, based on the best linear unbiased predictor. For statistical verification, false positive rates and efficiency are evaluated with simulated data to detect different levels of bias. The proposed model is also applied to the Korean Association of Quality Assurance Clinical Laboratory PT program in haematology, and compared with the current peer group SDI.
MATERIALS AND METHODS
1. Development of a New Statistical Model
For each institution, we assume that measurements of a dependent variable with index k are influenced by the analytical methods used; namely, manufacturer, instrument, and institution. We assume that there are I manufacturers and J instruments. In the present study, each institution uses an instrument of index j from a manufacturer of index i to measure the k-th dependent variable among: white blood cells, haemoglobin, haematocrit, or platelets. If we denote the manufacturer and instrument effects with b
1iand b
2j, respectively, then the k-th response variable observed for manufacturer i and instrument j can be modelled by
y
ijk= b
0+b
1i+ e
ijk, i=1, 2, . . . , I, j=1, 2, . . ., J where e
ijk~N(0, s
2e).
There are many manufacturers and instruments; both can affect measurement results. Thus, b
1iand b
2jare modelled as random effects:
b
1i: Manufacturer random effect ~ N(0, s
1 2) b
2j: Instrument random effect ~ N(0, s
22
)
There are many institutions and instruments; the
mean squared error can be large if the number of free
parameters is large relative to the sample size. However,
if we assume that these effects are random, then we only
need to estimate their variances. We assumed that b
1iand b
2jare random effects, and variance parameters were estimated using restricted likelihood [8]. We calculated the best linear unbiased predictors for b
1iand b
2j, and they were used to evaluate the manufacturer and instrument effects. Next, we defined SDIs for both factors:
1 1
manufacturer SDI
ib
i, 1,2, , i I
2 2
instrument
jb
j, 1,2, , .
SDI j J
e
ijkis mainly determined by the institution effect, and by denoting the corresponding institution for e
ijkby l, where l
=1, … , L, we can define
institution SDI
l ijk, 1,2, , . l L
Various types of SDIs can be used to evaluate the performance of each factor. For example, if the absolute value of SDI is larger than 2, then the corresponding manufacturer, instrument, or institution effect can be assumed to be statistically different from those of the other groups, providing evidence of some malfunction.
An institution SDI of 2.5 indicates statistical abnormality with respect to its peer group; pre-analytical, analytical, or post-analytical errors may be present. Empirically, we find that manufacturer SDI
iusually satisfies this condition; however, this finding is not considered in our report.
2. Simulation Studies
1) Evaluation of the false positive rate
To evaluate the false positive rate, we assumed
that there are no differences between manufacturers, instruments, and institutions. We also assumed that the effect of each factor is normally distributed. We estimated the b
0and variances for each experiment by selecting the linear mixed model parameters under which our simulated data had the most favourable restricted likelihood. The empirical type-I estimates were calculated using 5,000 replicates (Table 1).
2) Evaluation of efficiency
Next, we assumed a 5% degree of bias in instruments and institutions (c·s
2and c· s
ε, respectively). s
2and s
εwere then estimated from the sample data (with c values of 1, 2, or 3). Each effect was independently generated from the normal distribution with a zero mean. Variances for manufacturer, instrument, and institution were assumed to be s
12
, s
22
, and s
ε2
. The empirical detection rates for biased instruments and institutions were calculated using instrument SDI and institution SDI. The peer group SDI was also applied to the simulated data, and its empirical detection rates were calculated for comparison with those calculated using the proposed method.
3. Application of a New Statistical Model to Participant Data and Comparison with the Peer Group SDI
Using the proposed statistical model, we calculated instrument and institution SDIs for complete blood count (CBC) data. The data consisted of measurements for white blood cells (WBC), haemoglobin (Hb), haematocrit (Hct), and platelets, from participants for the first PT in 2011. We compared these results with the peer group SDIs.
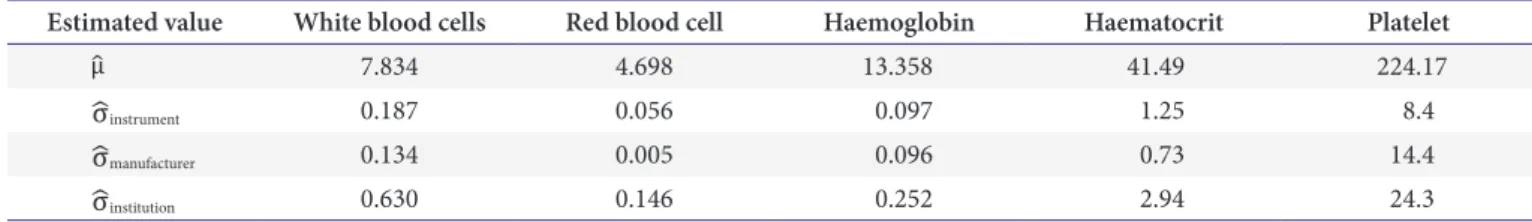
Table 1. Estimated mean and standard deviations for each complete blood count measurement
Estimated value White blood cells Red blood cell Haemoglobin Haematocrit Platelet
Ɋො 7.834 4.698 13.358 41.49 224.17
ɐෝ
instrument0.187 0.056 0.097 1.25 8.4
ɐෝ
manufacturer0.134 0.005 0.096 0.73 14.4
ɐෝ
institution0.630 0.146 0.252 2.94 24.3
RESULTS
1. Verification of New Statistical Model with the Simulated Data
1) False positive rates
With parameters estimated using the real data, each replicate was generated. False positive rates for instrument SDI, institution SDI, and peer group SDI were calculated at the 0.05 significance level. The results were
all less than 0.05 (Table 2), showing that the nominal significance level is preserved, and that the proposed method is statistically valid.
2) Efficiency of the new statistical model
To measure efficiency, we intentionally assumed different levels of bias (i.e., 1 SD, 2 SD, or 3 SD) for 5%
of the instruments and institutions. We compared the detection rates of instrument and institution SDIs were with the peer group SDIs (Tables 3 and 4). We find that instrument SDI is consistently more efficient than the peer group SDI, and that the magnitude of this improvement grows with increasing levels of bias. The efficiencies of institution SDIs tend to be larger than those of peer group SDIs, even though their differences are not substantial.
The proposed instrument and institution SDIs are more informative bias detectors than the peer group SDI.
Table 3. Comparison of the efficiency of instrument SDI with the efficiency of the current SDI system, for all levels of bias
Levels of bias Linear
mixed model (instrument SDI)
Peer group
SDI White blood cells ɐෝ
Instrumnent0.1271 0.0444
2 ɐෝ
Instrument0.3669 0.0779
3 ɐෝ
Instrument0.6585 0.1262
Red blood cells ɐෝ
Instrumnent0.1306 0.0591
2 ɐෝ
Instrument0.3813 0.1266
3 ɐෝ
Instrument0.6661 0.2282
Haemoglobin ɐෝ
Instrumnent0.1209 0.0530
2 ɐෝ
Instrument0.3408 0.1091
3 ɐෝ
Instrument0.6069 0.1900
Haematocrit ɐෝ
Instrumnent0.1231 0.0507
2 ɐෝ
Instrument0.3495 0.0967
3 ɐෝ
Instrument0.6376 0.1674
Platelets ɐෝ
Instrumnent0.1278 0.0414
2 ɐෝ
Instrument0.3633 0.0712
3 ɐෝ
Instrument0.6516 0.1102
Abbreviation: SDI, standard deviation index.
Table 2. False positive rates for complete blood count profiles using the current proficiency testing method compared with those obtained using the linear mixed model developed in the present study
Instrument
SDI Institution
SDI Peer group SDI White blood cells 0.0225 0.0455 0.0438
Red blood cells 0.0177 0.0455 0.0438
Haemoglobin 0.0220 0.0455 0.0439
Haematocrit 0.0223 0.0455 0.0438
Platelet 0.0223 0.0455 0.0438
Abbreviation: SDI, standard deviation index.
Table 4. Comparison of the efficiency of institution SDI with the efficiency of the current SDI system, for all levels of bias
Levels of bias
Linear mixed model
(institution SDI)
Peer group
SDI White blood cells ɐෝ
Intitution0.1353 0.1237
2 ɐෝ
Institution0.3858 0.3486
3 ɐෝ
Institution0.6724 0.6219
Red blood cells ɐෝ
Intitution0.1354 0.0974
2 ɐෝ
Institution0.3840 0.2462
3 ɐෝ
Institution0.6693 0.4752
Haemoglobin ɐෝ
Intitution0.1345 0.1037
2 ɐෝ
Institution0.3850 0.2786
3 ɐෝ
Institution0.6703 0.5140
Haematocrit ɐෝ
Intitution0.1342 0.1186
2 ɐෝ
Institution0.3808 0.3295
3 ɐෝ
Institution0.6649 0.5958
Platelets ɐෝ
Intitution0.1352 0.1081
2 ɐෝ
Institution0.3848 0.2937
3 ɐෝ
Institution0.6710 0.5373
Abbreviation: SDI, standard deviation index.
2. Application of the New Statistical Model to the Participant Data
1) Institution SDI
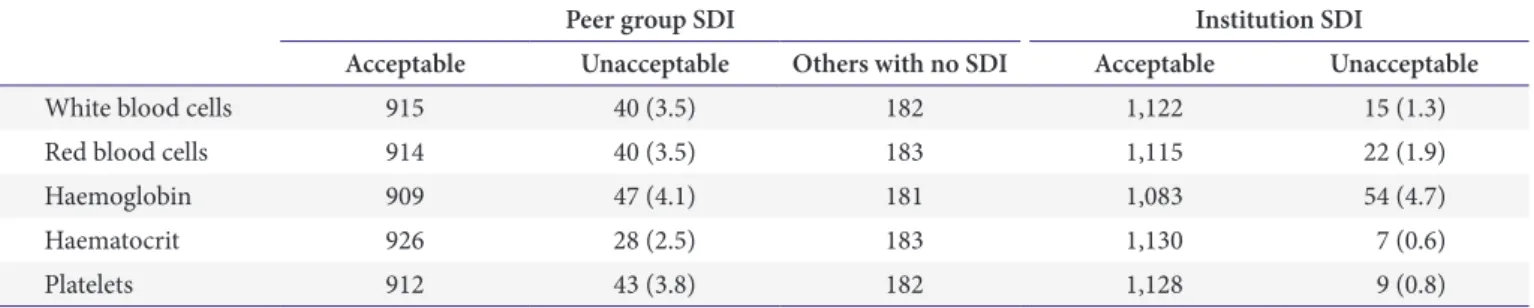
(1) Comparison of the peer group SDI and institution SDI CBC data from 1,137 participating institutions were used to calculate peer group and institution SDIs. For institutions classified as ‘others’ owing to their inability to form a peer group, total SDIs were uniquely provided;
the remaining institutions were provided with peer group SDIs. The newly proposed institution SDI was calculated for all institutions, regardless of their ability to form a peer group. Using the current peer group SDI system, unacceptable SDIs were found for 3.5%, 3.5%, 4.1%, 2.5%, and 3.8% of participating institutions for measurements of WBC, red blood cells (RBC), Hb, Hct, and platelets, respectively. Unacceptable institution SDIs constituted 1.3%, 1.9%, 4.7%, 0.6%, and 0.8%
of participating institutions for measurements of WBC, RBC, Hb, Hct, and platelets, respectively (Table 5).
(2) Analysis of discordant data between the peer group SDI and institution SDI
The numbers of institutions with unacceptable peer group SDIs but acceptable institution SDIs were 3 (2.7%), 27 (2.4%), 22 (1.9%), 22 (1.9%), and 38 (3.3%) for measurements of WBC, RBC, Hb, Hct, and platelets, respectively. Institutions with acceptable peer group SDIs but unacceptable institution SDIs totalled 3, 2, 15, 1, and 1 for WBC, RBC, Hb, Hct, and platelets, respectively.
In institutions classified as others under the peer group SDI system, 3 institutions among 182 for WBC, 7 among Table 5. Performance test results for the distribution of the peer group SDI and institution SDI for each complete blood count measurement
Peer group SDI Institution SDI
Acceptable Unacceptable Others with no SDI Acceptable Unacceptable
White blood cells 915 40 (3.5) 182 1,122 15 (1.3)
Red blood cells 914 40 (3.5) 183 1,115 22 (1.9)
Haemoglobin 909 47 (4.1) 181 1,083 54 (4.7)
Haematocrit 926 28 (2.5) 183 1,130 7 (0.6)
Platelets 912 43 (3.8) 182 1,128 9 (0.8)
Values are presented as number or number (%).
Abbreviation: SDI, standard deviation index.
Table 6. The number of institutions that have discordant results between the peer group SDI and the institution SDI for each complete blood count measurement (n=1,137)
Unacceptable peer group
SDI but acceptable institution
SDI
Acceptable peer group SDI but unacceptable
institution SDI
No peer group SDI and unacceptable
institution SDI
White blood cells 31 (2.7) 3 3
Red blood cells 27 (2.4) 2 7
Haemoglobin 22 (1.9) 15 14
Haematocrit 22 (1.9) 1 0
Platelets 38 (3.3) 1 3
Values are presented as number (%) or number.
Abbreviation: SDI, standard deviation index.
1121 1123 1124 1125 1141 1151 1161 1162 1171 1181 5.0
4.8
4.6
4.4
Resultofredbloodcells(x10/L)6
4.2
Instrument code 572 909
749
1383
Fig. 1. Red numbers are institutions with acceptable peer
group SDIs, but unacceptable institution SDIs. Blue numbers
are institutions without peer group SDIs, and unacceptable
institution SDIs. Each peer group code indicates a peer group
using the same instrument. Abbreviation: SDI, standard
deviation index.
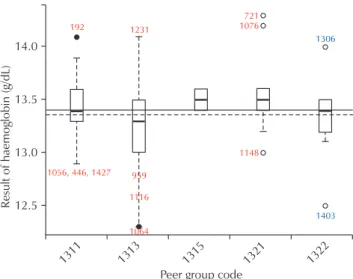
183 for RBC, 14 among 181 for Hct, and 3 among 182 for platelets had unacceptable PT results, according to institution SDI (Table 6). In the case of unacceptable peer group SDIs but acceptable institution SDIs, institution counts were 16 among 31 (51.6%) for WBC, 16 among 27 (59.2%) for RBC, 10 among 22 (45.5%) for Hb, 17 among 22 (77.3%) for Hct, and 21 among 38 (55.3%) had peer group sizes of less than 30. The results for institutions with acceptable peer group SDIs but unacceptable institution SDIs, and institutions classified as others with unacceptable institution SDIs, were shown to be outliers (Fig. 1).
2) Instrument SDI for participant data
Instrument SDIs were outside the ±2 range for one instrument for WBC, two for Hct, two for platelets, three for RBC, and three for Hb (Table 7).
DISCUSSION
Improving the modern clinical laboratory entails continuous inspection and refinement of processes, to ensure the efficient delivery of services that meet client needs and expectations [9]. PT is one such inspection measure that clinical laboratories implement worldwide.
The interlaboratory perspective of the PT provider affords
opportunities to identify root causes of systemic biases affecting multiple laboratories that use similar analytical systems or processes. PT has been performed since 1973 in South Korea, using peer group SDI as the basis for evaluation.
Because of its sensitivity to peer group size, the peer group SDI metric can be problematic in small countries. Moreover, the SD of each peer group tends to be extremely small due to the precision and accuracy of modern instrumentation. Lowered SDs cause heightened SDI unacceptability. For these reasons, fixed limits are used to counteract the effects of overly stringent performance requirements, derived from the interlaboratory group mean and SD, achieved by today’
s precise analytical systems [10]. However, according to Ehrmeyer and Laessig [11], neither SDI nor fixed limits are suitable for differentiating between good and bad interlaboratory performance. The present study developed a model to overcome these issues with peer group SDI, statistically assessed the behaviour of this model, and applied it to participant data.
Both peer group and institution SDI are acceptable statistical tools, since they both demonstrate false positive rates lower than 0.05, and show similar efficiencies in detecting biased data. Biased results can be generated from multiple factors; our simulations assumed both instrument and institution biases. The peer group SDI cannot jointly estimate these biases, which may explain the efficiency improvement exhibited by the proposed method. Instrument and institution SDIs can successfully replace a peer group SDI, for EQA. Furthermore, the institution SDI can overcome the statistical limitations of a peer group SDI derived from a small peer group. Sample sizes smaller than 30, follow a t-distribution rather than a normal distribution. Therefore, the smaller the sample size, the farther from ±2 the cut-offs are. Without adjusting the ±2 cut-offs, the PT results for institutions with peer group sizes below 30 were rejected, even though they performed acceptably under the current system.
According to the EQA for CBC measurements presented herein, 23 out of the 31 peer groups (74.2%) had fewer than 30 institutions. Most institutions with unacceptable Table 7. Instruments with an SDI outside the range of ±2 for each
complete blood count measurement
Instrument code Instrument SDI
Red blood cells 216 –2.1500
1125 2.6286
1411 –2.5493
Haemoglobin 141 –2.0978
917 2.2123
1412 –2.2365
Haematocrit 141 –2.0500
321 2.0650
White blood cells 321 2.8870
Platelets 1162 2.3600
1171 –2.3400
Abbreviation: SDI, standard deviation index.
peer group SDIs but acceptable institution SDIs were in peer groups with fewer than 30 members, and peer group SDIs were close to ±2. Compared with current system, the rates of measurement acceptability decreased from 3.5% to 1.9% for WBC, 3.5% to 1.9% for RBC, 2.5% to 0.7% for Hct, and 3.8% to 0.8% for platelets when using our model.
Institution SDI predictions have higher statistical confidence than peer group SDI predictions, thereby overcoming the limitation that peer group SDIs are only applicable to large sample sizes. Consequently, institution SDI can evaluate the performances of approximately 180 institutions that would be classified as ‘others’ under the current peer group SDI system. Until recently, these institutions were only assessed using total SDI, which, as discussed earlier, is not an appropriate tool for evaluating institution performance. Institution SDI is able to assess every institution equally without readjusting cut-offs for small peer groups, and can detect institutions that present erroneous results undetected by the current system (Table 6 and Fig. 1). In the case of Hb, for example, the rate of unacceptability slightly increased from 4.1% to 4.7%, because of positives from institutions classified as others.
We have developed a statistical tool for evaluating the performance of instruments on the market, which is unavailable using the peer group SDI system. Using a
linear mixed model, instrument SDI allows us to evaluate both institutions and instruments, with a false positive rate was under 0.05. Efficiency of the linear mixed model is consistently higher than that of the current system for all levels of bias, and the magnitude of efficiency improvement is proportional to the level of bias (Table 3).
The SDIs of a few instruments in each CBC profile were outside the range of ±2. As shown in Fig. 2, differences between instruments can be identified using the proposed instrument SDI, which would be infeasible under the peer group SDI system. See, for example, instrument 1125 in Fig. 1, whose instrument SDI was 2.629 in contrast to the values derived from other instruments. Instrument SDI allows us to accurately evaluate the performance of each instrument.
Compared with the inconsistency of the peer group SDI and total SDI measures, the proposed instrument SDI and institution SDI enable identification of both effects.
Our newly proposed model evaluates instruments as well as participating institutions, which is not possible under the current peer group SDI system. Moreover, the serial monitoring of instrument SDI can be used as a gauge of the performance of specific instruments used under the current peer group SDI approach. Before specifying new cut-off criteria, the length of the follow-up period, possible provision of instrument SDI to institutions, and independent verification of our model should be considered.
Institution SDI and instrument SDI are powerful statistical tools for EQA, which are especially useful when peer groups are subdivided by instruments and reagents. Instrument SDI can monitor the performance of each instrument, and facilitate the direct comparison of different instruments. Using linear mixed models, institution SDI and instrument SDI can successfully replace the peer group SDI system.
ACKNOWLEDGEMENTS
This study was financially supported by the research fund of the Korean Association of Quality Assurance for Clinical Laboratories, in 2011.
1311 1313 1315 1321 1322
14.0
13.5
13.0
Resultofhaemoglobin(g/dL)
12.5
Peer group code
192 1231
959 1116
1064 1056, 446, 1427
721 1076
1148
1306
1403
Fig. 2. Box plot of each instrument for red blood cells.
REFERENCES
1. Karkalousos P, Evangelopoulos A. Quality control in clinical laboratories. In: Ivanov O, editor. Application and experiences of quality control. Vukovar: In Tech, 2011:331-60.
2. Belk WP, Sunderman FW. A survey of the accuracy of chemical analyses in clinical laboratories. Am J Clin Pathol 1947;17:853-61.
3. Klee GG, Westgard JO. Quality management. In: Burtis CA, Ashwood ER, Bruns DE, Tietz NW, editors. Tietz textbook of clinical chemistry and molecular diagnostics.
5th ed. St. Louis (MO): Elsevier Saunders, 2012.
4. College of American Pathologists. Proficiency testing manual. http://www.cap.org/apps/docs/proficiency_
testing/2011_surveys_excel_manual.pdf (Accessed March 20, 2016).
5. Ehrmeyer SS, Laessig RH. External proficiency testing (interlaboratory quality control). In: Cembrowski GS, Carey RN, editors. Laboratory quality management:
QC and QA. Chicago: American Journal of Clinical Pathology, 1989.
6. Carey RN, Cembrowski GS, Garber CC, Zaki Z. Per- formance characteristics of several rules for self-inter- pretation of proficiency testing data. Arch Pathol Lab Med 2005;129:997-1003.
7. Cembrowski GS, Hackney JR, Carey N. The detection of problem analytes in a single proficiency test challenge in the absence of the Health Care Financing Administration rule violations. Arch Pathol Lab Med 1993;117:437-43.
8. Harville DA. Maximum likelihood approaches to va- riance component estimation and to related problems. J Am Stat Assoc 1977;72:320-38.
9. Jenny RW, Jackson-Tarentino KY. Causes of unsatis- factory performance in proficiency testing. Clin Chem 2000;46:89-99.
10. Ehrmeyer SS, Laessig RH. An assessment of the use of fixed limits to characterize intralaboratory performance by proficiency testing. Clin Chem 1987;33:1901-2.
11. Ehrmeyer SS, Laessig RH. An evaluation of the ability of
proficiency testing programs to determine intralaboratory
performance: peer group statistics vs clinical usefulness
limits. Arch Pathol Lab Med 1988;112:444-8.
복합 선형 모델을 이용한 기관 및 장비의 외부정도관리평가
임진숙
1• 원성호
2• 박수연
3• 김지명
1• 구선회
1• 권계철
11