Optimization of Laccase Production from Bacillus sp.
PK4 through Statistical Design of Experiments
Murugesan Rajeswari and Vembu Bhuvaneswari*
Department of Biochemistry, Biotechnology, and Bioinformatics Avinashilingam Institute for Home Science and Higher Education for Women, Coimbatore 641043, Tamil Nadu, India
Received: October 20, 2017 / Revised: November 25, 2017 / Accepted: November 27, 2017
Introduction
Laccases (p-diphenol: dioxygen reductase) contain his- tidine-rich copper binding domains, and they are mem- bers of the most significant subgroup of the protein subfamily of multicopper oxidase. Laccase has broad- spectrum specificity and can oxidize highly recalcitrant compounds like lignin [1]. This functionality makes a potential application of laccase in various domains of biotechnology like bioremediation of xenobiotics, green chemistry, food and cosmetic industries [2, 3].
Laccase has been extensively investigated for new and challenging decontamination program because they oxi- dize a broad range of aromatic compounds. However, the
most extensive effort is required to overcome several bot- tlenecks like high enzyme cost, low activity, and stability under given conditions and low reaction yields [4]. The majority of the laccase characterized so far are from the fungal origin, and very few reports are available on bac- terial laccase. The bacterial laccases were shown to have higher thermostability and pH stability compared to fungal enzymes which makes them suitable for indus- trial application [5]. The first reported laccase producing bacterium was Azospirillum lipoferum [6] and Bacillus subtilis CotA laccase structure was first elucidated [7].
Due to the diverse application of laccase, several stud- ies were carried out on optimization of laccase produc- tion from different microbes. These reports also claim that fungal laccase production was affected by various factors such as carbon and nitrogen source, inducer, trace element composition, etc.. However there are only limited studies on induction and enhanced production of Statistical design of experiments was employed to optimize the media composition for the production of laccase from Bacillus sp. PK4. In order to find the key ingredients for the best yield of enzyme production from the selected eleven variables viz yeast extract, glucose, zinc sulphate, copper sulphate, potassium chloride, magnesium sulphate, calcium chloride, ferrous sulphate, sodium chloride, potassium dihydrogen phosphate (KH2PO4) and dipotassium hydrogen phosphate (K2HPO4), Plackett-Burman design was applied.
The MgSO4, FeSO4, and CuSO4 showed positive estimate, and their concentration optimized further. The steepest ascent method and Box-Behnken method revealed that 1.5 mM MgSO4, 0.33 g/lFeSO4 and 1.41 mM CuSO4 were optimal for the laccase production by Bacillus sp. PK4. This optimization strategy leads to enhancement of laccase production from 2.13 U/ml to 40.79 U/ml. Agro-wastes residues replace the carbon source glucose in the optimized media namely sugarcane bagasse, wheat bran, rice husk, and groundnut shell, among these groundnut shells (117 U/ml) was found to enhance the laccase production significantly.
The laccase produced by Bacillus sp. PK4 was found to have the potential to degrade persistent organic pollutant benzo[a]pyrene.
Keywords: Laccase, Plackett-Burman design, Box-Behnken design, agro waste, benzo[a]pyrene
*Corresponding author Tel: +919597419890
E-mail: [email protected]
© 2017, The Korean Society for Microbiology and Biotechnology
bacterial laccase. We have isolated thermostable laccase producing bacteria Bacillus sp. PK4 from paper mill effluent [8]. The objective of this work is to screen for the significant media components for laccase production from the isolated Bacillus sp. PK4 and further to opti- mize the level of these components using the statistical design of experiments. The partially purified enzyme was assessed for its potential in degrading organic pol- lutant benzo[a]pyrene.
Materials and Methods
Microorganism
Bacillus sp. PK4 producing an extracellular laccase was isolated from paper mill effluent. It was identified based on 16S rRNA gene sequencing [8]. The culture was cultivated and maintained by weekly transfers on to Luria-Bertani (LB) agar slants. The inoculum was pre- pared by transferring a loop of culture from the slant into 250 ml flask containing 25 ml LB broth and incu- bated at 37℃ at 100 rpm for 12 to 16 h to achieve the OD600 nm of 0.5 to 0.7.
Extraction of extracellular laccase
The culture medium was centrifuged at 10,000 × g for 15 min at 4℃ after incubation at 37℃ at 100 rpm for 42 h and the supernatant obtained was used as the crude enzyme extract.
Laccase assay
Laccase activity was measured using 2,6-dimethoxy- phenol (2,6 DMP) as a substrate [9]. The enzyme assay was done using 2 mM 2,6 DMP as substrate. 50 to 100 μl of the sample was added to 10 mM phosphate buffer (pH 7) containing the substrate 2,6 DMP at a concentra- tion of 2 mM, and oxidation was measured by the increase in the absorbance at 477 nm (ε =14600 mol-1· cm-1). One unit (U) of laccase was defined as the amount of the enzyme required to transform one mmol substrate per min under standard assay conditions.
Optimization of laccase production
Identification of significant factors by Plackett- Burman design. Plackett-Burman design is a powerful tool for screening the crucial variables that influence the response. This technique significantly decreases the
number of experiments needs to achieve the experimen- tal goals efficiently. The eleven variables identified in one factor one time method reported in Rajeswari et al.
[8] were investigated using Plackett-Burman design to identify the variables that significantly affect the laccase production. A set of 12 experiments were designed using Plackett-Burman orthogonal array, and laccase produc- tion was observed at different combinations of variables.
Steepest Ascent method
Usually, the initial estimate of the optimum operating conditions for the system will be far from the actual opti- mum. In such circumstances, variables that significantly influenced laccase production were optimized concerning enzyme activity by applying a single steepest ascent experiment [10].
Optimization of key ingredients by Box-Behnken design (BBD)
The next step is to optimize the concentration of criti- cal media components identified in Plackett-Burman method to achieve the maximum yield, the significant variables selected were as follows: MgSO4, FeSO4 and CuSO4. The Response Surface Methodology (RSM), using Box-Behnken design, was used to determine the optimum concentration of selected variables.
The statistical software R (RcmdrPlugin.DOE) was used to analyze the experimental design [11, 12].
Production of laccase using agro waste substrates The different agro waste residues namely rice husk, wheat bran, groundnut shell and sugarcane bagasse were screened for the laccase production in the sub- merged fermentation system. The selected agro waste residues were powdered and oven dried at 45℃ for 24 h and sterilized at 121℃, pressure 15 lbs for 20 min and stored at room temperature before further use. In the submerged fermentation (SmF) 100 ml of optimized media without glucose containing various agro waste residues at 10% level were taken. The flasks were then thoroughly mixed and autoclaved. After cooling it to room temperature, media were inoculated with 10% of the seed culture and incubated at 37℃ with 100 rpm for 42 h. Then, the fermented material was centrifuged at 10,000 × g for 15 min at 4℃ to obtain the crude enzyme extract. The supernatant obtained was used for deter-
mining the laccase activity.
Degradation of benzo[a]pyrene using partially purified laccase
Acetone was added to the crude enzyme extract in the ratio of 1:1, vortexed for 1−2 min and incubated over- night at -20℃. The sample was centrifuged at 7,400 ×g for 30 min and kept at room temperature for 1−2 h for the complete removal of the acetone. The pellet was dis- solved in 100 mM potassium phosphate buffer of pH 7.0.
Degradation of benzo[a]pyrene
10 mM benzo[a]pyrene was prepared by dissolving benzo[a]pyrene in acetone in a glass tube and stored at dark conditions. The reaction was carried out in the reaction condition of 7.5% acetonitrile, temperature at 37℃, 100 μM benzo[a]pyrene and 6 U of crude laccase.
The degradation of benzo[a]pyrene by crude bacterial laccase was compared with 5 U of Tramates versicolor laccase (Sigma 38429). At the end of the reaction, the ethyl acetate fractions were taken and evaporated. The obtained degraded metabolites were then dissolved in HPLC grade methanol. The residues of benzo[a]pyrene were analyzed qualitatively by high performance thin layer chromatography (HPTLC) technique (CAMAG Linomat 5). In the course of developing the optimal
mobile phase for HPTLC, the following solvents were tested - dichloromethane, methanol, acetic acid, chloro- form, hexane, and ethyl acetate. The combination of petroleum ether and ethyl acetate (3:5) proved to be the best. The band developed was densitometrically scanned at 293 nm for benzo[a]pyrene.
Results
Screening of statistically significant variables for laccase production by Bacillus sp. PK4
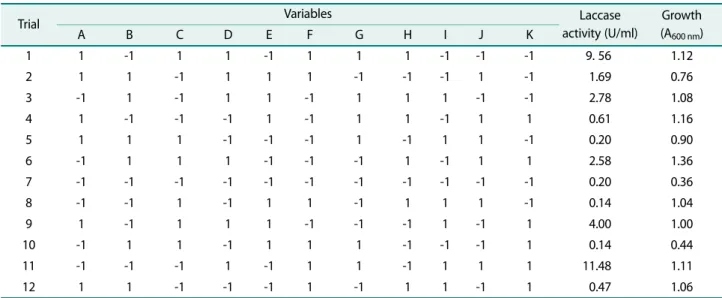
A total of eleven variables namely yeast extract, glu- cose, zinc sulphate, copper sulphate, potassium chloride, magnesium sulphate, calcium chloride, ferrous sulphate, sodium chloride, potassium dihydrogen phosphate (KH2PO4) and dipotassium hydrogen phosphate (K2HPO4) were analyzed about their effect on laccase production using a Plackett-Burman design. The eleven media com- ponents selected were screened for their main effect using 12 runs of a PB design (Table 1).
According to Table 1, trial 11 showed the highest enzyme production, whereas trial 10 and 8 showed low- est enzyme production when compared to others. The data on enzyme production was subjected to multiple linear regression analysis using R software to find out an estimate, t-value and p-value and is presented in
Table 1. Plackett-Burman experimental design for the evaluation of factors affecting laccase production by Bacillus sp. PK4.
Trial Variables Laccase
activity (U/ml)
Growth (A600 nm)
A B C D E F G H I J K
1 1 -1 1 1 -1 1 1 1 -1 -1 -1 9. 56 1.12
2 1 1 -1 1 1 1 -1 -1 -1 1 -1 1.69 0.76
3 -1 1 -1 1 1 -1 1 1 1 -1 -1 2.78 1.08
4 1 -1 -1 -1 1 -1 1 1 -1 1 1 0.61 1.16
5 1 1 1 -1 -1 -1 1 -1 1 1 -1 0.20 0.90
6 -1 1 1 1 -1 -1 -1 1 -1 1 1 2.58 1.36
7 -1 -1 -1 -1 -1 -1 -1 -1 -1 -1 -1 0.20 0.36
8 -1 -1 1 -1 1 1 -1 1 1 1 -1 0.14 1.04
9 1 -1 1 1 1 -1 -1 -1 1 -1 1 4.00 1.00
10 -1 1 1 -1 1 1 1 -1 -1 -1 1 0.14 0.44
11 -1 -1 -1 1 -1 1 1 -1 1 1 1 11.48 1.11
12 1 1 -1 -1 -1 1 -1 1 1 -1 1 0.47 1.06
All variables are studied at two levels (1 and -1). The variables A to K denotes: A - Glucose (1% and 2%), B - yeast extract (0.4% and 1.5%), C - dipotassium hydrogen phosphate (0.1g/l and 2.0 g/l), D - magnesium sulphate (0.1 mM and 2.0 mM), E - sodium chloride (0.1 g/l and 1.0 g/l), F - ferrous sulphate (0.1 g/l and 0.5 g/l), G - copper sulphate (0.5 mM and 2.0 mM), H - calcium chloride (0.02 g/l and 0.1 g/l), I - zinc sulphate (0.1 g/l and 0.5 g/l), J - potassium chloride (0.1 g/l and 1.0 g/l) and K - potassium dihydorgen phosphate (0.1 g/l and 2.0 g/l).
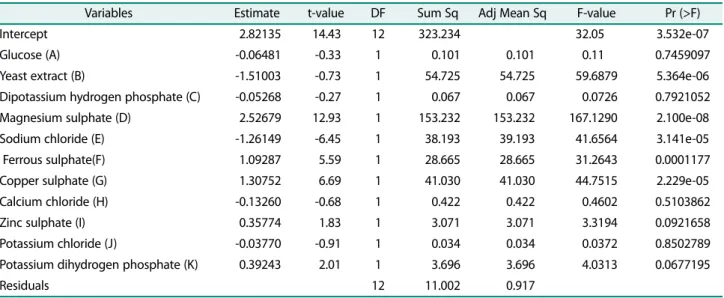
Table 2. The Student’s t-test for any individual effect allows an evaluation of the probability of finding the observed impact purely by chance. The adequacy of the model was tested and parameters with statistically sig- nificant results were identified using the Fischer’s test for analysis of variance (ANOVA).
The analysis of variance showed that the model was significant with model F-value of 32.05 (Table 2). The factors having the values of p < 0.05 were considered to have a significant effect on the laccase production. Yeast extract, magnesium sulphate, sodium chloride, ferrous sulphate and copper sulphate were found to have a p- value less than 0.05, which indicated that they signifi- cantly affect the laccase production. Among them, mag- nesium sulphate, ferrous sulphate, and copper sulphate, which show positive estimate, indicated their positive effect on laccase production (Table 2). In contrary, yeast extract and sodium chloride with the negative estimate would be adverse to the laccase production (Table 2).
The correlation measures for testing the goodness of fit of the regression equation is the coefficient of determi- nation (R2). Predicted R2 is to indicate how well the model predicts responses for new observations, whereas R2 indicates how well the model fits the data. The pre- dicted R2 can prevent overfitting the model and can be more useful than adjusted R2 for comparing models because it is calculated using observations not included in the model estimation. For a good statistical model, R2
value should be close to 1.0 or 100% where a value >0.75 or 75% indicates the aptness of the model. The model generated using Plackett-Burman design was found to have an R2 value of 96.71% showing a good correlation between observed and predicted response. The adjusted determination coefficient (Adj R2) corrects the R2 value for the sample size and the number of terms in the model. Since the R2 tends to overestimate the strength of association, the Adj R2 of 93.69% indicated that the model would have the strong relationship even with the addition of extra variables. Also, the predicted R2 was found to be 86.83%, which was in reasonable agreement with the Adj R2 and model R2. This indicated that there was good agreement between the experimental and the- oretical values predicted by the model and almost all the variation could be accounted by the model equation.
In Plackett-Burman design, the effect of independent variables on laccase production is given by the first order linear model and is given by the following equation:
Y (laccase activity U/ml) = 2.82135 − 0.06481 A
− 1.51003B − 0.05268 C + 2.25679 D − 1.26149 E + 1.09287 F + 1.30752G − 0.13260 H + 0.35774 I
− 0.03770 J + 0.39243K
where, A, B, C, D, E, F, G, H, I, J and K represent the glucose, yeast extract, dipotassium hydrogen phosphate, magnesium sulphate, sodium chloride, ferrous sulphate, copper sulphate, calcium chloride, zinc sulphate, potas- Table 2. Analysis of variance for laccase activity by Plackett-Burman Design.
Variables Estimate t-value DF Sum Sq Adj Mean Sq F-value Pr (>F)
Intercept 2.82135 14.43 12 323.234 032.05 3.532e-07
Glucose (A) -0.06481 -0.33 1 0.101 0.101 000.11 0.7459097
Yeast extract (B) -1.51003 -0.73 1 54.725 54.725 059.6879 5.364e-06
Dipotassium hydrogen phosphate (C) -0.05268 -0.27 1 0.067 0.067 000.0726 0.7921052
Magnesium sulphate (D) 2.52679 12.93 1 153.232 153.232 167.1290 2.100e-08
Sodium chloride (E) -1.26149 -6.45 1 38.193 39.193 041.6564 3.141e-05
Ferrous sulphate(F) 1.09287 5.59 1 28.665 28.665 031.2643 0.0001177
Copper sulphate (G) 1.30752 6.69 1 41.030 41.030 044.7515 2.229e-05
Calcium chloride (H) -0.13260 -0.68 1 0.422 0.422 000.4602 0.5103862
Zinc sulphate (I) 0.35774 1.83 1 3.071 3.071 003.3194 0.0921658
Potassium chloride (J) -0.03770 -0.91 1 0.034 0.034 000.0372 0.8502789
Potassium dihydrogen phosphate (K) 0.39243 2.01 1 3.696 3.696 004.0313 0.0677195
Residuals 12 11.002 0.917
R-Sq = 96.71%, R-Sq (pred) = 86.83%, R-Sq (adj) = 93.69%.
sium chloride and potassium dihydrogen phosphate respectively.
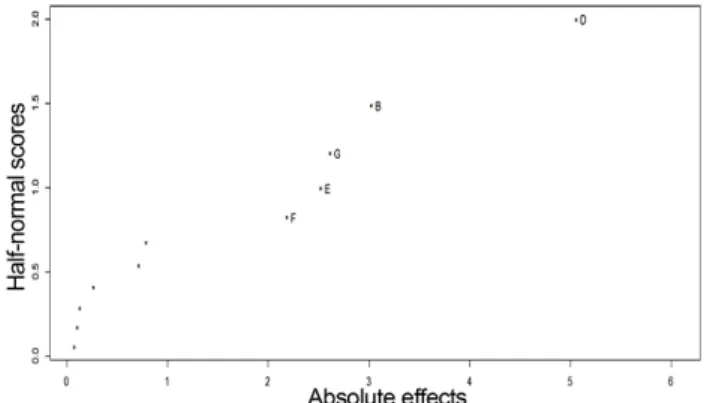
The half-normal plot uses the estimated effects to com- pare the magnitude of the main effect and to assess the factors, which are important. From the half-normal plot (Fig. 1) it can be inferred that most significant factor affecting the laccase production was magnesium sul- phate (D) and this was followed by yeast extract (B), cop- per sulphate (G), sodium chloride (E) and ferrous sulphate (F). However, from the main effect plot (Fig. 2) it can be inferred that yeast extract and sodium chloride had the negative effect on the laccase production that is
higher concentrations decreased the production of lac- case. Increasing the levels of magnesium sulphate, cop- per sulphate and ferrous sulphate significantly increased the laccase production as evident from the main effect plot (Fig. 2). The main effect plot for glucose, dipotas- sium hydrogen orthophosphate, calcium chloride and potassium chloride was horizontal indicating that the response is same across all the factor levels. The potas- sium dihydrogen phosphate and zinc sulphate at higher concentrations increased the laccase production com- pared to lower concentrations; however, the effect of these factors was not statistically significant.
The significant variables with the negative effect (yeast extract and sodium chloride) and other insignifi- cant variables (dipotassium hydrogen phosphate, cal- cium chloride, potassium chloride, potassium dihydrogen phosphate and zinc sulphate) were maintained at their lower levels. The significant positive factors magnesium sulphate, copper sulphate and ferrous sulphate were selected for further optimization by response surface methodology.
Steepest ascent method
The steepest ascent path was determined to find the vicinity of optimum levels of variables by increasing or decreasing the concentration according to the sign of the Fig. 1. Half normal plot for laccase activity, alpha = 0.05. (B)
yeast extract, (D) magnesium sulphate, (E) sodium chloride, (F) ferrous sulphate, (G) copper sulphate.
Fig. 2. Main effect plot for laccase activity.
main effects in Plackett-Burman design to improve the laccase production. The path of the steepest ascent was started from the mid value between the low and high level of Plackett-Burman design and moved along the path of the increasing concentration of magnesium sul- phate, copper sulphate and ferrous sulphate as these factors had a positive effect. Based on the estimate of the selected variables, one basal increment (D) was defined for each selected variable: an increase in the concentra- tion of magnesium sulphate as 0.25 mM, copper sul- phate as 0.25 mM and ferrous sulphate as 0.05 g/l. The experimental design of steepest ascent method and lac- case activity in each run is shown in Table 3.
Table 3 portrays that the highest production of laccase (38.84 U/ml) reached at run 2 when the concentration of magnesium sulphate as 1.5 mM, ferrous sulphate as 0.35 g/l and copper sulphate as 1.5 mM. Moreover, a fur-
ther increase in the concentration of the selected vari- ables resulted in a decrease in the laccase production, which might be due to the inhibitory effect of any one of the selected components. The concentrations of the selected variables at run two were chosen as center points to optimize the media components in a Box- Behnken design.
Box-Behnken Design
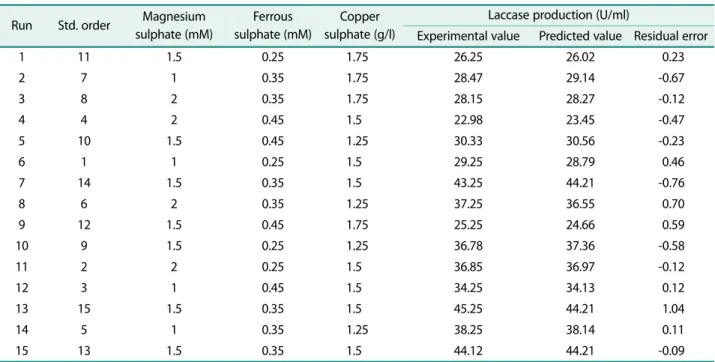
The three variables, namely magnesium sulphate, copper sulphate and ferrous sulphate that significantly affected the laccase production were optimized by response surface methodology using three factor three level Box-Behnken design. The experimental conditions and the corresponding results obtained are summarized in Table 4. The maximum production was observed in run 13 where the concentration of MgSO4, FeSO4 and CuSO4 are 1.5 mM, 0.35 g/l and 1.5 mM, respectively.
The lowest production was observed at run 4, where the MgSO4, FeSO4 and CuSO4 are 2.0 mM, 0.45 g/l and 1.5 mM at their uncoded values.
The P value (p ≤ 0.05) is used to determine whether the effect of each factor in the model is statistically sig- nificant. The adequacy of the model was tested, and the parameters with the statistically significant effects were identified using Fischer's test for analysis of variance Table 3. Steepest path for the laccase activity.
Run
Magnesium sulphate
(mM)
Ferrous sulphate
(g/l)
Copper sulphate
(mM)
Laccase activity
(U/ml)
0 1.00 0.25 1 .00 18.95
0 + 1∆ 1.25 0.30 1.25 24.10
0 + 2∆ 1.50 0.35 1.50 38.84
0 + 3∆ 1.75 0.40 1.75 26.78
Table 4. Box-Behnken design for laccase production in uncoded variables with the experimental and predicted values.
Run Std. order Magnesium sulphate (mM)
Ferrous sulphate (mM)
Copper sulphate (g/l)
Laccase production (U/ml)
Experimental value Predicted value Residual error
1 11 1.5 0.25 1.75 26.25 26.02 0.23
2 7 1 0.35 1.75 28.47 29.14 -0.67
3 8 2 0.35 1.75 28.15 28.27 -0.12
4 4 2 0.45 1.5 22.98 23.45 -0.47
5 10 1.5 0.45 1.25 30.33 30.56 -0.23
6 1 1 0.25 1.5 29.25 28.79 0.46
7 14 1.5 0.35 1.5 43.25 44.21 -0.76
8 6 2 0.35 1.25 37.25 36.55 0.70
9 12 1.5 0.45 1.75 25.25 24.66 0.59
10 9 1.5 0.25 1.25 36.78 37.36 -0.58
11 2 2 0.25 1.5 36.85 36.97 -0.12
12 3 1 0.45 1.5 34.25 34.13 0.12
13 15 1.5 0.35 1.5 45.25 44.21 1.04
14 5 1 0.35 1.25 38.25 38.14 0.11
15 13 1.5 0.35 1.5 44.12 44.21 -0.09
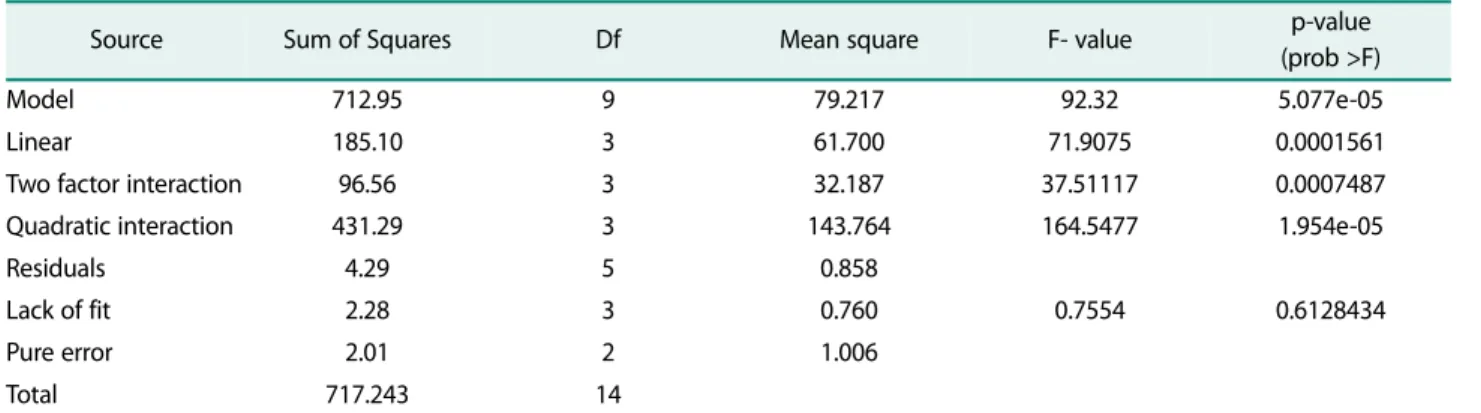
(ANOVA) and the results are presented in Table 5. The model F-value of 92.32 (Table 5) implied that developed model in the present study is statically significant.
According to Table 5, the high F-value (92.32), a low probability value (P < F < 0.05) and insignificant lack of fit (0.6128434) for the developed model indicated that the predicted value was in good agreement with the experimental value. The model prob > F value of 5.077 e-05 was less than 0.05 showed that the model terms were significant.
Multiple correlation coefficients (R2)is an estimate of the fraction of the overall variation in the data accounted by the model. In the present study, the regression equa- tion obtained from the ANOVA showed that the R2 value of 0.9940 (a value >0.75 indicates fitness of the model).
The model explained 99.4% of variations and could not
explain only 0.6% of the changes of the total model. The results indicated that predicted determination coeffi- cient (R2 predicted) of 0.9429 was in considerable agree- ment with the adjusted determinant coefficient of 0.9833. For a good statistical model, the value of R2 (pre- dicted) and R2 (adjusted) should be in the range of 0− 1.0. It confirmed that the proposed model was statisti- cally significant.
Response surface plot
The significant medium components were further ana- lyzed using 3D response surface plots, which are the graphical representations of the regression model. The optimum values of the variables were obtained by simu- lating the experimental results using the empirical model. From the 3D response surface plots, the interac- Table 5. ANOVA for the quadratic equation for the response surface model.
Source Sum of Squares Df Mean square F- value p-value
(prob >F)
Model 712.95 9 79.217 92.32 5.077e-05
Linear 185.10 3 61.700 71.9075 0.0001561
Two factor interaction 96.56 3 32.187 37.51117 0.0007487
Quadratic interaction 431.29 3 143.764 164.5477 1.954e-05
Residuals 4.29 5 0.858
Lack of fit 2.28 3 0.760 0.7554 0.6128434
Pure error 2.01 2 1.006
Total 717.243 14
R2 : 0.9940, Adj-R2 : 0.9833, Pred-R2: 0.9429, S: 0.926309, Press: 40.9889
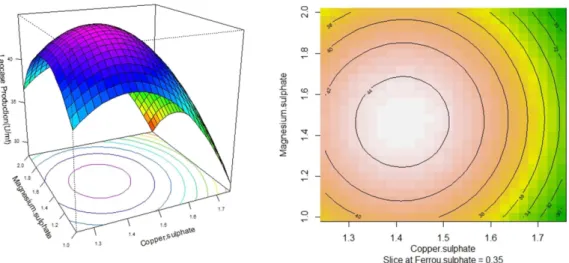
Fig. 3. Response surface and contour plots for the production of laccase by Bacillus sp. PK4 as a function of ferrous sulphate and magnesium sulphate.
tions between any two factors are convenient to under- stand and their optimum levels could also be obtained.
The laccase production was observed as a response vari- able to the interaction between any two variable while the rest of the variables are set as zero. The response surface plot better visualizes the tendency of each factor to influence the laccase production. The shape of the con- tour plot shows the nature and extent of interaction between the factors. An elliptical contour plot indicates a prominent interaction, whereas circular contour plot suggests negligible effect [13]. The elliptical contour plots (Fig. 3 and Fig. 5) were obtained for the interaction
between copper sulphate and ferrous sulphate, copper sulphate and magnesium sulphate demonstrating the significant interaction. The circular contour plot is obtained for magnesium sulphate and copper sulphate (Fig. 4) which implies that interaction is not significant.
The stationary point in their original units was found to be 1.5 mM, 0.33 g/l and 1.41 mM for magnesium sul- phate, ferrous sulphate and copper sulphate respec- tively. Their Eigenvalues were found to be negative (-3.762408, -6.083891 and -9.706201) which indicated that the stationary point is the point of maximum response. The 3D response surface plot and 2D contour Fig. 4. Response surface and contour plots for the production of laccase by Bacillus sp. PK4 as a function of magnesium sul- phate and copper sulphate.
Fig. 5. Response surface and contour plots for the production of laccase by Bacillus sp. PK4 as a function of ferrous sulphate and copper sulphate.
plot (Figs. 3 to 5) also revealed that the maximum response was located within the higher and lower values of variables, which further validated the tested parame- ters.
Validation of the model
The optimal conditions for the laccase production by the isolated strain Bacillus sp. PK4 were found to be medium with MgSO4 – 1.5 mM, FeSO4 – 0.33 g/land CuSO4 − 1.41 mM. The corresponding laccase production was 45.14 U/ml. To confirm the validity of the predicted optimal response, experiments were carried out in tripli- cates under the optimal conditions. The average laccase production in optimized media was found to be 40.79 U/
ml at the end of 42 h of incubation. The good agreement between the experimental and predicted results verified the validity of the model.
Thus, the optimized media composition by statistical design experiments for the laccase production by Bacillus sp. PK4 was glucose (1%), yeast extract (0.4%), zinc sul- phate (0.1 g/l), copper sulphate (1.41 mM), potassium chloride (0.1 g/l), magnesium sulphate (1.5 mM), calcium
chloride (0.02 g/l), ferrous sulphate (0.33 g/l), sodium chloride (0.1 g/l), KH2PO4 (0.1 g/l) and K2HPO4 (0.1 g/l).
Production of laccase by Bacillus sp. PK4 using agro waste substrates
The use of agro wastes and industrial wastes for lac- case production by microbes is an efficient way to reduce the cost of production. Gonzalez et al. [14] pointed out that laccase mediated delignification increases the nutri- tional value of agro-industrial by-products for animal feed or soil fertilizers. In the present study, sugarcane bagasse, wheat bran, rice husk and groundnut shell were used as substrates for the production of laccase by Bacillus sp. PK4 under submerged fermentation (SmF).
2,6 dimethoxy phenol (2,6 DMP) was used to monitor the laccase production at the end of 42 h of incubation. The results are presented in Table 6.
A significant increase in the laccase activity of Bacil- lus sp. PK4 was noticed in all the selected agro waste substrates when compared with laccase activity in opti- mized media (40.79 U/ml) with glucose as carbon source except wheat bran, which gave significantly lower lac-
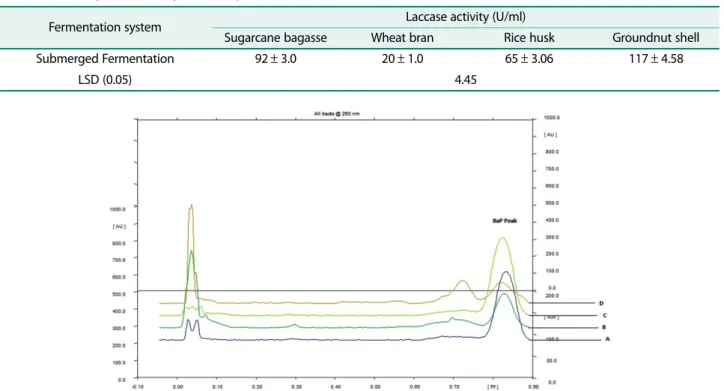
Table 6. Laccase production by Bacillus sp. PK4 in SmF.
Fermentation system Laccase activity (U/ml)
Sugarcane bagasse Wheat bran Rice husk Groundnut shell
Submerged Fermentation 92± 3.0 20± 1.0 65± 3.06 117± 4.58
LSD (0.05) 4.45
Fig. 6. HPTLC profile of BAP treated with Bacillus sp. PK4 laccase. (A) BAP treated with crude enzyme extract of Bacillus sp. PK4, (B) BAP treated with Tramates versicolor laccase, (C) BAP treated with heat inactivated crude enzyme extract of Bacillus sp. PK4, (D) BAP treated with crude enzyme extract of Bacillus sp. PK4.
case activity under SmF conditions. However, there was a significant (p < 0.05) difference in the laccase produc- tion by Bacillus sp. PK4 on different substrates. Bacillus sp. PK4 on groundnut shell gave significantly higher lac- case activity in comparison with other selected sub- strates.
Degradation of benzo[a]pyrene (BAP)
The HPTLC peak profile (densitometer scanning at 293 nm) of BAP degradation by bacterial laccase shows the presence of the additional peak in different Rf value (Fig. 6D). The BAP peak area at Rf value of 0.82 decreased gradually at 24 hr in both fungal and bacterial laccase treated sample (Fig. 6B and 6D). The BAP deg- radation ability of bacterial laccase is comparable with commercially available Tramates versicolor laccase. The heat-inactivated crude enzyme does not show any degra- dation of BAP (Fig. 6C) and it further confirms that enzyme plays a role in BAP degradation.
Discussion
Bacillus species have long been used in the industry for the production of secretory proteins and they gener- ate a large number of extracellular enzymes which play a significant role in present-day biotechnology. This spe- cies is widely exploited because of their pathogenicity and high secretion capacity and the existing knowledge about their fermentation technology. Secretion as the mode of production provides several advantages over intracellular production due to easier purification, higher yield, no aggregation of the production, possibility for disulfide formation, continuous cultivation and produc- tion [15]. The industrial scale application of laccase requires overproduction, which can be achieved by using genetic engineering and media manipulation. The media manipulation is the good method for the overproduction of enzyme as the secretion of the lignolytic enzyme is influenced by the media components and cultivation con- ditions. There is no general media for the laccase produc- tion by different microbial strain. Every microbe evidences its own idiosyncratic physicochemical and nutritional requirement for the growth and enzyme production.
Optimizing the production conditions for laccase is quite laborious and time-consuming. The use of statisti- cal design to optimize the media components and culture
conditions has increased in present-day due to its ready applicability and aptness. The model generated using Plackett-Burman PB design does not describe the inter- action among the factors as such, it is only used to evalu- ate and select the important factors that influence the response [16]. A significant variation in laccase produc- tion ranging from 0.14 to 11.48 U/ml was observed in the present study, which suggests the need for further opti- mization. Among the five significant variables identified in PB design, the yeast extract was found to exert the high negative effect. The effect of nitrogen source and its concentration on laccase production is highly divisive.
The high nitrogen concentrations (24 to 26 mM) are required to maximize the laccase production in white-rot fungi [17] with some exceptions Pycnoporus sp. [18, 19].
Cavallazzi et al. [20] reported that the effect of copper in laccase production in culture is higher in low nitrogen media (2.6 mM) rather than high nitrogen media (26 mM). In the present study, the yeast extract at higher concentration (1.5%) had a negative effect on the laccase production. It might be due to the interactive effect of copper in the presence of higher concentrations of nitrogen.
The steepest ascent and Box- Behnken design were applied to three significant positive factors identified in PB design which gave nearly a 4-fold increase in the lac- case production (40.79 U/ml) compared to unoptimized media (11.38 U/ml). The significance of the factors opti- mized in the present research namely MgSO4,CuSO4 and FeSO4 on laccase production was reported in previ- ous literature. Piscitelli et al. [21] reported that metal ions regulate laccase expression in fungi. Sondhi et al.
[22] reported MnSO4 and FeSO4 have maximum effect on laccase production in Bacillus tequilensis. Santo et al.
[23] demonstrated that copper plays a significant role in the induction of laccase production in bacteria. MgSO4 was the major considerable factor influencing the lac- case production in Coriolus versicolor [24] and Agaricus blazei [25]. Iron plays a major role in the induction of lac- case production by acting at the transcriptional level [26]. Niladevi et al. [27] showed MgSO4, yeast extract and trace element significantly increased the laccase production for Streptomyces psammoticus.
The production of laccase by Bacillus sp. PK4 was sig- nificantly increased when sugarcane bagasse, rice husk and groundnut shell were used as substrates and it was
found to be substantially reduced when wheat bran was used as the substrate in SmF in comparison to the lac- case activity in media containing glucose as sole carbon source. The observed significant difference in laccase production for the selected substrates might be due to their chemical and nutritional composition. Raju et al.
[28] reported that the groundnut shell has 19% hemicel- lulose, 36% cellulose, 30% lignin and 5.9% ash whereas sugarcane bagasse was found to have 40 to 46% cellu- lose, 24.5 to 29% hemicellulose, 12.5 to 20% lignin and 1.5 to 2.4% ash. On the other hand, rice husk is having 53.18% cellulose, 4.63% hemicelluloses, 19.67% lignin and 13.90% ash [29]. Finally, for wheat bran, the compo- sitions are 8% cellulose, 31% hemicelluloses, 4% lignin and 7% ash [30]. The lignin is one of the most important compounds associated with laccase production by microbes. A clear correlation between the lignin content and laccase activity was observed. The highest laccase activity was found in cultures that use groundnut shell, which is reported to have 30% lignin content. The wheat bran had lower lignin content (4%) compared to the other substrates produced the significantly lesser amount of laccase.
The lower laccase production in the media, which con- tains wheat bran as substrate could be related to the copper content and copper availability in the media. The copper adsorption by wheat bran, sugarcane bagasse, rice husk and groundnut shell has been reported in terms of Langmuir based maximum adsorption capacity (mg/g adsorbent) as 15.0 mg/g [31], 11.48 mg/g [32], 9.9 mg/g [33] and 10.15 mg/g [34] respectively. With the backdrop of this literature, it can be suggested that wheat bran has the maximum adsorption capacity of copper compared to other selected substrates thereby reducing the amount of exogenous copper available for laccase induction. Various reports have already cited that groundnut shell was used to enhance the laccase production in fungi [35, 36]. Our study also adds to these findings in which groundnut shell has been found to be a potential inducer of extracellular laccase by Bacillus sp.
PK4.
Before optimization, the extracellular laccase produc- tion was 2.13 U/ml and after optimization by statistical design of the experiment, the production was increased up to 40.79 U/ml and use of 10% agro waste residues resulted in the hike of 117 U/ml. Thus, a combination of
the statistical design of experiment and use of agrowaste residues achieved 63 fold increase in laccase production as compared with nonoptimized media.
Singh et al. [37] optimized process conditions for the laccase production in γ-proteobacterium using response surface methodology and achieved maximum laccase production of 7.4 × 10⁴ nkat/lit at pH 8.0, 210 rpm, 100μM of copper sulphate after 60 h of incubation.
Kuddus et al. [38] achieve the laccase production in Pseudomonas putida of 94.1 U/ml. Kaushik and Thakur [39] also demonstrated a nine-fold increase in laccase production in Bacillus sp. by optimizing the concentra- tion of tryptone, dextrose, CuSO4 and distillery effluent by Taguchi approach. The partially purified laccase from Bacillus sp. PK4 has the potential to degrade the high redox compound benzo[a]pyrene.
In summary, the media conditions were optimized for laccase production from Bacillus sp. PK4 using the sta- tistical design of experiment to give higher yield. The combination of agrowaste residue and optimized condi- tion resulted in 63-fold increase in laccase production.
The production of an enzyme at lower cost using agrowaste residues could help to exploit in a variety of bioremedia- tion and biotechnology applications. Moreover, the lac- case from Bacillus sp. PK4 has the potential to degrade polycyclic aromatic hydrocarbon benzo[a]pyrene, thus making the use of bacterial laccase in degradation of highly toxic environmental pollutants.
Acknowledgment
The authors thank Dr. V. Sharulatha, Assistant Professor, Depart- ment of Chemistry, Avinashilingam Institute for Home Science and Higher Education for Women, for providing the valuable suggestion in the analysis of HPTLC fingerprints.
Conflict of Interest
The authors declare that there is no conflict of interest with any researcher or funding agency.
References
1. Ihssen J, Reiss R, Luchsinger R, Meyer LT, Richter M. 2015. Bio- chemical properties and yields of diverse bacterial laccase-like multicopper oxidases expressed in Escherichia coli. Scientific Reports, 5: 10465.
2. Jeon JR, Chang YS. 2013. Laccase-mediated oxidation of small
organics: bifunctional roles for versatile application. Trends Bio- technol. 31: 335-341.
3. Mot AC, Silaghi-Dumitrescu R. 2012. Laccases: Complex architec- tures for one-electron oxidations. Biochem. 77: 1395-1407.
4. Quaratino D, Ciaffi M, Federici E, D’Annibale A. 2008. Response surface methodology study of laccase production in Panus tigri- nus liquid cultures. Biochem. Eng. J. 39: 236-246.
5. Shi X, Liu Q, Ma J, Liao H, Xiong X, Zheng K, et al. 2015. An acid- stable bacterial laccase identified from the endophyte Pantoea ananatis Sd-1 genome exhibiting lignin degradation and dye decolorization abilities. Biotechnol. Lett. 37: 2279-2288.
6. Givaudan A, Effosse A, Faure D, Potier P, Bouillant ML, Bally R.
1993. Polyphenol oxidase in Azospirillum lipoferum isolated from rice rhizosphere: Evidence for laccase activity in non-motile strains of Azospirllium lipoferum. FEMS Microbiol. Lett. 18: 205-210.
7. Enguita FJ, Martins LO, Henriques AO, Carrondo MA. 2003. Crystal structure of bacterial endospore coat component: a laccase with enhanced thermostability properties. J. Biol. Chem. 278: 19416- 19425.
8. Rajeswari M, Bhuvaneswari V. 2016. Production of extracellular laccase from the newly isolated Bacillus sp. PK4. Afri. J. Biotechnol.
15: 1813-1826.
9. Slomczynsky D, Nakas JP, Tanenbaum SW. 1995. Purification and characterization of laccase from Botrytis cinerea. Appl. Environ.
Microbiol. 61: 907-912.
10. Montgomeryd DC, Runger GC. 2002 Applied Statistics and Prob- ability for Engineers. third ed. John Wiley and Sons, New York, 200-250.
11. R Core Team. 2016. R: A language and environment for statistical computing. R Foundation for Statistical Computing, Vienna, Austria. URL https://www.R-project.org/
12. Fox J. 2011. Rcmdr: RCommander. Version 1.7-2
13. Fu JF, Zhao YQ, Wu QL. 2007. Optimising photoelectrocatalytic oxidation of fulvic acid using response surface methodology. J.
Hazard. Mater. 144: 499-505.
14. Gonzalez JC, Medina SC, Rodrigue A, Osma JF, Alméciga-Díaz CJ, Sánchez OF. 2013. Production of Trametes pubescens laccase under submerged and semi solid culture condition on agro industrial wastes. PLoS One 8: e73721.
15. Simonen M, Palva I. 1993. Protein secretion in Bacillus species.
Microbiological Reviews 57: 109-137.
16. Salihu A, Alam MZ, Abdul-Karim MI, Salleh HM. 2011. Optimiza- tion of lipase production by Candida cylindracea in palm oil mill effluent based medium using statistical experimental design. J.
Mol. Catal B: Enzym. 69: 66-73.
17. Gainfreda L, Xu F, Bollag JM. 1999. Laccases: a useful group of oxidoreductive enzymes. Biorem. J. 3: 11-26.
18. Eggert C, Temp U, Eriksson KL. 1996. The ligninolytic system of the white rot fungus Pycnoporus cinnabarinus: purification and characterisation of the laccase. Appl. Environ. Microbiol. 62: 1151- 1158.
19. Pointing SB, Jones EBG, Vrijmoed LLP. 2000. Optimization of lac- case production by Pycnoporus sanguineus in submerged liquid
culture. Mycologia 92: 139-144.
20. Cavallazzi JRR, Kasuya CM, Soares MA. 2005. Screening of induc- ers for laccase production by Lentinula edodes in liquid medium.
Braz. J. Microbiol. 36: 383-387.
21. Piscitelli A, Giardina P, Lettera V, Pezzella C, Sannia G, Faraco V.
2011. Induction and transcriptional regulation of laccases in fungi. Curr Genom. 12: 104-112.
22. Sondhi S, Sharma P, George N, Chauhan PS, Puri N, Gupta N.
2014. An extracellular thermo-alkai-stable laccase from Bacillus tequilensis SN4, with a potential to biobleach softwood pulp. 3 Biotech. 5: 175-185.
23. Santo M, Weitsman R, Sivan A. 2013. The role of the copper-bind- ing enzyme-laccase – in the biodegradation of polyethylene by the actinomycete Rhodococcus ruber. Int. Biodeter. Biodegr. 84:
204-210.
24. Arockiasamy S, Krishnan IPG, Anandakrishnan N, Seenivasan S, Sambath A, Venkatasubramani JP. 2008. Enhanced production of laccase from Coriolus versicolor NCIM 966 by nutrient optimiza- tion using response surface methodology. Appl. Biochem. Bio- technol. 151: 371-379.
25. doValle JS, Vandenberghe LPS, Santana TT, Linde GA, Colauto NB, Soccol CR. 2014. Optimization of Agaricus blazei laccase pro- duction by submerged cultivation with sugarcane molasses. Afr.
J. Microbiol. Res. 8: 939-946.
26. Fonsesca MI, Shimizu E, Zapata PD, Villalba LL. 2010. Copper inducing effect on laccase production of white rot fungi native form Misiones (Argentina). Enzyme Mirob. Tech. 46: 534-539.
27. Niladevi KN, Sukumaran RK, Jacob N, Anisha GS, Prema P. 2009.
Optimization of laccase production from a novel strain Strepto- myces psammoticus using response surface methodology. Micro- biol. Res. 164: 105-113.
28. Raju GU, Kumarappu S, Gaitonde VN. 2012. Mechanical and phys- ical characterization of agricultural waste reinforced polymer composites. J. Mater. Environ. Sci. 3: 907-916.
29. Ang TN, Yoon LW, Lee KM, Ngoh GC, Chua ASM, Lee MG. 2011.
Efficiency of ionic liquids in the dissolution of rice husk. BioRe- sources 6: 4790-4800.
30. Brijwani K, Oberoi HS, Vadlani PV. 2010. Production of cellulolytic enzyme system in mixed-culture solid-state fermentation of soy- bean hulls supplemented with wheat bran. Process Biochem. 45:
120-128.
31. Farajzadeh MA, Monji AB. 2004. Adsorption characteristics of wheat bran towards heavy metal cations. Sep. Sci. Technol. 38:
197-207.
32. Liu C, Ngo HH, Guo W, Tung KL. 2012. Optimal conditions for preparation of banana peels, sugarcane bagasse and water- melon rind in removing copper from water. Bioresource Technol.
119: 349-354.
33. Kumari AR, Babu PJ, Rao CK, Rao GJN, Swathi P, Sailokesh R. 2014.
Comparative study on kinetics, equilibrium and thermodynam- ics of the adsorption of copper (II) by plant biopolymers. Afr. J.
Adv. Biotechnol. 2: 13-32.
34. Li Q, Zhai J, Zhang W, Wang M, Zhou J. 2006. Kinetic studies of
adsorption of Pb(II), Cr(III) and Cu(II) from aqueous solution by sawdust and modified peanut husk. J. Hazard Mater. B. 141: 163- 167.
35. Irshad M, Bahadur BA, Anwar Z, Yaqoob M, Ijaz A, Iqbal, HMN.
2012. Decolorization applicability of sol-gel matrix-immobilzed laccase production from Ganoderma leucidum using agro-indus- trial waste. BioResources 7: 4249-4261.
36. Mishra A, Kumar S, Kumar S. 2008. Application of Box-Behnken experimental desingn for optimization of laccase production by Coriolus versicolor MTCC138 in solid-state fermentation. J. Sci. Ind.
Res. 67: 1098-1107.
37. Singh G, Ahuja N, Sharma P, Capalash N. 2009. Response surface method’ology for the optimized production of an alkalophilic laccase from γ-proteobacterium JB. BioResources. 4: 544-553.
38. Kuddus M, Joseph B, Ramteke PW. 2013. Production of laccase from newly isolated Pseudomonas putida and its application in bioremediation of synthetic dyes and industrial effluents. Bio- catal Agric. Biotechnol. 2: 333-338.
39. Kaushik G, Thakur IS. 2014. Production of laccase and optimiza- tion of its production by Bacillus sp. using distillery spent wash as inducer. Bioremediat. J. 18: 28-37.