Microalbuminuria is Independently Associated with Arterial Stiffness and Vascular Inflammation but not with Carotid Intima-Media Thickness in Patients with Newly Diagnosed Type 2 Diabetes or Essential Hypertension
The association between microalbuminuria (MAU) and the indices of macrovascular complication in patients with newly diagnosed type 2 diabetes (D) or essential hypertension (H) was evaluated. Total 446 patients were classified into four groups according to the urinary albumin-to-creatinine ratio: MAU-D (n = 104), normoalbuminuria (NAU)-D (n = 114), MAU-H (n = 116), and NAU-H (n = 112). The indices of macrovascular complication including arterial stiffness evaluated by pulse-wave-velocity (PWV), carotid intima-media thickness (IMT), and vascular inflammation marked by high-sensitivity C-reactive protein (hsCRP) were assessed. PWV, IMT, and hsCRP were higher in patients with MAU than in those with NAU in both diabetes and hypertension groups. In both MAU-D and MAU-H groups, PWV and hsCRP levels were positively correlated with MAU level (MAU-D: r = 0.47, 0.41, MAU-H: r = 0.36, 0.62, respectively, P < 0.05).
Additionally, PWV and hsCRP were independent factors predicting MAU (diabetes group:
OR 1.85, 1.54, hypertension group: OR 1.38, 1.51, respectively, P < 0.001), but not IMT.
MAU is independently associated with arterial stiffness and vascular inflammation but not with IMT in patients with newly diagnosed type 2 diabetes or essential hypertension, which emphasizes the importance of proactive clinical investigations for atherosclerotic
complications in patients with MAU, even in newly diagnosed diabetes or hypertension.
Key Words: Albuminuria; Vascular Stiffness; Carotid Intima-Media Thickness;
Inflammation Dong Il Shin,1 Ki-Bae Seung,2
Hye Eun Yoon,3 Byung-Hee Hwang,2 Suk Min Seo,1 Seok Joon Shin,3 Pum-Joon Kim,2 Kiyuk Chang,2 and Sang Hong Baek2
1Division of Cardiology, Department of Internal Medicine, Incheon St. Mary’s Hospital, The Catholic University of Korea, Incheon; 2Division of Cardiology, Department of Internal Medicine, Seoul St. Mary’s Hospital, The Catholic University of Korea, Seoul;
3Division of Nephrology, Department of Internal Medicine, Incheon St. Mary’s Hospital, The Catholic University of Korea, Incheon, Korea
Received: 30 July 2012 Accepted: 6 December 2012 Address for Correspondence:
Ki-Bae Seung, MD
Division of Cardiology, Department of Internal Medicine, Seoul St. Mary’s Hospital, The Catholic University of Korea, 222 Banpo-daero, Seocho-gu, Seoul 137-701, Korea Tel: +82.2-2258-1139, Fax: +82.2-591-1506 E-mail: [email protected]
http://dx.doi.org/10.3346/jkms.2013.28.2.252 • J Korean Med Sci 2013; 28: 252-260 Cardiovascular Disorders
INTRODUCTION
Patients with type 2 diabetes or essential hypertension general- ly have a substantial burden of the macrovascular complication including atherosclerotic cardiovascular disease (CVD) (1, 2).
Despite the successful adoption of evidence-based strategies, a greater number of patients are not appropriately identified be- fore their first attack, or they continue to experience cardiovas- cular events despite optimal managements (1, 2). Thus, there has been mounting interest in the early assessment of the risk for macrovascular atherosclerotic complications in patients with diabetes or hypertension (1-3).
Several indices including arterial stiffness, vascular inflam- matory markers, and carotid intima-media thickness (IMT) have been applied to estimate the macrovascular complication (4, 5).
Arterial stiffness plays an important role in the occurrence of atherosclerotic CVD (3, 4). The measurement of pulse wave ve-
locity (PWV) has been generally accepted as the gold standard for determining arterial stiffness (5, 6). Moreover, this surrogate index of large artery compliance has been demonstrated to pre- dict cardiovascular morbidity and mortality in a variety of pop- ulations (3-7). Additionally, increased IMT has also been report- ed as a risk factor for future cardiovascular events in patients with diabetes or hypertension (8).
Meanwhile, microalbuminuria (MAU) is regarded as an early index of generalized microvascular impairment including en- dothelial dysfunction, which reflects subclinical vascular ab- normalities of renal glomeruli (4, 9). The detection of MAU is the main clue for the early recognition and treatment of clini- cally evident microvascular complications in diabetic or hyper- tensive patients (2, 10). Furthermore, MAU is also highly associ- ated with an increased risk of atherosclerotic CVD in patients with type 2 diabetes or essential hypertension (5, 9).
The positive, independent associations between MAU, a mark-
er of microvascular dysfunction, and the indices of macrovas- cular complication such as PWV, IMT, and serum high-sensitiv- ity C-reactive protein (hsCRP) in patients with type 2 diabetes or essential hypertension have been reported in several previ- ous studies (3, 5, 11-13). However, some other studies showed conflicting results, especially for the association between MAU and IMT (6, 14). Additionally, many previous studies included the patients with longstanding diabetes or hypertension or with unclear duration of diseases as study subjects. Thus, it is yet to be determined whether the marker of microvascular dysfunc- tion is positively associated with all the indices of macrovascu- lar complications, especially in patients with early stage or new- ly diagnosed type 2 diabetes or essential hypertension. Conse- quently, we investigated the association between the presence of MAU and the indices of macrovascular complication such as PWV, IMT, and hsCRP in patients with newly diagnosed type 2 diabetes or essential hypertension who had never been treated.
MATERIALS AND METHODS Study population
Of the patients who had been receiving regular medical check- ups at the health promotion centers of Incheon St. Mary’s Hos- pital and Seoul St. Mary’s Hospital from April 2009 to June 2012, only those newly diagnosed with type 2 diabetes or essential hypertension within the prior 12 months were enrolled consec- utively in this study. They had never received medical treatments for diabetes or hypertension. All medical documents of the pa- tients including the health check-up records were reviewed.
Through this process, we excluded those who have had diabe- tes or hypertension more than 12 months as well as those with unclear duration of diseases due to absence or uncertainty of medical records. Type 2 diabetes was diagnosed according to the level of fasting blood glucose (FBG) or the result of addition- al 75 g oral glucose tolerance test (OGTT) (15). For the patients with FBG levels ≥ 126 mg/dL on their medical check-ups, an additional check of FBG or a 75 g OGTT was performed. The patients who had additionally met the following criteria of re- checked FBG ≥ 126 mg/dL or 2-hr postload glucose ≥ 200 mg/
dL in OGTT were diagnosed as diabetes. We did not use the di- agnostic criteria according to the level of hemoglobin A1c. Es- sential hypertension was diagnosed according to the criteria of the Seventh Report of the Joint National Committee on Preven- tion, Detection, Evaluation, and Treatment of High Blood Pres- sure (16). Patients with type 1 diabetes or secondary hyperten- sion were excluded based on the clinical and laboratory find- ings. Patients who manifested diabetes and hypertension simul- taneously at the time of inclusion were also excluded. Other ex- clusion criteria were age < 18 or > 65 yr; evidence of clinically evident nephropathy (estimated glomerular filtration rate [eGFR]
< 60 mL/min/1.73 m2 or overt proteinuria) (17); previous ther-
apy for hypertension or diabetes; electrocardiographic or echo- cardiographic left ventricular hypertrophy (LVH); and positive history or clinical signs of atherosclerotic CVD, heart failure, in- fection, and neoplastic or inflammatory diseases.
Baseline biochemical assays
In all the subjects, a fasting venous blood sample was taken to estimate the routine blood chemistry including the level of hsCRP. The serum hsCRP was measured via the commercially available enzyme-linked immunosorbent assay (ELISA) (5).
From all subjects enrolled who were newly diagnosed as type 2 diabetes or essential hypertension, the first morning spot urine samples were collected for 3 consecutive days before the initial medical therapy to determine the urinary albumin-to-creatinine ratio (ACR). ACR for each subject was determined as the mean value for 3 days. The urinary albumin concentration was mea- sured by subjecting a spot urine sample to a latex agglutination immunoassay on an auto-analyzer (LX-6000®, Eiken Kagaku Co., Tokyo, Japan). The urinary creatinine concentration was measured through an enzymatic method. To define MAU, we used the ACR cut-off values of 30-300 mg/g for both men and women (4). The ACR of 30-300 mg/g was defined as MAU. Nor- moalbuminuria (NAU) was defined as the ACR of less than 30 mg/g and overt proteinuria (or macroalbuminuria) was defined as the ACR of more than 300 mg/g (4). The baseline renal func- tion was estimated based on the eGFR, using the Cockcroft- Gault formula (18).
Classification of the study groups
According to the criteria of normo- and microalbuminuria, all the subjects were classified into four groups: diabetes with mi- croalbuminuria (MAU-D), hypertension with microalbumin- uria (MAU-H), diabetes with normoalbuminuria (NAU-D), and hypertension with normoalbuminuria (NAU-H).
Measurement of PWV
A volume-plethysmographic apparatus (VP2000, Colin Co. Ltd., Komaki, Japan) was used to measure the blood pressure (BP), electrocardiogram, heart sounds, and bilateral PWV. The bilat- eral brachial-ankle PWV was measured in all study subjects us- ing the previously validated method (4, 14, 19) on the first day of taking a urine sample. The subjects were examined in the supine position. A microphone for detecting heart sounds was placed on the left edge of the sternum, and electrocardiogram electrodes were placed on both forearms. Doppler sensors were placed on the right carotid artery and right femoral artery. Cuffs were wrapped on both the brachials and ankles. Both were con- nected to a plethysmographic sensor to determine the pulse volume waveforms, with an oscillometric pressure sensor mea- suring the BP. The PWV sample acquisition frequency was set at 1,200 Hz. The volume waveforms for the bilateral brachial and
ankle arteries were stored. Repeated samples were taken at 10- second intervals via an automatic gain analysis and quality ad- justment. Finally, the mean values of the right and left PWV were calculated for the final analysis.
Measurement of IMT
Ultrasonographic scanning was also performed simultaneously with PWV to determine the carotid IMT and other routine echo- cardiographic parameters, all of which were analyzed in the core laboratory by the same examiner. Carotid duplex scanning was performed via high-resolution ultrasonography (Vivid 7®, GE Medical Systems, Milwaukee, WI, USA), using a 12 MHz in- line scanner to estimate the IMT in all the subjects. The carotid arteries were scanned bilaterally in longitudinal and transverse projections. The site of the greatest distance between the lumen- intimal interface and the media-adventitial interface (IMT) was measured in the right and left carotid arteries. IMT measure- ment was performed on at least three standard sites on the far wall of the common carotid artery (CCA) and carotid bulb (6, 8, 19). The first site was measured from the take-off of the CCA to a point 2 cm proximal to the carotid bulb, and the second was from 2 cm proximal to the carotid bulb to the beginning of the carotid bulb. The third measurement was performed from the beginning of the carotid bulb to the bifurcation of the internal and external carotid arteries. The selected images for these sites were printed for the measurement of the mean values of the right and left carotid IMT. The mean values of the right and left carotid IMT were used for the final analysis. Apparently, the fo- cally extruded plaque was excluded in the estimation.
Statistical analysis
Continuous variables were expressed as means ± SD. The sta- tistical differences were compared using an unpaired Student’s t-test. The levels of triglyceride, hsCRP, and ACR were expressed as median (range) and a Mann-Whitney U test was used to de- termine the statistical differences. Categorical variables were presented as frequency counts, and the results of the intergroup comparisons were analyzed through a chi-square test. The de- grees of correlation between the variables were assessed using the Pearson’s correlation coefficient analysis (r). Multivariate logistic regression analysis was performed for the identification of the independent factors for MAU. Triglyceride, hsCRP, and ACR were natural logarithmically transformed to permit appli- cation of normal distribution statistics. Variables for univariate analysis were selected based on the previous reports having similar issues (5, 6, 14). Univariate variables with a P < 0.20 were entered into multivariate logistic models. The odds ratio and 95% confidence intervals were also calculated. The statistical significance was set at P < 0.05. All the statistical analyses were performed using the SPSS statistical software, version 18.0 (Chi- cago, IL, USA).
Ethics statement
The study protocol of this two-center observational study was reviewed and approved by the institutional review board of the Catholic University of Korea (IRB No. XC11EIMI0022K). All of the participants had submitted their written informed consent.
RESULTS
A total of 558 patients newly diagnosed as type 2 diabetes or es- sential hypertension were enrolled during the study period (the duration of diseases < 12 months). Out of these patients, 112 patients were excluded because they manifested diabetes and hypertension simultaneously (n = 56), lacked fully available medical information that included previous laboratory findings (n = 31), had clinically evident nephropathy (n = 20) and met other exclusion criteria (n = 5). Therefore, the final analysis was
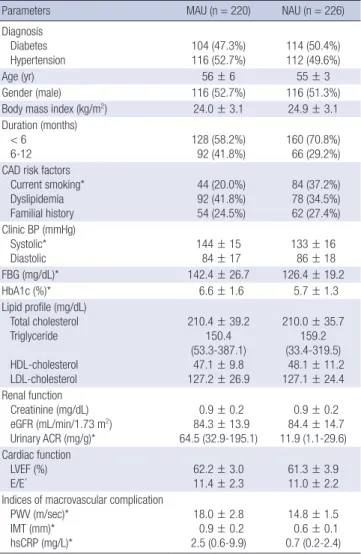
Table 1. Baseline characteristics of MAU and NAU groups
Parameters MAU (n = 220) NAU (n = 226)
Diagnosis Diabetes Hypertension
104 (47.3%) 116 (52.7%)
114 (50.4%) 112 (49.6%)
Age (yr) 56 ± 6 55 ± 3
Gender (male) 116 (52.7%) 116 (51.3%)
Body mass index (kg/m2) 24.0 ± 3.1 24.9 ± 3.1
Duration (months) < 6 6-12
128 (58.2%) 92 (41.8%)
160 (70.8%) 66 (29.2%) CAD risk factors
Current smoking*
Dyslipidemia Familial history
44 (20.0%) 92 (41.8%) 54 (24.5%)
84 (37.2%) 78 (34.5%) 62 (27.4%) Clinic BP (mmHg)
Systolic*
Diastolic 144 ± 15
84 ± 17 133 ± 16
86 ± 18
FBG (mg/dL)* 142.4 ± 26.7 126.4 ± 19.2
HbA1c (%)* 6.6 ± 1.6 5.7 ± 1.3
Lipid profile (mg/dL) Total cholesterol Triglyceride HDL-cholesterol LDL-cholesterol
210.4 ± 39.2 150.4 (53.3-387.1)
47.1 ± 9.8 127.2 ± 26.9
210.0 ± 35.7 159.2 (33.4-319.5) 48.1 ± 11.2 127.1 ± 24.4 Renal function
Creatinine (mg/dL) eGFR (mL/min/1.73 m2) Urinary ACR (mg/g)*
0.9 ± 0.2 84.3 ± 13.9 64.5 (32.9-195.1)
0.9 ± 0.2 84.4 ± 14.7 11.9 (1.1-29.6) Cardiac function
LVEF (%)
E/E´ 62.2 ± 3.0
11.4 ± 2.3 61.3 ± 3.9 11.0 ± 2.2 Indices of macrovascular complication
PWV (m/sec)*
IMT (mm)*
hsCRP (mg/L)*
18.0 ± 2.8 0.9 ± 0.2 2.5 (0.6-9.9)
14.8 ± 1.5 0.6 ± 0.1 0.7 (0.2-2.4)
*Significant difference between MAU and NAU groups (P < 0.05). MAU, microalbu- minuria; NAU, normoalbuminuria; CAD, coronary artery disease; BP, blood pressure;
FBG, fasting blood sugar; HbA1c, hemoglobin A1c; HDL, high-density lipoprotein; LDL, low-density lipoprotein; eGFR, estimated glomerular filtration rate; ACR, albumin-to- creatinine ratio; LVEF, left ventricle ejection fraction; PWV, brachial-ankle pulse wave velocity; IMT, carotid intima-media thickness; hsCRP, high-sensitivity C-reactive protein.
performed on a total of 446 patients (79.9%). MAU was observed in 220 (49.3%) patients (104 in MAU-D group and 116 in MAU-H group), and 226 demonstrated NAU (114 in NAU-D group and 112 in NAU-H group). Table 1 shows the baseline characteris- tics of both MAU and NAU groups. In most patients, the dura- tion of the disease was less than six months (58.2% in MAU group and 70.8% in NAU group). No significant difference was observed between the two groups in terms of the baseline characteristics,
except for the frequency of current smoking and the levels of systolic blood pressure, fasting blood glucose and hemoglobin A1c (Table 1). However, the levels of PWV, IMT, and hsCRP were significantly higher in MAU group than in NAU group (P < 0.001, Table 1).
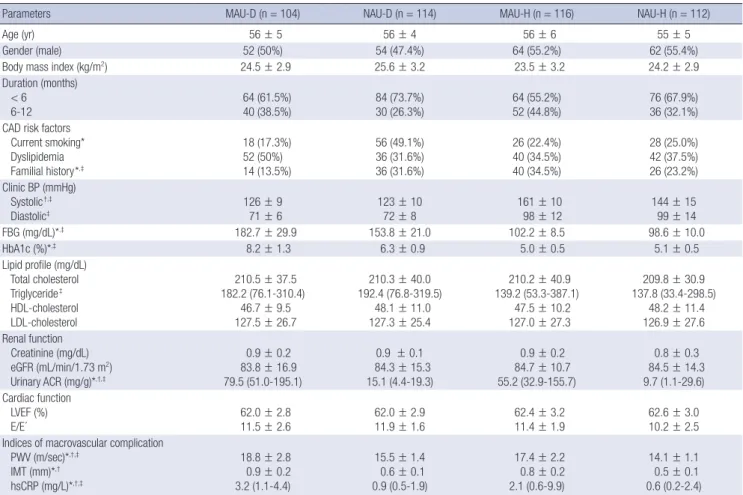
In comparing MAU-D and NAU-D groups, no significant dif- ferences were seen in most of the baseline characteristics, ex- cept for the frequency of coronary artery disease familial history and current smoking. However, MAU-D group had the higher levels of fasting blood glucose and hemoglobin A1c than NAU- D group (Table 2). The mean PWVs were 18.8 ± 2.8 m/sec in MAU-D group and 15.5 ± 1.4 m/sec in NAU-D group (P < 0.001).
The carotid IMT and hsCRP levels were also significantly higher in MAU-D group than in NAU-D group (0.9 ± 0.2 mm vs 0.6 ± 0.1 mm and 3.2 (1.1-4.4) mg/L vs 0.9 (0.5-1.9) mg/L, respectively;
P < 0.001, Table 2).
In comparison between MAU-H and NAU-H groups, the level of systolic blood pressure was higher in MAU-H group than in NAU-H group (Table 2). MAU-H group demonstrated higher levels of PWV, IMT, and hsCRP than NAU-H group (17.4 ± 2.2 Table 2. Baseline characteristics of MAU-D, NAU-D, MAU-H and NAU-H groups
Parameters MAU-D (n = 104) NAU-D (n = 114) MAU-H (n = 116) NAU-H (n = 112)
Age (yr) 56 ± 5 56 ± 4 56 ± 6 55 ± 5
Gender (male) 52 (50%) 54 (47.4%) 64 (55.2%) 62 (55.4%)
Body mass index (kg/m2) 24.5 ± 2.9 25.6 ± 3.2 23.5 ± 3.2 24.2 ± 2.9
Duration (months) < 6
6-12 64 (61.5%)
40 (38.5%) 84 (73.7%)
30 (26.3%) 64 (55.2%)
52 (44.8%) 76 (67.9%)
36 (32.1%) CAD risk factors
Current smoking*
Dyslipidemia Familial history*,‡
18 (17.3%) 52 (50%) 14 (13.5%)
56 (49.1%) 36 (31.6%) 36 (31.6%)
26 (22.4%) 40 (34.5%) 40 (34.5%)
28 (25.0%) 42 (37.5%) 26 (23.2%) Clinic BP (mmHg)
Systolic†,‡
Diastolic‡
126 ± 9 71 ± 6
123 ± 10 72 ± 8
161 ± 10 98 ± 12
144 ± 15 99 ± 14
FBG (mg/dL)*,‡ 182.7 ± 29.9 153.8 ± 21.0 102.2 ± 8.5 98.6 ± 10.0
HbA1c (%)*,‡ 8.2 ± 1.3 6.3 ± 0.9 5.0 ± 0.5 5.1 ± 0.5
Lipid profile (mg/dL) Total cholesterol Triglyceride‡ HDL-cholesterol LDL-cholesterol
210.5 ± 37.5 182.2 (76.1-310.4)
46.7 ± 9.5 127.5 ± 26.7
210.3 ± 40.0 192.4 (76.8-319.5)
48.1 ± 11.0 127.3 ± 25.4
210.2 ± 40.9 139.2 (53.3-387.1)
47.5 ± 10.2 127.0 ± 27.3
209.8 ± 30.9 137.8 (33.4-298.5)
48.2 ± 11.4 126.9 ± 27.6 Renal function
Creatinine (mg/dL) eGFR (mL/min/1.73 m2) Urinary ACR (mg/g)*,†,‡
0.9 ± 0.2 83.8 ± 16.9 79.5 (51.0-195.1)
0.9 ± 0.1 84.3 ± 15.3 15.1 (4.4-19.3)
0.9 ± 0.2 84.7 ± 10.7 55.2 (32.9-155.7)
0.8 ± 0.3 84.5 ± 14.3 9.7 (1.1-29.6) Cardiac function
LVEF (%) E/E´
62.0 ± 2.8 11.5 ± 2.6
62.0 ± 2.9 11.9 ± 1.6
62.4 ± 3.2 11.4 ± 1.9
62.6 ± 3.0 10.2 ± 2.5 Indices of macrovascular complication
PWV (m/sec)*,†,‡
IMT (mm)*,†
hsCRP (mg/L)*,†,‡
18.8 ± 2.8 0.9 ± 0.2 3.2 (1.1-4.4)
15.5 ± 1.4 0.6 ± 0.1 0.9 (0.5-1.9)
17.4 ± 2.2 0.8 ± 0.2 2.1 (0.6-9.9)
14.1 ± 1.1 0.5 ± 0.1 0.6 (0.2-2.4)
*Significant difference between MAU-D and NAU-D groups (P < 0.05); †Significant difference between MAU-H and NAU-H groups (P < 0.05); ‡Significant difference between MAU-D and MAU-H groups (P < 0.05). MAU-D, diabetes with microalbuminuria; NAU-D, diabetes with normoalbuminuria; MAU-H, hypertension with microalbuminuria; NAU-H, hypertension with normoalbuminuria; CAD, coronary artery disease; BP, blood pressure; FBG, fasting blood sugar; HbA1c, hemoglobin A1c; HDL, high-density lipoprotein; LDL, low-density lipoprotein; eGFR, estimated glomerular filtration rate; ACR, albumin-to-creatinine ratio; LVEF, left ventricle ejection fraction; PWV, brachial-ankle pulse wave veloci- ty; IMT, carotid intima-media thickness; hsCRP, high-sensitivity C-reactive protein.
Table 3. Correlation between the level of MAU and the levels of other predictors
Predictors
MAU-D MAU-H
Pearson correlation coefficient P
Pearson correlation coefficient P
PWV (m/sec) 0.47 0.002 0.36 0.005
IMT (mm) 0.22 0.18 0.17 0.19
(Log) hsCRP (mg/L) 0.41 0.007 0.62 < 0.001
The level of MAU = (Log) ACR (mg/g). MAU-D, diabetes with microalbuminuria; NAU-D, diabetes with normoalbuminuria; MAU-H, hypertension with microalbuminuria; NAU-H, hypertension with normoalbuminuria; PWV, brachial-ankle pulse wave velocity; IMT, carotid intima-media thickness; hsCRP, high-sensitivity C-reactive protein; ACR, albu- min-to-creatinine ratio.
m/sec vs 14.1 ± 1.1 m/sec, 0.8 ± 0.2 mm vs 0.5 ± 0.1 mm, and 2.1 (0.6-9.9) mg/L vs 0.6 (0.2-2.4) mg/L, respectively; P < 0.001, Ta- ble 2).
To estimate the differences in the association of MAU with the indices of macrovascular complications between the diabetic and hypertensive groups, MAU-D group and MAU-H group were compared (Table 2). The IMT level was not statistically dif- ferent between the two groups (P = 0.18). However, MAU-D group had significantly higher levels of PWV and hsCRP than MAU-H group (PWV: P = 0.02, hsCRP: P = 0.03).
Table 3 and Fig. 1 demonstrate the correlation between the MAU level (Log ACR) and the levels of PWV, IMT, and hsCRP in MAU-D and MAU-H groups. In MAU-D group, the MAU level showed a positive correlation with the PWV and hsCRP levels (PWV: r = 0.47; P = 0.002, hsCRP: r = 0.41; P = 0.007, respec- tively) but not with the IMT level (r = 0.22; P = 0.18). In MAU-H group, the MAU level was also shown to be positively correlated with the PWV and hsCRP levels (PWV: r = 0.36; P = 0.005, hsCRP:
r = 0.62, P < 0.001, respectively) but not with the IMT level (r = 0.17; P = 0.19).
Multivariate logistic regression analysis was performed to de-
termine the independent factors related to MAU (Table 4). The analysis demonstrated that PWV and hsCRP were the indepen- dent factors related to MAU both in the diabetes group (OR 1.85, 1.54, respectively; P < 0.001) and in the hypertensive group (OR 1.38, 1.51, respectively; P < 0.001). Serum fasting blood glucose in the diabetes group and systolic BP in the hypertensive group were also revealed as the independent factors related to MAU (OR 1.21; P = 0.04, OR 1.26; P = 0.03, respectively), but IMT was not an independent factor.
DISCUSSION
In the present study, the most important finding was that MAU was independently associated with arterial stiffness and vascu- lar inflammation even in the patients with newly diagnosed type 2 diabetes or essential hypertension. However, MAU did not show an independent association with IMT in both diabe- tes and hypertension groups. Additionally, in comparison be- tween diabetic patients with MAU and hypertensive patients with MAU, the levels of PWV and hsCRP were significantly high- er in the diabetic group than in the hypertensive group, while Fig. 1. Correlations between the level of MAU and the levels of PWV and hsCRP. In both MAU-D (A, B) and MAU-H (C, D) groups, the MAU level (Log ACR) was positively corre- lated with the levels of PWV and hsCRP. MAU-D, diabetes with microalbuminuria; MAU-H, hypertension with microalbuminuria; ACR, albumin-to-creatinine ratio; PWV, brachial- ankle pulse wave velocity; hsCRP, high-sensitivity C-reactive protein.
(Log) ACR (mg/g)(Log) ACR (mg/g) (Log) ACR (mg/g)(Log) ACR (mg/g)
5.5
5.0
4.5
4.0
3.5
5.0
4.5
4.0
3.5
3.0
2.5
5.5
5.0
4.5
4.0
3.5
5.0
4.5
4.0
3.5
3.0 PWV (m/sec)
PWV (m/sec)
(Log) hsCRP (mg/L)
(Log) hsCRP (mg/L)
16.0 18.0 20.0 22.0
12.0 14.0 16.0 18.0 20.0
0.0 0.5 1.0 1.5
-0.5 0.0 0.5 1.0 1.5 2.0 2.5
r = 0.47 P = 0.002
r = 0.36 P = 0.005
r = 0.41 P = 0.007
r = 0.62 P < 0.001 A
C
B
D
the level of IMT was similar between both of the groups. Al- though the disease duration was not significantly different be- tween the 2 groups, the level of MAU (ACR) was significant high- er in the diabetic group. Based on our result which demonstrat- ed the independent association of MAU with PWV and hsCRP, the higher level of MAU could account for the higher level of PWV and hsCRP in the diabetic group than in the hypertensive group. Moreover, the result could suggest that endothelial dys- function more rapidly progress in the diabetic group than in the hypertensive group since MAU and PWV were considered as markers of vascular endothelial dysfunction and an inflamma- tory stimulus also may trigger endothelial dysfunction (4, 5, 22).
While several cross-sectional studies have demonstrated a relationship between MAU and arterial stiffness in various pop- ulations (3-6, 11, 14), there have been few reports on the associ- ation between MAU and arterial stiffness in patients with un- treated, newly diagnosed type 2 diabetes or essential hyperten- sion. Recently, Mulè et al. (3) have shown a correlation between albumin excretion rate and aortic stiffness in untreated essen- tial hypertensive patients diagnosed within the past 2 yr. How- ever, they enrolled only 19 microalbuminuric hypertensive pa- tients. Also, they did not evaluate the association between MAU and other macrovascular indices such as IMT and hsCRP. Oth- er previous studies which revealed the independent association
between MAU and arterial stiffness have enrolled patients with relatively long duration of diseases (6, 14), or patients with un- clear duration of diseases (5), or general populations (4, 11) as study subjects. Although atherosclerotic cardiovascular risk has been reported to be elevated at the earliest stages of diabetes or hypertension (17, 21), it is not clear whether this association based on the results from patients with advanced stage of dia- betes and hypertension can be extrapolated to the patients on early stage of the diseases. In this regard, this study has a merit of recruiting only patients with untreated, newly diagnosed dia- betes or hypertension, whose duration of diseases was clear (less than 12 months), as study subjects.
Although both PWV and IMT have been regarded as the in- dices of subclinical or early atherosclerosis (4, 22), the present study has shown that MAU was independently associated with only arterial stiffness but not with IMT. While IMT was higher in patients with MAU than in those with NAU, the level of IMT was neither positively correlated with MAU level nor revealed as an independent factor for MAU. This finding of the preferen- tial association of MAU with increased arterial stiffness over IMT coincides with the results of previous reports. Ishimura et al.
demonstrated that urinary albumin excretion was significantly associated with arterial wall stiffness rather than IMT in type 2 diabetic patients (6). In addition, Mulè et al. also reported that Table 4. Independent factors related to MAU
Variables Univariate Multivariate
OR 95% CI P OR 95% CI P
In patients with type 2 diabetes Age
Male Body mass index Smoking FBG HbA1c Total cholesterol (Log) Triglyceride HDL-cholesterol LDL-cholesterol (Log) hsCRP PWV IMT
0.92 1.11 0.89 0.91 1.18 1.20 1.04 1.21 1.16 1.04 1.55 1.58 1.01
0.98-1.09 0.52-2.36 0.79-1.01 0.41-1.99 0.96-1.38 0.96-1.51 0.95-1.57 0.97-1.61 0.99-2.62 0.88-1.54 1.18-2.03 1.30-1.92 0.61-1.66
0.89 0.78 0.07 0.81 0.03 0.13 0.43 0.07 0.78 0.51
< 0.001
< 0.001 0.98
0.88 1.21 1.33 1.06 1.54 1.85
0.60-1.32 1.01-1.44 0.93-1.89 0.89-1.78
1.16-2.01 1.29-2.63
0.89 0.04 0.12 0.23
< 0.001
< 0.001 In patients with essential hypertension
Age Male
Body mass index Smoking Systolic BP Diastolic BP Total cholesterol (Log) Triglyceride HDL-cholesterol LDL-cholesterol (Log) hsCRP PWV IMT
1.01 0.99 0.93 1.93 1.24 0.99 1.42 1.53 1.82 1.11 1.47 1.18 1.01
0.95-1.07 0.47-2.08 0.83-1.06 0.88-4.25 1.12 -1.37 0.97-1.02 0.65-3.78 0.42-3.79 0.78-2.17 0.89-1.13 1.28-1.66 1.11-1.25 0.77-1.31
0.83 0.98 0.27 0.10 0.05 0.62 0.48 0.63 0.84 0.68
< 0.001
< 0.001 0.97
2.22 1.26
1.51 1.38
0.65-9.23 1.12-1.43
1.29-1.74 1.11-1.68
0.19 0.03
< 0.001
< 0.001
OR, odds ratio; CI, confidence interval; FBG, fasting blood glucose; HbA1c, hemoglobin A1c; HDL, high-density lipoprotein; LDL, low-density lipoprotein; hsCRP, high-sensitivity C-reactive protein; PWV, brachial-ankle pulse wave velocity; IMT, carotid intima-media thickness; BP, blood pressure.
MAU was independently associated with increased aortic stiff- ness in patients with essential hypertension (5). Meanwhile, ar- terial stiffness has been closely linked with microvascular com- plications, such as diabetic neuropathy and retinopathy (23, 24).
These findings are consistent with our results, which demon- strated a close correlation between the markers of microvascular dysfunction and large artery stiffening. On the other hand, con- flicting results about the relationship between MAU and IMT have been reported in some previous studies. Keech et al. (13) indicated that IMT in patients with type 2 diabetes was inde- pendently related to urine albumin levels. Furthermore, Huang et al. (12) showed that even low-grade albuminuria, which was below the cutoff point of MAU, was associated with high IMT in type 2 diabetic patients. Whereas, some other studies reported that MAU was not independently associated with IMT, which could be in line with our results (6, 14). Especially, Choi et al.
(14) studied in total 673 Korean type 2 diabetic patients and in- dicated that albuminuria was significantly associated with PWV but not with carotid plaque or IMT. However, their study sub- jects also had relatively long duration of diabetes; mean 10.1 yr (6) and mean 8.9 yr (14). Thus, in the present study, we tried to determine the association between MAU and IMT in only pa- tients with the newly diagnosed diseases.
Although the precise reasons why IMT did not have statisti- cally independent correlation with MAU in the present study still remains elusive, there might be several possible explana- tions. First, the short duration of diseases in the present study could account for the result. Interestingly, it has been reported that the duration of diseases was independently correlated to IMT in patients with type 2 diabetes (13) and those with essen- tial hypertension (25). In most of our study subjects, the disease duration was only less than 6 months. Secondly, because the formation and progression of carotid plaque commonly occur at place of non-laminar turbulent flow such as the proximal in- ternal carotid artery or bifurcating segments (14), the assess- ment of IMT within common carotid artery in the present study might not necessarily reflect an atherosclerotic process. Finally, a small number of patients were included in the analysis. Al- though the association between MAU and IMT was not inde- pendent in the present study, the mean level of IMT was higher in patients with MAU than in patients with NAU in both diabe- tes and hypertension groups, which could be consistent with the result of the previous study (6). Thus, a larger-scale study might show a significant association.
The result of the preferential association between MAU and PWV suggests that functional large artery stiffening may share similar pathophysiological relevance to MAU, as compared with anatomical large artery thickening marked by IMT, especially in newly diagnosed diabetes or hypertension. Although the accu- rate mechanisms were not completely revealed, endothelial dysfunction may be responsible for a common underlying
mechanism. MAU has been considered an early marker of sys- temic microvascular damage and resulted from the vascular endothelial dysfunction (4, 20, 21). Endothelial dysfunction may be one of the mechanisms of increased arterial stiffness on PWV (4, 26). Considering we only included patients with un- treated, newly diagnosed diseases, vascular endothelial dys- function in the early stage of diabetes or hypertension could play a potential role in the genesis of MAU and increased arteri- al stiffness. Vascular endothelial dysfunction could induce the remodeling of arterial wall through structural and functional changes in target vessels, leading to increased arterial stiffness, and also affect the glomerular basement membrane leading to the alteration of glomerular barrier permeability and increased albuminuria (4, 20).
In all phases of the atherosclerotic process, inflammation plays an important role (5). MAU was found to be associated with inflammatory markers such as hsCRP in previous studies (5, 27, 28). One study found a relationship between hsCRP and albuminuria in a newly diagnosed hypertensive group, similar to the subjects in the present study (27). More recently, one mul- tivariate analysis study demonstrated that a one-milligram-per- liter increase in CRP had a significant association with 2% in- creased odds of MAU (28). These facts are in agreement with the result of the present study, demonstrating that MAU was strongly associated with hsCRP in both the diabetic and hyper- tensive groups.
Several limitations of the present study should be noted. First, the follow-up values of the indices after diabetes or hyperten- sion treatments were not present. The present study only focused on the association between MAU and the indices of macrovas- cular complication before medical treatments. A serial measure- ment of MAU in this cohort of patients would be more informa- tive. Additionally, because the present study was a cross-sec- tional study, only the association between MAU and the indices of macrovascular complication was demonstrated without an investigation of cause and effect inferences. To address these is- sues, a long-term, large-scale prospective study is needed. Sec- ondly, we could not explain why the rate of patients with MAU (49.3%) was higher in the present study than in other previous reports. MAU is a frequent finding in patients with diabetes or hypertension and about 20%-30% of people with newly diag- nosed type 2 diabetes show MAU (29). While the exact reasons remain unclear, 47.7% of type 2 diabetic patients showed MAU in the present study. Finally, although medical histories of pa- tients were carefully considered and all the available medical records including those of the annual heath check-up were re- viewed, it is still possible that patients who had diseases longer than 12 months were enrolled into the present study. In gener- al, estimating the precise duration of type 2 diabetes and essen- tial hypertension is difficult. However, we tried to exclude pa- tients whose diseases had an uncertain duration.
In conclusion, MAU is independently associated with arterial stiffness and vascular inflammation but not with IMT in patients with newly diagnosed type 2 diabetes or essential hypertension, which emphasizes the importance of proactive clinical investi- gations for atherosclerotic complications in patients with MAU, even in newly diagnosed diabetes or hypertension.
ACKNOWLEDGMENTS
The authors have no conflicts of interest to disclose.
REFERENCES
1. Rosenson RS, Fioretto P, Dodson PM. Does microvascular disease pre- dict macrovascular events in type 2 diabetes? Atherosclerosis 2011; 218:
13-8.
2. Kim JH, Kim DJ, Jang HC, Choi SH. Epidemiology of micro- and macro- vascular complications of type 2 diabetes in Korea. Diabetes Metab J 2011; 35: 571-7.
3. Mulè G, Cottone S, Vadalà A, Volpe V, Mezzatesta G, Mongiovì R, Piazza G, Nardi E, Andronico G, Cerasola G. Relationship between albumin ex- cretion rate and aortic stiffness in untreated essential hypertensive pa- tients. J Intern Med 2004; 256: 22-9.
4. Kim BJ, Lee HA, Kim NH, Kim MW, Kim BS, Kang JH. The association of albuminuria, arterial stiffness, and blood pressure status in nondiabetic, nonhypertensive individuals. J Hypertens 2011; 29: 2091-8.
5. Mulè G, Cottone S, Cusimano P, Riccobene R, Palermo A, Geraci C, Nardi E, Bellavia T, Foraci AC, Cerasola G. The association of microal- buminuria with aortic stiffness is independent of C-reactive protein in essential hypertension. Am J Hypertens 2009; 22: 1041-7.
6. Ishimura E, Taniwaki H, Tsuchida T, Obatake N, Emoto M, Shoji T, Shi- oi A, Inaba M, Nishizawa Y. Urinary albumin excretion associated with arterial wall stiffness rather than thickness in type 2 diabetic patients. J Nephrol 2007; 20: 204-11.
7. Jia EZ, An FH, Liu P, Li F, Mao HW, Cui WJ, Xu HY. Relationship between brachial-ankle pulse wave velocity and cardiovascular risk factors: a multi-ethnic study. Intern Med 2012; 51: 537-43.
8. Cardoso CR, Marques CE, Leite NC, Salles GF. Factors associated with carotid intima-media thickness and carotid plaques in type 2 diabetic patients. J Hypertens 2012; 30: 940-7.
9. Karalliedde J, Viberti G. Microalbuminuria and cardiovascular risk. Am J Hypertens 2004; 17: 986-93.
10. Chae HW, Shin JI, Kwon AR, Kim HS, Kim DH. Spot urine albumin to creatinine ratio and serum cystatin C are effective for detection of dia- betic nephropathy in childhood diabetic patients. J Korean Med Sci 2012;
27: 784-7.
11. Ishikawa T, Hashimoto J, Morito RH, Hanazawa T, Aikawa T, Hara A, Shintani Y, Metoki H, Inoue R, Asayama K, et al. Association of microal- buminuria with brachial-ankle pulse wave velocity: the Ohasama study.
Am J Hypertens 2008; 21: 413-8.
12. Huang Y, Chen Y, Xu M, Gu W, Bi Y, Li X, Ning G. Low-grade albumin- uria is associated with carotid intima-media thickness in Chinese type 2 diabetic patients. J Clin Endocrinol Metab 2010; 95: 5122-8.
13. Keech AC, Grieve SM, Patel A, Griffiths K, Skilton M, Watts GF, Marwick
TH, Groshens M, Celermajer DS. Urinary albumin levels in the normal range determine arterial wall thickness in adults with type 2 diabetes: a FIELD substudy. Diabet Med 2005; 22: 1558-65.
14. Choi SW, Yun WJ, Kim HY, Lee YH, Kweon SS, Rhee JA, Choi JS, Shin MH. Association between albuminuria, carotid atherosclerosis, arterial stiffness, and peripheral arterial disease in Korean type 2 diabetic pa- tients. Kidney Blood Press Res 2010; 33: 111-8.
15. Gavin JR, Alberti KGMM, Davidson MB, DeFronzo RA, Drash A, Gabbe SG, Genuth S, Harris MI, Kahn R, Keen H, et al. Report of the expert com- mittee on the diagnosis and classification of diabetes mellitus. Diabetes Care 1997; 20: 1183-97.
16. Chobanian AV, Bakris GL, Black HR, Cushman WC, Green LA, Izzo JL Jr, Jones DW, Materson BJ, Oparil S, Wright JT Jr, et al. The seventh re- port of the joint national committee on prevention, detection, evalua- tion, and treatment of high blood pressure: the JNC 7 report. JAMA 2003;
289: 2560-72.
17. An HR, Park S, Yoo TH, Kang SW, Ryu JH, Lee YK, Yu M, Ryu DR, Kim SJ, Kang DH, et al. Non-dipper status and left ventricular hypertrophy as predictors of incident chronic kidney disease. J Korean Med Sci 2011; 26:
1185-90.
18. Cockcroft DW, Gault MH. Prediction of creatinine clearance from serum creatinine. Nephron 1976; 16: 31-41.
19. Ahn MS, Kim JY, Youn YJ, Kim SY, Koh SB, Lee K, Yoo BS, Lee SH, Yoon J, Park JK, et al. Cardiovascular parameters correlated with metabolic syn- drome in a rural community cohort of Korea: the ARIRANG Study. J Ko- rean Med Sci 2010; 25: 1045-52.
20. Abdelhafiz AH, Ahmed S, El Nahas M. Microalbuminuria: marker or maker of cardiovascular disease. Nephron Exp Nephrol 2011; 119: e6-10.
21. Culleton BF, Larson MG, Wilson PW, Evans JC, Parfrey PS, Levy D. Car- diovascular disease and mortality in a community-based cohort with mild renal insufficiency. Kidney Int 1999; 56: 2214-9.
22. Yokoyama H, Sone H, Saito K, Yamada D, Honjo J, Haneda M. Flow- mediated dilation is associated with microalbuminuria independent of cardiovascular risk factors in type 2 diabetes: interrelations with arterial thickness and stiffness. J Atheroscler Thromb 2011; 18: 744-52.
23. Kim ES, Moon SD, Kim HS, Lim DJ, Cho JH, Kwon HS, Ahn CW, Yoon KH, Kang MI, Cha BY, et al. Diabetic peripheral neuropathy is associat- ed with increased arterial stiffness without changes in carotid intima- media thickness in type 2 diabetes. Diabetes Care 2011; 34: 1403-5.
24. Cheung N, Wang JJ, Rogers SL, Brancati F, Klein R, Sharrett AR, Wong TY; ARIC (Atherosclerosis Risk In Communities) Study Investigators.
Diabetic retinopathy and risk of heart failure. J Am Coll Cardiol 2008;
51: 1573-8.
25. Zizek B, Poredos P. Dependence of morphological changes of the carotid arteries on essential hypertension and accompanying risk factors. Int Angiol 2002; 21: 70-7.
26. Tomiyama H, Yamashina A. Non-invasive vascular function tests: their pathophysiological background and clinical application. Circ J 2010; 74:
24-33.
27. Tsioufis C, Dimitriadis K, Taxiarchou E, Vasiliadou C, Chartzoulakis G, Tousoulis D, Manolis A, Stefanadis C, Kallikazaros I. Diverse associa- tions of microalbuminuria with C-reactive protein, interleukin-18, and soluble CD 40 ligand in male essential hypertensive subjects. Am J Hyper- tens 2006; 19: 462-6.
28. Kshirsagar AV, Bomback AS, Bang H, Gerber LM, Vupputuri S, Shoham
DA, Mazumdar M, Ballantyne CM, Paparello JJ, Klemmer PJ. Associa- tion of C-reactive protein and microalbuminuria (from the National Health and Nutrition Examination Survey, 1999 to 2004). Am J Cardiol 2008; 101: 401-6.
29. Ruilope L, Izzo J, Haller H, Waeber B, Oparil S, Weber M, Bakris G, Sow- ers J. Prevention of microalbuminuria in patients with type 2 diabetes:
what do we know? J Clin Hypertens (Greenwich) 2010; 12: 422-30.