Impact Localization for a Composite Plate Using the Spatial Focusing Properties of Advanced Signal Processing Techniques
Hyunjo Jeong*✝ and Sungjong Cho*
Abstract A structural health monitoring technique for locating impact position in a composite plate is presented in this paper. The method employs a single sensor and spatial focusing properties of time reversal(TR) and inverse filtering(IF). We first examine the spatial focusing efficiency of both approaches at the impact position and its surroundings through impact experiments. The imaging results of impact localization show that the impact location can be accurately estimated in any position of the plate. Compared to existing techniques for locating impact or acoustic emission source, the proposed method has the benefits of using a single sensor and not requiring knowledge of anisotropic material properties and geometry of structures. Furthermore, it does not depend on a particular mode of dispersive Lamb waves that is frequently used in other ultrasonic testing of plate-like structures.
Keywords: Time Reversal, Lamb Wave, Impact Location, Spatial Focusing, Localization Imaging
[Received: November 10, 2012, Revised: December 3, 2012, Accepted: December 5, 2012] *Division of Mechanical and Automobile Engineering, and Research Institute of Engineering Technology Development, Wonkwang University, Iksan, 570-749 Korea ✝Corresponding Author: [email protected]
ⓒ 2012, Korean Society for Nondestructive Testing
1. Introduction
Advanced composite materials are frequently employed as primary load baring components in civil and aerospace structures. With regard to structural integrity of these structures, one of the major issues has been the detection and characterization of defects or damages that might occur during fabrication or in service. Impact damage, for instance, can be induced by a variety of reasons, and is known to weaken the structure by generating different types of flaws such as microcracks and delaminations. Over time, these defects grow and may lead to a catastrophic failure of structure. Thus, reliable detection of impact event is of high interest to civil and aerospace industries. Quantitative information on impact event and their location is helpful for effective nondestructive inspection of impact damage. A large volume of literature is available on impact localization based on wave fields generated by an impact event.
The conventional technique for impact
location is based on the time of arrival (TOA) at a number of transducers, using the known distances between the transducers and the propagation velocity [1]. When the propagating wave is dispersive, advanced signal processing techniques were used to obtain the arrival time of a group velocity at a specific frequency.
Optimization algorithms were sometimes employed to determine the impact coordinates in anisotropic materials. In addition to the dispersive and angular dependent group velocity, multiple scattering, boundary reflections and mode conversion in geometrically complex composite structures can alter the resulting signal, leading to a wrong estimation of the TOA. An alternative approach is to employ the time reversal (TR) focusing technique that does not require a prior knowledge of the wave velocity or the structural geometry.
One of the fundamental features of TR
principle is that the elastic waves generated
from a point source can be focused back to the
original source if the output measured by a set
of transducers is time reversed and re-emitted at the same time. Array transducers (called time reversal mirror (TRM)) sometimes limit the TR focusing quality because of finite bandwidth and aperture. However, it was demonstrated that the focusing quality of TR process can be improved by a closed cavity sample reverberating a long time [2,3]. The result of such operation creates a virtual enlargement of the transducers angular aperture and the number of sensors of TRM can be drastically reduced, even to one in the limit case. The idea of using TR as an impact localization method was first developed by Ing et al. [4] for the detection of a finger knock on a glass plate. Then, this concept was extended to the localization of the impact in a stiffened composite panel and an airplane fuselage [5,6].
Loss of information due to either limited bandwidth or dissipation (nonlinear attenuation) also break the time reversal invariance [7].
However, Tanter et al. [8] showed that the inverse filtering (IF) approach allows recovering the optimal focusing, even in dissipative media.
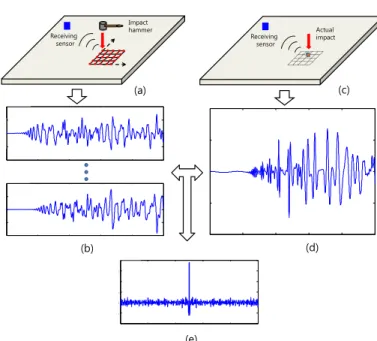
This paper deals with impact localization in a composite plate using a single transducer, and TR and IF approaches. A typical TR- or IF-based impact localization can be realized in two steps (Fig. 1). The first step is composed of the following experiments: (1) divides the region of interest into M×N excitation points distributed along a regular grid interval. (2) Applies mechanical impact at each grid point and collects the corresponding impulse response function at a receiving sensor. The impact can be generated by an impact hammer. (3) A new, actual impact is applied in one of the points (of unknown location) of the region and its impulse response is similarly measured by the sensor. In the second step, a virtual focusing and imaging is accomplished using the stored data in the first step. (4) The actual impact signal is time reversed or inverse filtered, and then multiplied with impulse response functions to calculate the
focused wave field at each grid point.
(5) Finally impact localization image is obtained using the maximum amplitude of the back propagated wave field and identifies the actual impact point.
In this paper, we consider the impact localization of a composite plate using TR and inverse filtering focusing techniques with a single receiving transducer. Analytical expres- sions are first derived to describe the wave field between the impact source and the receiver, and then from the receiver to the initial impact source. Impact tests are carried out, and the spatial distribution of the TR focused signal amplitude is presented to compare the focusing quality in terms of the spatial resolution and contrast (signal-to-noise ratio). Impact localiza- tion images (location and imaging) are con- structed by relating the contrast at a particular pixel to the amplitude of the focused signal.
Impact localization results are compared for the performance of two focusing techniques in terms of the ability to detect and image actual impacts.
2. Impact Localization Techniques
Fig. 1 shows the concept of impact localization in a composite plate using the spatial focusing of time reversal (TR) or inverse filtering (IF) approach. In the first step, the impulse response functions (IRFs) are obtained by hitting every grid point within the target area of the composite plate. The IRFs are received by an ultrasonic transducer placed at a fixed position on the plate and stored in a database.
The second step includes an actual impact event
at one of the grid points, and the impact
response is recorded by the same receiving
transducer. In the third step, the actual impact
signal is time reversed or inverse filtered and
then multiplied with the impulse response
functions. The grid point with the maximum
Receiving sensor
Impact hammer
Receiving sensor
Actual impact
0 0.2 0.4 0.6 0.8 1
x 10-3 -0.5
0 0.5
x 10-10
0 0.2 0.4 0.6 0.8 1
x 10-3 -0.5
0 0.5
x 10-10
0 0.2 0.4 0.6 0.8 1
x 10-3 -0.5
0 0.5
x 10-10
0 1 2 3 4 5
x 10-3 -1
-0.5 0 0.5 1 1.5
2x 10-24
(a) (c)
(b) (d)
(e)
Fig. 1 Concept of impact localization in a composite plate using the spatial focusing of time reversal(TR) or inverse filtering(IF): (a) and (b) Impulse response functions of grid points are obtained by an impact hammer and an ultrasonic receiver, (c) and (d) Actual impact is applied at a grid point and recorded by the same receiving sensor, and (e) The actual impact signal is time reversed or inverse filtered and then multiplied with the impulse response functions.
The grid point with the maximum amplitude is identified as the possible impact location
amplitude is identified as the possible impact location. Impact localization results can be visualized through a 2D imaging of processed data.
In this work, two approaches were used for impact localization through the optimal focusing of the back-propagated actual impact signal at the source location. The first approach is based on the regular time reversal focusing technique.
Denoting
as input signal at mth grid point, the output signal measured by the transducer from this excitation is defined as
( ) ( ) ( )
∞( ) ( τ τ τ )
= ⊗ = ∫−∞ −
m m m m m
f t h t e t h e t d (1) where the symbol
⊗means a temporal convolution and
is the impulse response function. In the frequency domain, Eq. (1) is expressed as
( ) ω = ( ) ω ( ) ω
m m m
F H E (2)
Assuming that the spatial reciprocity condition holds, the propagation between the transducer and the mth excitation point is
( ) ω =
T( ) ω ( ) ω
m m m
E H F (3)
The wave field received by the transducer due to the actual impact event at point m=m0 is
0
( ) ω =
0( ) ω
0( ) ω
m m m
F H E (4)
The time reversal operation of a signal in the time domain is equivalent to taking the complex conjugate of the Fourier transform of the signal in the frequency domain. Therefore, the time reversal of the transducer output, Eq. (4), is
* * * *
0
( ) ω =
0( ) ω
0( ) ω =
0( ) ω
0( ) ω
m m m m m
F H E H E (5)
where the superscript * denotes a complex
conjugate. Combining Eqs. (3) and (5), the
back-propagated signal at the mth point is
Fig. 2 Definition of impulse response functions:
is between the mth excitation point and the sensor, is between the sensor and the mth excitation point, and
is between the m0 actual impact point and the sensor
620 x y
30 200
310
620
Receiving Sensor Impulse measurement grid position
dx=dy=10 mm
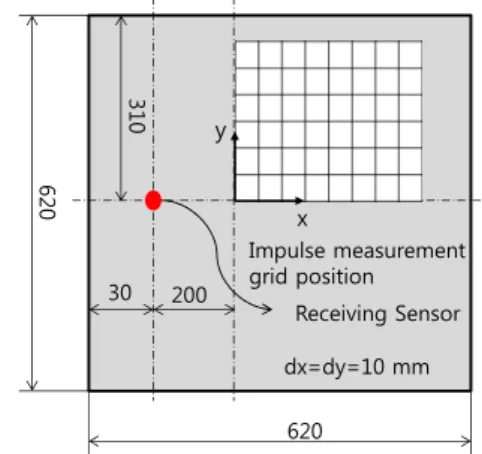
Fig. 3 Sensor location and grid point coordinates for impact localization experiment
* *
0 0 0
( ) ω =
T( ) ω ( ) ω =
T( ) ω ( ) ω ( ) ω
TR m m m m m
E H F H H E (6)
Eq. (6) has a maximum at the impact point, i.e., when m=m
0.
The inverse filtering (IF) focusing approach is based on the inversion of the transfer function
. Compared to the TR experiment, the inverse filtering technique is able to increase the contrast, i.e., the ratio of the refocused signal at the time t=0 and the recompressed signal at all other times [5]. From Eqs. (3) and (4), the wave field received by the transducer due to the actual impact event at point m=m
0is obtained by multiplying
on both sides of Eq. (3)
* *
0 0 0 0 0
2
0 0
( ) ( ) ( ) ( ) ( )
( ) ( )
ω ω ω ω ω
ω ω
=
=
T
m m m m m
m m
H E H H F
H F (7)
and
0
( ) ω = %
0( ) ω
0( ) ω
m m m
F H E (8)
where
* 0
0 2
0
( ) ( )
( ) ω ω
= ω
%m m
m
H H
H
is the inversion of transfer function,
. The back-propagated signal at the mth grid point is
0 0 0
( ) ω =
T( ) ω ( ) ω =
T( ) ω % ( ) ω ( ) ω
IF m m m m m
E H F H H E (9)
Eq. (9) also has a maximum at the impact point, i.e., when m=m
0. Fig. 2 shows the definition of various impulse response functions used in the expressions above.
3. Impact Localization Experiment
A unidirectional composite laminate was used in this study. The composite specimen was made of 24 plies of graphite/epoxy prepreg tape.
The nominal thickness of the laminate was 3.0 mm. The dimension was 620 mm×620 mm.
To implement the proposed impact localization techniques, impact experiments were carried out
(Fig. 1). The impacts were applied to 63 grid points spaced 10 mm apart using an impact hammer, manufactured by PCB piezoelectronics.
The experimental impulse response function from each grid point was acquired using an ultrasonic transducer instrumented with a preamplifier and an oscilloscope with a sampling rate of 10 MHz. The ultrasonic transducer used has a center frequency of 500 kHz. A 10 ms duration time window was chosen. The time histories of the signal received by the transducer were stored on a computer and processed using a MATLAB software. Sensor location and impact source coordinates are shown in Fig. 3.
The ultrasonic transducer response due to the
hammer excitation is shown in Fig. 4 when the
Fig. 4 Response signal and Fourier spectrum due to the hammer excitation at (x=40, y=30) mm
(a) (b)
Fig. 5 Comparison of normalized focusing behavior when the actual impact point is (40, 30): (a) along the x axis, and (b) along the y axis
(a) (b)
Fig. 6 Comparison of normalized focusing behavior when the actual impact point is (60, 40): (a) along the x axis, and (b) along the y axis
actual impact is located at (x=40, y=30) mm.
The long reverberation is present in the signal during the 10 ms duration time window.
4. Results and Discussion
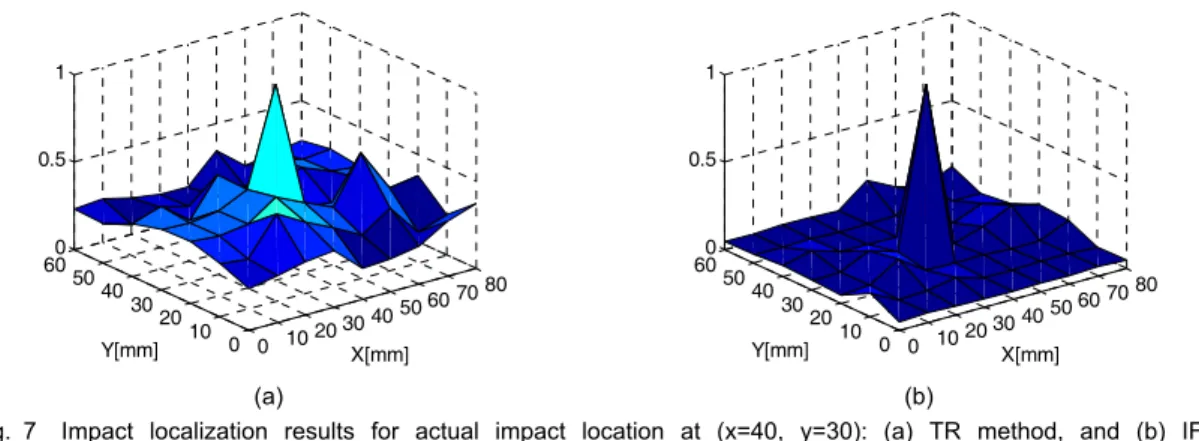
The spatial focusing property of back- propagated signal after TR or IF signal processing is important in many aspects of
impact localization. Experimental results on spatial distribution of the TR and IF focused signal amplitudes are presented in Figs. 5 and 6.
Fig. 5 shows the focusing behavior along the x
and y axes when the actual impact is located at
(x=40, y=30) mm, while Fig. 6 shows the
focusing behavior for the actual impact at
(x=60, y=40) mm. Amplitudes are calculated
peak amplitudes of the TR and IF signal at
0 1020 3040 5060 7080 10 0
3020 5040 600 0.5 1
X[mm]
Y[mm] 0 1020 3040 5060 7080
10 0 3020 5040 600 0.5 1
X[mm]
Y[mm]
(a) (b)
Fig. 7 Impact localization results for actual impact location at (x=40, y=30): (a) TR method, and (b) IF method
0 1020 3040 5060 7080 10 0
3020 5040 600 0.5 1
X[mm]
Y[mm] 0 1020 3040 5060 7080
10 0 3020 5040 600 0.5 1
X[mm]
Y[mm]
(a) (b)
Fig. 8 Impact localization results for actual impact location at (x=60, y=40): (a) TR method, and (b) IF method