Guided-Wave Tomographic Imaging of Plate Defects by Laser-Based Ultrasonic Techniques
Junpil Park*, Juyoung Lim* and Younho Cho**
✝Abstract Contact-guided-wave tests are impractical for investigating specimens with limited accessibility and rough surfaces or complex geometric features. A non-contact setup with a laser-ultrasonic transmitter and receiver is quite attractive for guided-wave inspection. In the present work, we developed a non-contact guided-wave tomography technique using the laser-ultrasonic technique in a plate. A method for Lamb-wave generation and detection in an aluminum plate with a pulsed laser-ultrasonic transmitter and Michelson-interferometer receiver was developed. The defect shape and area in the images obtained using laser scanning, showed good agreement with the actual defect.
The proposed approach can be used as a non-contact online inspection and monitoring technique.
Keywords: Guided Wave, Non-Contact Guided Wave, Tomography, Laser Ultrasonics
[Received: November 10, 2014, Revised: December 18, 2014, Accepted: December 24, 2014] *Graduuate School, School of Mechanical Engineering, Pusan National University, 10511, San30, Jangjeon-dong, Geumjeong-gu, Busan 609-735, Korea **School of Mechanical Engineering, Pusan National University, 10525, San30, Jangjeon-dong, Geumjeong-gu, Busan 609-735, Korea ✝ Corresponding Author: [email protected]
ⓒ 2014, Korean Society for Nondestructive Testing
1. Introduction
Ultrasonic guided wave technique has received a great deal of attention as an important tool for nondestructive testing (NDT). This is mainly attributed to the capacity of the waves to travel long distances without substantial attenuation.
This advantage of the guided wave approach provides the possibility to inspect inaccessible or hidden areas [1,2]. The waves can propagate over considerable distances without point-by- point scanning, and the wave propagation inter- acts throughout the entire thickness of the structure, which means that it not only find surface defects, but also internal defects [3-5].
Another remarkable progress in guided wave NDT is its imaging potential in hidden or inaccessible damage zones. One of the most effective ways to quantitatively monitor a structure is to obtain an image either via scanning or tomography. There have been many different tomographic schemes, and some of the
most well-known methods are the time-of-arrival imaging method, the time difference of arrival imaging method, the energy arrival method, and the reconstruction algorithm for the probabilistic inspection of damage (RAPID) method [6,7].
RAPID is apt for efficient implementation with ultrasonic guided wave features. A major advan- tage of the RAPID algorithm is the simplicity of the data interpretation, in that the wave diffraction is accounted for only on the line of the propagation path with the linear interpolation of the defect location probability distribution based on the distance from the on-line wave propagation path.
Tomographic imaging of plate structures
using Lamb waves is often desired when the
test area is not directly accessible and must be
probed from outside the area. However, most of
the related works were done with contact-based
techniques such as immersion transducers and
conventional piezoelectric sensors [8]. These
techniques need constant coupling conditions,
which are essential for reliability with these techniques. In addition, when the surface of the object is rough or geometrically complicated, the contact-based technique becomes impractical due to limited accessibility. Consequently, the coupling condition can significantly affect the quality of the data in the image reconstruction, leading to poor spatial resolution. Another limitation with contact-based techniques is encountered in harsh inspection environments with high temperature. Online monitoring for moving objects is another challenging task with contact-based techniques. As such, a robust non- contact-based tomography technique has been in high demand.
Laser ultrasonic testing(LUT) is a remote, non-contact ultrasonic testing(UT) method. It uses laser sources to generate and detect high- frequency ultrasound. LUT is fast and effective on rough surfaces. It is ideally suited for many applications that are beyond the capabilities of conventional ultrasonic testing. High-resolution inspection of small parts and fast areal scans of large components or structures are the key advantages of LUT. Laser ultrasonic tomo- graphic systems using the amplitudes of ultrasound for tomographic reconstruction need to take into account the high degree of variability in the generated ultrasound arising from variation in the thermal absorption at different locations on the plate.
The aim of the present work is to develop a non-contact guided-wave tomography technique by a laser ultrasonic method in a plate. A method for Lamb wave generation and detection in an aluminum plate with a pulse laser ultrasonic transmitter and a Michelson inter- ferometer receiver has been developed. An image of a defect shape and area was obtained by laser scanning, and showed good agreement with the actual defect. The proposed approach can be used as a non-contact-based online inspection and monitoring scheme.
2. Tomography Algorithm
The probabilistic approach known as the Reconstruction Algorithm for Probabilistic Inspection of Damage consists of signal com- parison and image reconstruction. The signal comparison part is based on a damage index known as the signal difference coefficient (SDC), which is a measure of how statistically different the current signal is from a reference or baseline signal. Damage indexes for all transducer pairs are spatially distributed and summed to generate an image of the damaged area [6].
The first step of this algorithm is the computation of the signal difference coefficient between the signal
and the baseline
, which is the drop in the correlation coefficient over a specified time window. The index i denotes the transmitter, and j is the receiver.
Mathematically, the SDC is represented as follows:
0
0
0 0
0 0
2 2
( ) ( )
1
( ) ( )
t T
ij ij
t
ij t T t T
ij ij
t t
x t y t dt
SDC
x t dt y t dt
μ μ
μ μ
+Δ
+Δ +Δ
⎡ − ⎤ ⎡ − ⎤
⎣ ⎦ ⎣ ⎦
= −
⎡ − ⎤ ⎡ − ⎤
⎣ ⎦ ⎣ ⎦
∫
∫ ∫
(1)
The time
is the direct arrival time for each transducer pair, is the mean of the corresponding signal, and ∆ is a time window.
If the signals are identical, the SDC is zero, and if the signals are completely out of phase, the SDC will achieve its maximum value of 1.
After the SDC value for all sensor pairs are
calculated, the RAPID algorithm carries out the
image reconstruction. Images are generated by
spatially distributing each SDC value on the
image plane in an elliptical pattern, where the
two foci of the ellipse are the two transducer
locations. A parameter controls the size of the
ellipse, and its amplitude tapers from its
maximum value along the line connecting the
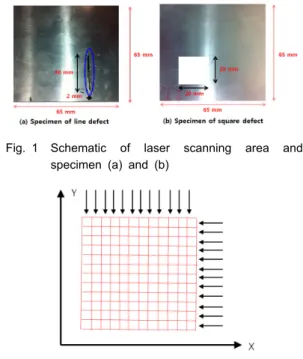
Fig. 1 Schematic of laser scanning area and specimen (a) and (b)
Fig. 2 Schematic of laser scanning direction
ellipse foci to zero on the periphery of the ellipse. The parameter is the shape factor that controls the size of the elliptical distribution and is greater than 1.0. The spatial distribution function in which SDC values will distribute in the final step of the algorithm is defined as:
( , )
( , ) ( , )
1
( , ) 0, .
ij
ij ij
ij
R x y
S x y for R x y
S x y otherwise
γ γ
γ
= − >
−
=
(2)
is the ratio of the sum of distances of the point (x,y) to the transmitter i and receiver j to the distance between the transmitter and receiver, and it is mathematically stated as:
2 2 2 2
2 2
( ) ( ) ( ) ( )
( , )
( ) ( )
i i j j
ij
i j i j
x x y y x x y y R x y
x x y y
− + − + − + −
= − + − (3)
However, if the approximate distance of the defect zone on the transmitter-receiver pair is known, can be calculated using equation (3).
If all of the distances of the defect range are the same on all of the transmitter-receiver pairs, the parameter is a uniform number. However, the distances of the defect range are not equal to those of the transmitter-receiver pairs, so the value of will vary. The shape factor is related to the transmitter-receiver pairs, so equation (2) has to be changed as follows:
( , )
( , ) ( , )
1
( , ) 0, .
N ij
ij N ij
N ij
R x y
S x y for R x y
S x y otherwise
γ γ
γ
= − >
−
=
(4)
N is the total number of transmitter-receiver pairs. Finally, the image amplitude at each pixel is the linear summation of the location probabilities from each transmitter-receiver pair
with the total number of transmitter- receiver pairs given by N:
1
1 1
( , )
N N ij ij( , )
i j i
P x y
−S D C S x y
= = +
= ∑ ∑ (5)
3. Information of Specimen and Experimental Set-Up
3.1 Samples
The specimens under investigation are aluminum plates. The thickness of the specimen is 1.0 mm, and its area is 150 mm × 300 mm.
There are two specimens with different shape of cracks in this study, as shown in Fig. 1, where the laser scanning area is also illustrated. To make sure that the laser-generated signal propa- gates through the whole area of 65 mm × 65 mm, wave signals were generated from two sides of the specimen. Fig. 2 shows the sensor network. Scanning length is 8 mm along X and Y axis.
3.2 Calibration of Laser Experimental Set-Up
A wavelength of 1064 nm from a fiberized
Nd:YAG pulse laser system was used to
generate guided waves, while the pulse laser
system emits pulses of energy. On the laser
(a) (b)
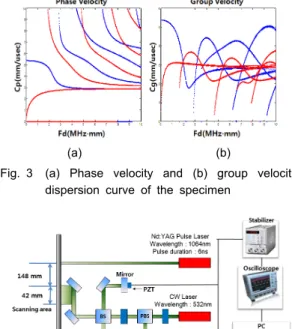
Fig. 3 (a) Phase velocity and (b) group velocity dispersion curve of the specimen
Fig. 4 Experimental setup of laser-based guided-wave technique
side, the slit array is utilized to achieve the linearly arrayed light illumination that acts as the line array source of ultrasonic Lamb waves on the surface of the target. This arrayed-line source type, also referred as the wavelength matching method, is intended to generate a single wavelength of Lamb waves with a narrow bandwidth. The beam of the laser illuminates an arrayed line slit, and the transmitted beam acts as a line source on the plates. The spacing of the array coincides with the wavelength of the specific Lamb wave that will be generated.
Therefore, the specific mode of the Lamb wave generated can be selected by simply changing the slit spacing. Selection of the desired mode is performed by drawing a straight line that represents the wavelength on the typical disper- sion curves for the phase velocity
, which contains a number of guided wave modes. The relation between the wavelength, frequency , phase velocity
, waveguide thickness , and slit spacing array ∆ is stated as:
p