147 [Note]
마산만 식물플랑크톤의 대발생 양상의 변화와 군집 동태
이주연·한명수*
한양대학교 생명과학과
Change of Blooming Pattern and Population Dynamics of Phytoplankton in Masan Bay, Korea
JUYUN LEE AND MYUNG-SOO HAN*
Department of Life Science, College of Natural Sciences, Hanyang University,Seoul 133-719, Korea
본연구는마산만의적조원인식물플랑크톤의 천이와대발생변화양상을밝히고자 이지역을대표할수있는
1개정정에서 2003년 11월부터 2004년 10월까지강우와연평균기온차를포함한기후학적요인, 물리·화학적요인
그리고식물플랑크톤 군집을조사하였다. 영양염은타해역과비교하였을 때, 암모니아염은높은농도를보였으나,
질산염은비슷한농도를보였다. 그리고규산염은타해역에비해낮은농도를보였으며, 인산염은빈영양수역에
포함될 정도로낮은농도를 보여식물플랑크톤성장의 제한요소로 작용하였다. 식물플랑크톤현존량의 탄소량은
2003년동계와 2004년하계에, 엽록소-a는 2003년늦은추계부터동계까지그리고 2004년하계에높게나타나비
슷한경향을보였으며, 개체수는 2003년동계와 2004년추계에높았다. 조사기간동안출현한식물플랑크톤은 총
78종으로 동정되었으며, 이 중우점종은 규조류 Skeletonema costatum, Cylindrotheca closterium, 와편모조류 Heterocapsa triquetra, Prorocentrum minimum, P. triestinum, 침편모조류 Heterosigma akashiwo로나타났다. 우점 종의계절적변화양상을살펴보면 P. minimum은늦은추계부터동계까지, H. triquetra는늦은동계에우점하였다. P. triestinum은늦은춘계부터 이른하계까지, H. akashiwo는춘계부터 조금높은경향을 보이다가늦은하계에
C. closterium이그리고 S. costatum은추계에가장우점하였다. CCA 분석결과, 개체수로표현되는현존량은규조
류와관계가있으며, 환경요인중에서수온, 질산염과인산염의영향을받는것으로나타났다. 탄소량과엽록소-a로 표현되는현존량은규조류뿐만아니라와편모조류와침편모조류와관계가있으며, 염분, 규산염과인산염의영향을
받는것으로나타났다. 조사기간을포함한최근 6년동안의기온의상승에따른수온의상승은동계적조를발생시 키는원인이되었다. 또한, 동계적조에따른영양염고갈과춘계의강우량감소에따른영양염공급의제한은마산
만에서상습적으로발생되는춘계적조의발생을억제하였을것으로판단된다. 결과적으로 2004년도의전형적인대 발생양상의변화는수온의상승과강우량의감소가중요한영향을미쳤을것으로추정된다.
To clarify the bloom pattern and species succession in phytoplankton community, the population dynamics with the determination of physico-chemical factors have been studies in Masan Bay, the south sea of Korea, for the periods November 2003-October 2004. Concentration of NH4-N was always higher than that of NO3- N, which was similar level as compared to other costal areas. PO4-P concentration was lower than those in other coastal areas but similar to oligotrophic environments. Thus, phosphate seems the limiting nutrient rather than nitrogen. SiO2-Si concentration was also low as compared to other costal areas. Si:P ratio was low from autumn to winter, suggesting silicate and/or phosphate limitation during this period. The cell density of phytoplankton was high in winter 2003 and early autumn 2004. The carbon biomass was high in winter 2003 and summer 2004. And chlorophyll-a concentration was high in late autumn 2003 and summer 2004. Among 78 species of phytoplankton found in the bay during the investigated period, dominant species were two diatoms of Cylin- drotheca closterium, Skeletonema costatum, and threedinoflagellates of Heterocapsa triquetra, Prorocentrum minimum, P. triestinum, and one raphidophyte of Heterosigma akashiwo. P. minimum dominated from late autumn to winter, but it was replaced by H. triquetra in late winter. P. triestinum dominated from late spring to early summer. Simultaneously, H. akashiwo cell density steadily increased, and it became dominant with C.
closterium in late summer. With decreasing of H. akashiwo and C. closterium, S. costatum became the most dominant species in autumn. The canonical analyses showed that total phytoplankton cell density related to dia- tom cell density and it was affected by temperature, and concentrations of NO3-N and PO4-P. The carbon bio-
*Corresponding author: [email protected]
mass and chlorophyll-a concentration related to diatom- and dinoflagellate cell densities and these were affected by flagellate cell density, salinity, and concentrations of SiO2-Si and PO4-P. Last six years monitoring data in Masan city obtained from Korean Meteorological Agency indicates gradual increase in air temperature. And the precipitation decreased especially in spring season. The winter bloom found in 2003 may be caused by the increase in the temperature and this bloom subsequently induced the nutrients depletion, which continued until next spring probably due to no precipitation. Therefore, the spring bloom, which had been usually observed in the bay, might disappear in 2004.
Key words: Blooming Pattern, Community Structure, Masan Bay, Phytoplankton, Population Dynamics
서 론
마산만은남해안의전형적인리아스식해안으로해수교환이원
활하지않은반폐쇄성만이다. 이지역은 1970년국가수출자유
지역으로지정된이래, 1974년창원기계공업단지가조성되었고
이에따른대규모항만도시의형성으로급격한인구의증가가이 루어졌다. 그결과급속한부영양화의진행으로수질오염이심화
되어 1975년에가포해수욕장이폐쇄되었고, 1979년에마산만인
근연안의어패류채취가금지되었다. 이런변화로인해서마산만 은수질오염에따른생태계교란과변화에대한연구가집중적으 로수행되어왔다(곽등, 2001; 최등, 2000; Lee and Yoo, 1990;
Han et al., 1994). 특히식물플랑크톤은환경의변화에매우민감
하게반응하기때문에더욱중요한연구의대상으로다루어졌다
(Goffart et al.,1995; Goffart and Hecq, 1993, Sournia et al.,
1990). 식물플랑크톤에대한연구는 1970년대후반부터식물플랑
크톤의분포및분류학적연구(조, 1978; 한과유, 1983a; 한과유, 1983b; Yoo and Lee, 1986)를시작으로, 부영양화된연안역의환 경변화에따른식물플랑크톤의종조성과군집동태및적조에대 한연구가집중되어 왔다(박과김, 1967; 임등, 1973; Lee and Yoo, 1990; Han et al., 1991; Han et al., 1994). 특히 1990년대
후반부터 cyst 발아와적조발생과의관계(박등, 2004; 이, 1997;
한등, 2003)를비롯하여적조플랑크톤의동태(곽등, 2001; 최등,
2000) 등에대한연구는중요한연구과제로다루어져왔다.
적조원인식물플랑크톤은 1970년대에는Skeletonema costatum
과Chaetoceros sp.와같은규조류가우점하였으나(Yoo and Lee,
1980) 1980년대이후뚜렷한천이가발생되어규조류대신편모
조류와와편모조류가우점하기시작하였다(곽등, 2001). 1981년
와편모조류 Karenia mikimotoi가적조를발생시켰으며, 침편모조
류 Heterosigma akashiwo와와편모조류 Prorocentrum minimum
은 1983년에 1,000 cells ml-1이상높은밀도의적조를일으켰다
(김, 1989; 김, 2003). 국립수산과학원(2003)에의하면, 최근 약
10년동안Heterocapsa, Heterosigma, Prorocentrum 속이적조의 주요원인종으로보고되었다.
또한, 적조발생의주요우점종의천이뿐만아니라, 현존량의계
절적분포양상도크게변화하고있다. 즉, 마산만과같은부영양
화된온대해역에서의식물플랑크톤대발생은춘계와추계에발생 하는 전형적인쌍봉형 양상을 보이지만(윤등, 1992; 윤, 1999;
Nybakken, 1993), 최근전지구적인기후변화, 인간활동에의한 오염과부영양화로인해적조의발생기간이장기화되는현상이관 찰되었다(국립수산과학원, 1994; 1998; 곽등, 2001). 이와같이
적조원인종의천이와발생패턴의변화에대한연구는범세계적 인기후변화와의관계에초점을 두고많은연구(Bethoux et al., 1990; Bethoux et al., 1998; Goffart et al., 2002)가이루어지고있
으나마산만에서는이에대한연구가미흡한실정이다.
따라서본연구에서는강우와연평균기온차를포함한기후학 적요인과물리화학적요인그리고식물플랑크톤을조사하여마 산만의적조원인식물플랑크톤의천이와식물플랑크톤군집의쌍 봉형대발생양상의변화와그원인을밝히고자한다.
재료 및 방법
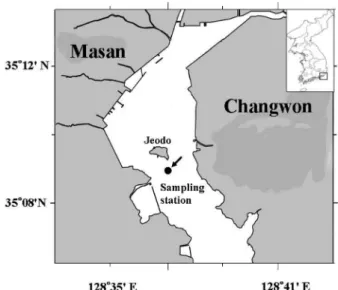
조사해역은마산만의 1개정점(128°35'10"E, 35°10'10"N)을선
정하였다(Fig. 1). 수심은 11~12 m로비교적얕으며, 만내에위 치한섬으로인해해류의영향을비교적적게받는반폐쇄적인해 역이다. 조사기간은 2003년 11월부터 2004년 10월까지매월실 시하였으며, 적조발생양상및식물플랑크톤의천이현상을규명 하고자 2004년 6월에서 8월까지약 10일간격으로집중조사를하 였으며, 이외의기간에는월 1회의채집을수행하였다. 식물플랑
크톤분석을위한시료는 2.5 L van Dorn 채수기로표층에서부터
저층까지 2 m 간격(0, 2, 4, 6, 8, 10, 12 m)으로채수하였으며, 수
온, 염분및용존산소량은 TS-meter (HORIBA, Model U10)로현
장에서측정하였다. TS-meter로측정된용존산소량은현장에서채 수하여 Parsons et al. (1984)의방법으로고정한시료의분석값을
Fig. 1. Map of the sampling station in the Masan Bay, Korea.
이용하여 보정하였다. 측정한용존산소는아래의 식을이용하여
산소포화도로환산하였다.
용존산소포화율 (%) = DO1/DO2× 100 DO1: 현장에서의산소량 (mg l-1)
DO2: 14.161-0.3943t+0.007714t2-0.0000646t3-sX10-15(8.41-0.256t+
0.00374t2) (mg l-1) t: 수온(oC)
s: 염분농도(mg l-1)
암모니아성질소(NH4-N), 질산성질소(NO3-N), 인산성인(PO4- P), 규산성규소(SiO2-Si)와엽록소-a는 Parsons et al. (1984)에따 라측정하였다. 식물플랑크톤의계수및동정을위하여 300 ml 폴
리에틸렌병에시료를담은후 Lugol’s solution으로고정하여계
수는 Sedgwick-Rafter counting chamber를사용하여 200배하에
서동정은 400~1000배하에서수행하였다. 식물플랑크톤의분류
체계는 Dodge(1982), Parke and Dixon(1968), Simonsen(1979)의
분류체계에따랐다. 식물플랑크톤의탄소량을계산하기위하여, 각
출현종의폭과길이를측정하여평균체적(µm3)을구하는 Kovala
and Larrance(1966)의방법에따라식물플랑크톤생체량을계산하
였다.
식물플랑크톤과물리, 화학적환경요인과의상관관계를파악하 기위하여 canonical correspondence analysis(CCA)를이용하여 분석하였다(MVSP, muti-variate statistical package 3.1).
결 과
물리화학적 요인
1999년부터 2002년까지의마산만의평균기온평년차(기상청,
1999~2002)를보면, 조금씩상승하는경향이나타났다. 2003년과 비교하였을때 2004년은전계절적으로기온이높아져평균기온 평년차가 0.9oC 정도높게나타났다(Fig. 2). 1999년부터마산만
의강우량평년차(기상청, 1999~2002)를보면, 조금씩감소하는
경향이나타났으며, 특히 2003년과비교하였을때 2004년 6월과
7월에강우량이 줄어든것으로나타났다(Fig. 3). 조사기간 동안
강우량은 2004년 2월초 57 mm day-1 정도를시작으로잦은강우 가관찰되어 8월말에는최고 116 mm day-1의폭우도관찰되었
다. 조사기간 동안수층별수온 분포를보면, 2003년 11월부터
2004년 2월까지는전수층의수온이낮았으며잘혼합되었다. 2004
년춘계부터하계까지점진적으로수온이상승하면서수온약층이 형성되었으나추계부터는서서히약화되었다(Fig. 4). 수층별염분
의분포를보면, 동계인 2003년 11월부터 2004년 1월까지에는표,
중층에서염분이낮게조사되었으며, 하계에아시아몬순기후의
강우특성으로표층에는염분이매우낮은것으로조사되었다. 그 러나늦은하계에는저층에서저염분수가조사되었다(Fig. 4). 용 존산소포화도는최저 2.77% (2004년 7월, 10 m)부터최고 110.05%
(2004년 9월, 2 m)까지측정되었다. 수층별용존산소포화도분포 를보면 2003년 11월부터 2004년 2월까지는수층별분포차이가 크게없었으나춘계부터성층화현상으로표층과저층의용존산 소포화도의차이가나타나기시작하여늦은춘계부터하계까지 저층에저산소층이형성되었으나표층에서는용존산소포화도가증
가하였다. 특히 2004년하계부터추계까지표층의용존산소포화
도가높게나타났다(Fig. 4). 이러한결과는동해역에서조사된
조등(1998)의논문에서나타난값(93~214%)보다는낮았으나해
양수산부(2002)에서조사된측정값과는유사하게나타났다.
조사기간동안암모니아성질소(NH4-N)는최저 19.2µM(2004년 8월, 0 m)부터최고 24.8µM (2004년 7월 10 m)까지조사되었다
(Fig. 5.). 수층에따른암모니아염의분포는계절적차이가없었으
며, 진해만에서조사된이(1997)의논문에서나타난 암모니아염
(1.0~65µM)과는비슷하지만여자만에서조사된이와윤(2000)의 논문에서나타난 암모니아염(0.67~4.50µM) 보다는 풍부하였다.
질산성질소(NO3-N)은최저 0.015µM (2003년 12월, 12 m)부터 최고 9.4µM(2004년 12월 8 m)까지조사되었다(Fig. 5). 수층에
따른질산염의분포는 2003년이른동계에높은것으로조사되었
으며, 2004년춘계부터이른하계까지저층에서낮은농도가관
찰되었으나점차증가하여추계에전수층에서높게나타났다. 이 Fig. 2. Monthly variation of mean air temperature (0.1oC) in the Masan
Bay from 1999 to 2004.
Fig. 3. Monthly variation of mean precipitation (0.1 mm) in the Masan Bay from 1999 to 2004.
러한결과는여자만에서 조사된이와윤(2000)의논문에서나타
난질산염(0.17~8.38µM)의농도와유사하게나타났다. 인산성인 (PO4-P)은최저 0.1µM(2003년 11월, 4~6 m)부터최고 0.5µM (2004년 6월, 4 m)까지조사되었다(Fig. 5). 수층에따른인산염의
분포는 하계를 제외하고 빈영양 해역에서의 인산염의 농도인
0.14~0.18µM(Perry and Eppley, 1981)에포함될정도로계절적
차이없이낮은농도를보였다. 이러한결과는조등(1998)의논
문에서조사된농도(0.15~8.12µM)와일부기간은비슷하였으나
해양수산부(2002)에서조사된농도(1.1~2.3µM)와는큰차이를보
였다. 규산성규소(SiO2-Si)는최저 1.1µM(2003년 11월, 4 m)에
서최고 4.4µM(2004년 7월, 10 m)까지조사되었다(Fig. 5). 수층
에따른규산염의분포는 2003년늦은추계에중층은낮은농도
를표, 저층은높은농도를보이다가동계가되면서감소하였다.
그러나강우량이늘어나는 2004년춘계부터서서히증가하여하
계에상대적으로높은농도를보이다가추계가되면서다시감소
하였다. 이러한결과는동해역에서조사된이(1997)의논문에서
나타난농도(4~26µM)와마산만인근지역인통영에서조사된정
(2001)의논문에서나타난 농도(0.25~21.35µM)에비해낮았다. N:P ratio는최저 9.4(2003년 11월)에서최고 105.4(2004년 10월)
로조사되었다. 특히동계와추계에인산염의농도가반포화상수 이하의값을보여절대적으로결핍되었음을 알수있다(Fig. 6).
N:Si ratios는최저 0.7(2004년 7월)에서최고 12.3(2004년 10월)
까지조사되었다. 특히동계와추계에는전수층에서규조류의우
점으로규산염이급격히감소하여 N:Si ratios가증가하였다(Fig.
6). Si:P ratio는최저 1.7(2003년 11월)에서최고 27.7(2004년 8월)의
범위에서변화하였지만규조류가우점하는대발생이일어난 2003
년늦은추계의중층, 2004년동계와추계의전수층에서 Si:P
ratio가 10정도로낮았을뿐대부분의시기에높게나타났다(Fig.
6). 이와같이결국대상수역에서는인산염은전조사기간동안결
Fig. 4. Seasonal changes of precipitation (mm) (A), water temperature (oC) (B), salinity (‰) (C) and dissolved oxygen (DO) saturation (%) (D) in the Masan Bay from November 2003 to October 2004.
Fig. 5. Vertical distributions of NH4-N (left upper), NO3-N (right upper), PO4-P (left bottom) and SiO2-Si (right bottom) (µM) in the Masan Bay from November 2003 to October 2004.
핍되었으며, 규산염은규조류가대발생한추계와동계에일시적으
로제한된것으로나타났다.
식물플랑크톤의 탄소량, 엽록소-a와 개체수의 계절변화 양상 조사기간동안식물플랑크톤의탄소량은최저 0.9µg l-1(2004년
2월, 10 m)부터최고 3903.9µg l-1(2003년 12월, 10 m)까지나타
났다(Fig. 7). 수층별식물플랑크톤탄소량은비교적낮은염분의
혼합된수괴가발달된동계에높았다. 잦은강우에의한낮은염
분과온도에의한성층화현상이나타난 2004년하계의표층에서
높은값을나타냈다. 그러나, 춘계에는매우낮은탄소량을보였다.
엽록소-a는최저 0.1µg l-1(2004년 5월, 10 m)에서최고 110.6µg l-1(2004년 7월, 0 m)까지나타났다(Fig. 7). 수층별엽록소-a분포
를보면, 2003년늦은추계부터이른 동계까지높은농도를보였
다. 그후 2004년춘계가되면서감소하였으나하계에표층에서
높은값을보였다.
식물플랑크톤의개체수는최저 4.99×10⁴ cells l-1(2003년 11월, 4 m)부터최고 2.88×10⁷ cells l-1(2004년 10월, 0 m)까지나타났
다(Fig. 7). 수층별 식물플랑크톤개체수의 분포를보면, 2004년
동계에비교적높은개체수를보이다춘계에급격히감소하였으 나 2004년하계표층부터증가하여추계(특히 10월)에가장많은 세포수가전수층에서관찰되었다.
탄소량과엽록소-a는 2003년동계와 2004년하계의표층에서
높은현존량이관찰되어비슷한양상을보였다. 또한, 하계와동
계의식물플랑크톤 대발생시기에는염분이상대적으로낮은현 상이관찰되었다. 식물플랑크톤의개체수는 2003년동계, 2004년 하계의표층에서높게관찰되였으며, 추계에는이때보다 5배가높
은밀도의세포수가관찰되었다. 이와같이현존량의표현방법에
따라생물량의변화양상이다르게표현되었다.
식물플랑크톤 군집 구조와 천이
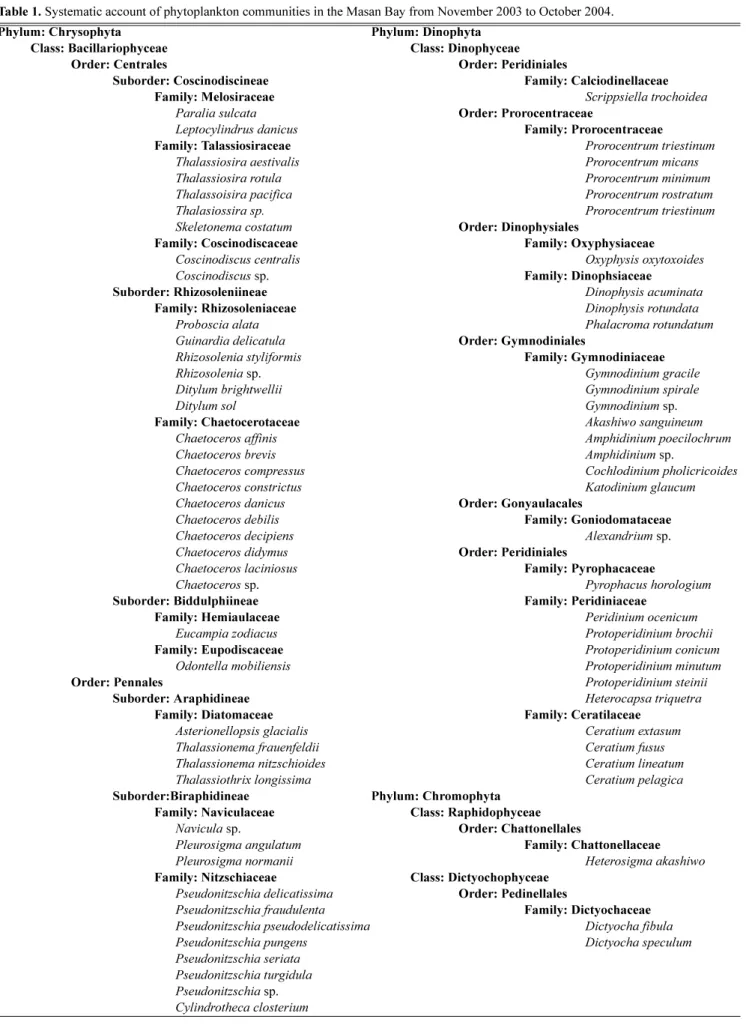
조사기간동안출현한총식물플랑크톤은 3문, 4강, 10목, 21과, 34속, 78종으로동정되었다. 이들은다시규조류는 44종, 와편모 조류는 31종, 침편모조류는 1종, 무색규질편모조류 2종으로구성
되어있었다(Table 1). 조사기간동안군집의천이를보면 11월부
터 12월까지규조류가우점하였으나, 2월에는와편모조류가가장
우점하였고, 3월부터 6월까지는와편모조류와규조류가비슷한생
물량으로우점하였다. 7월부터침편모조류가급속하게증가하여 규조류와함께우점하였으나, 8월중반부터침편모조류는급격하 게감소하고규조류가단독으로우점하였다(Fig. 8).
우점종은상위 80% 까지를점유한종(McNaughton, 1967)으로
Skeletonema costatum과 Cylindrotheca closterium의규조류 2종, Heterocapsa triquetra, Prorocentrum minimum및 P. triestinum의 와편모조류 3종, Heterosigma akashiwo의침편모조류 1종이선정 Fig. 6. Vertical distributions of N:P (upper), N:Si (middle) and Si:P
(bottom) ratio in the Masan Bay from November 2003 to October 2004.
Fig. 7. Vertical distributions of carbon biomass of phytoplankton (×100µg l-1) (upper), chlorophyll a (µg l-1) (middle) and standing crops (105 cells l-1) (bottom) in the Masan Bay from November 2003 to Octo- ber 2004.
Table 1. Systematic account of phytoplankton communities in the Masan Bay from November 2003 to October 2004.
Phylum: Chrysophyta Phylum: Dinophyta
Class: Bacillariophyceae Class: Dinophyceae
Order: Centrales Order: Peridiniales
Suborder: Coscinodiscineae Family: Calciodinellaceae
Family: Melosiraceae Scrippsiella trochoidea
Paralia sulcata Order: Prorocentraceae
Leptocylindrus danicus Family: Prorocentraceae
Family: Talassiosiraceae Prorocentrum triestinum
Thalassiosira aestivalis Prorocentrum micans
Thalassiosira rotula Prorocentrum minimum
Thalassoisira pacifica Prorocentrum rostratum
Thalasiossira sp. Prorocentrum triestinum
Skeletonema costatum Order: Dinophysiales
Family: Coscinodiscaceae Family: Oxyphysiaceae
Coscinodiscus centralis Oxyphysis oxytoxoides
Coscinodiscus sp. Family: Dinophsiaceae
Suborder: Rhizosoleniineae Dinophysis acuminata
Family: Rhizosoleniaceae Dinophysis rotundata
Proboscia alata Phalacroma rotundatum
Guinardia delicatula Order: Gymnodiniales
Rhizosolenia styliformis Family: Gymnodiniaceae
Rhizosolenia sp. Gymnodinium gracile
Ditylum brightwellii Gymnodinium spirale
Ditylum sol Gymnodinium sp.
Family: Chaetocerotaceae Akashiwo sanguineum
Chaetoceros affinis Amphidinium poecilochrum
Chaetoceros brevis Amphidinium sp.
Chaetoceros compressus Cochlodinium pholicricoides
Chaetoceros constrictus Katodinium glaucum
Chaetoceros danicus Order: Gonyaulacales
Chaetoceros debilis Family: Goniodomataceae
Chaetoceros decipiens Alexandrium sp.
Chaetoceros didymus Order: Peridiniales
Chaetoceros laciniosus Family: Pyrophacaceae
Chaetoceros sp. Pyrophacus horologium
Suborder: Biddulphiineae Family: Peridiniaceae
Family: Hemiaulaceae Peridinium ocenicum
Eucampia zodiacus Protoperidinium brochii
Family: Eupodiscaceae Protoperidinium conicum
Odontella mobiliensis Protoperidinium minutum
Order: Pennales Protoperidinium steinii
Suborder: Araphidineae Heterocapsa triquetra
Family: Diatomaceae Family: Ceratilaceae
Asterionellopsis glacialis Ceratium extasum
Thalassionema frauenfeldii Ceratium fusus
Thalassionema nitzschioides Ceratium lineatum
Thalassiothrix longissima Ceratium pelagica
Suborder:Biraphidineae Phylum: Chromophyta
Family: Naviculaceae Class: Raphidophyceae
Navicula sp. Order: Chattonellales
Pleurosigma angulatum Family: Chattonellaceae
Pleurosigma normanii Heterosigma akashiwo
Family: Nitzschiaceae Class: Dictyochophyceae
Pseudonitzschia delicatissima Order: Pedinellales
Pseudonitzschia fraudulenta Family: Dictyochaceae
Pseudonitzschia pseudodelicatissima Dictyocha fibula
Pseudonitzschia pungens Dictyocha speculum
Pseudonitzschia seriata Pseudonitzschia turgidula Pseudonitzschia sp.
Cylindrotheca closterium
되었으며이들에대한개체수(Fig. 9)와탄소량(Fig. 10)의계절적
변화양상을살펴보았다. 먼저개체수에따른계절적변화양상을
살펴보면P.minimum의경우늦은추계부터동계까지, H. triquetra
는늦은동계에우점하였다. P. triestinum은늦은춘계부터이른 하계까지, H. akashiwo는춘계부터조금높은경향을보이다가늦 은하계에 C. closterium와함께우점하였다. S. costatum은추계 에가장우점하였으며, 이때단일종이총식물플랑크톤세포수의
82% 이상을차지하였다. 탄소량에의한계절적변화양상을살펴 보면, 개체수에따른변화와유사한출현양상을보이나현존량의 표현방법에따라그양이다르게나타났다. 즉, 탄소량으로표현 할때는침편모조류인H. akashiwo와 P.minimum이, 개체수로표
현할때는규조류인C. closterium과S. costatum이주요우점종으 로나타나식물플랑크톤현존량의표현방법에따라주요우점종 의출현양상이다르게나타났다. 또한, 염분이상대적으로낮은시 기에발생된하계의대발생시기에는H. akashiwo와C. closterium
이, 동계의저염분수역에서는 P. minimum이우점종으로출현하 였으며, 추계에는 S. costatum이우점종으로출현하였다.
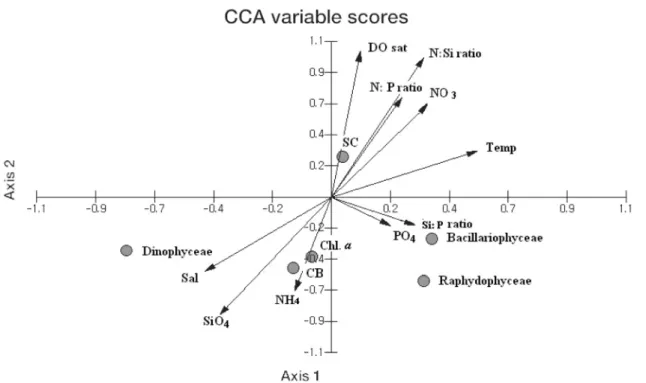
식물플랑크톤과 환경요인과의 통계분석
식물플랑크톤의현존량변화에영향을미치는주요환경요인을 확인하기 위하여 CCA분석을수행하였다. 본 연구에서 얻어진
Fig. 8. Fluctuations in total standing crops which divided into 3 taxa in water column in the Masan Bay from November 2003 to October 2004 (■: Raphydophyceae, ○: Dinophyceae, ▲: Bacillariophyceae).
Fig. 9. 6 dominant species of phytoplankton which selected by standing crops (×105 cells l-1) in the Masan Bay from November 2003 to October 2004.
CCA 모델에서 CCA 축 1에서축 2까지의고유치(eigencalues)는 0.19 (λ1)에서 0.14의분포를나타내었다(Table 2). 주요 2개 CCA
축의고유치들은이들 2개축으로설명될수있는총자료의분산
에대한누적공통분산의비율이 68.57%이었고, 그중축 1(λ1)과 축 2(λ2)가각각전체변수의총변동의 40.04%와 28.52%를차지하
여모든플랑크톤분산의 68.57%가이들두축으로설명될수있다.
CCA 축 1, 2에각자료를배열한결과는아래와같이해석된다(Fig.
11). 개체수로표현되는현존량은규조류과관계가있으며, 환경요
인중에서수온, 질산염과인산염의영향을받는것으로나타났다.
그리고탄소량과엽록소-a로표현되는현존량은규조류뿐만아니 라와편모조류와침편모조류와관계가있으며, 환경요인중에서염 분, 규산염과인산염의영향을받는것으로나타났다.
고 찰
과거본조사지역의적조발생양상은쌍봉형으로춘계와추계에 집중적으로 발생하였으며(곽등, 2001; 김, 1989; 이, 1997; 최,
1998), 최근에는강우후의하계에도적조가빈번하게발생하였다
(김과신, 1997; Lee et al., 2002 ). 그러나, 이번조사기간동안은
춘계의적조발생이감소하는대신에동계적조가발생되었다. 춘
계에발생되었던적조의감소원인은무엇일까? 과거의춘계적조의 경우, Heterocapsa triquetra, Heterosigma akashiwo와Prorocentrum속 등이우점하였다(곽등, 2001; 이, 1997; Lee and Yoo, 1990). 본 종들은조사기간중H. triquetra의경우동계에, H. akashiwo의 경우하계에, Prorocentrum속의경우하계와동계에각각대발생 을일으켰으나춘계동안은우점하지않았다. 그리고조사기간
중춘계에는강우량이줄었으며질산염이상대적으로낮았고규 산염과인산염이상대적으로결핍된기간이다(Fig. 5). 춘계의영 양염결핍은과거에는발생되지않았던현상이지만동계적조로 인한영양염의고갈과춘계동안강우로인한영양염공급이거 의일어나지않은것이원인인듯하다. 이와같이영양염의결핍 은춘계에적조를일으키는와편모조류와편모조류뿐만아니라 규조류도성장에 제한적인역할을 할수있다(Brussaard et al., 1997; Chapman et al., 1980; Plumley et al., 1989; Smith, 1990;
Fig. 10. 6 dominant species of phytoplankton which selected by carbon biomass (×100µg l-1) in the Masan Bay from November 2003 to October 2004.
Timpano and Pfiester, 1985). 이와같이영양염의제한으로인해
조사기간동안춘계적조가감소하게된것으로추정된다. 그렇
다면, 동계적조가발생하는원인은무엇인가? 우선, 동계의종조
성을과거와비교해보면과거동계에높은개체수를보인우점종 인Eucampia zodiacus, H. triquetra, S. costatum과 Thalassiosira rotula(이, 1997; Lee, 1994; Lee and Yoo, 1990)등과종조성의차 이가크게 보이지않았으나개체수에의한생물량은 종에따라
102~104 cells l-1정도높게나타났다. 이와같은생물량의원인으 로동계수온의증가를꼽을수있다. 과거동수역의조사결과,
수온이과거에비해약 4oC 정도로높게관찰되었다(김, 1989; 이, 1997; 최, 1998; 국립수산과학원, 2000). 일반적으로식물플랑크톤 의성장률과관계가깊은수온의증가는기온의상승이나외부로
부터난류성 수괴의유입에의해영향을 받는다(Knauss, 1997).
그러나, 마산만은만의입구에위치한섬들과좁은수로로연결된 반폐쇄성해역으로서외해로부터쿠로시오난류의영향은미미할 것으로사료된다. 그러나마산만은수심이비교적얕아대기온도
와비교적쉽게영향을받을수있다(해양수산부, 2002). 즉, 최근
6년간지속적으로상승한기온의영향을많이받은것으로추정된 다. 전지구적인이상기후현상의심화로최근전세계여러지역에
서동계의적조 발생이빈번하게보고된 바있다(Goffart et al.
2002). 앞에서논한바와같이춘계와동계뿐만아니라하계의적
조원인종(H. akashiwo, Chaetoceros sp., Prorocentraum, Pseudo- nitzschia sp.와S. costatum)은과거에비해크게천이되지는않았 다(곽등, 2001; 이, 1997; Lee and Yoo, 1990). 따라서, 마산만의 쌍봉형의적조발생양상의변화는단순한우점종의천이에의한 적조발생패턴이변화된것이아니라, 조사기간의동계수온이상 승하여동계적조를유발시킨것이우점종의천이를바뀌게한 요인으로사료되며, 이로인한동계의영양염의고갈이춘계까지
지속되어춘계적조발생을억제해적조발생양상의변화를가 져왔다고판단된다.
늦은하계부터폭발적으로증가한 Skeletonema costatum은이 른동계까지가장높은현존량을차지하는최우점종으로밝혀졌 다. 이와같이 S. costatum이늦은하계부터이른동계까지최우 점종으로존재할수있었던원인은크게 2가지로추론된다. 첫번 째는영양염에대한경쟁력우위이며두번째는온도의증가가주 요원인이될것이다. 먼저식물플랑크톤의생장에크게영향을
끼치는질소와인의부족으로나타나는현상을살펴보면, 질소의
부족은엽록소의 분해와 CO2고정효소중의하나인 Rubisco의
활성저감에영향을끼치며(Plumley et al., 1989), 인의부족은 식물플랑크톤의 질소고정 능력감소에 영향을 끼친다(Smith,
1990). 그리고 질소와 인이 동시에부족하면 세포의 자가분해
(autolysis)가유발된다(Brussaard et al., 1997). 그러나S. costatum
의경우, 질산염과인산염을세포내에저장할수있는성장특성 (Balch, 1985; Dortch et al., 1984; Krom et al., 1991; Yamamoto Fig. 11. Species-environment biplot CCA. The points represent 6 association with one or more individual species and the arrows represent each environmental variable pointing in the direction of its maximum change across the diagram from November 2003 to October 2004.
Table 2. Eigenvalues of CCA analysis in the Masan Bay from November 2003 to October 2004. (CB: Carbon biomass, SC: standing crops, Sal.:
Salinity, Temp.: Temperature)
Axis 1 Axis 2
Eigenvalues 0.19 0.014
Percentage 40.05 28.52
Cum. Percentage 40.05 68.67
Cum. Constr. Percentage 52.26 89.48
Spec.-env. Correlations 0.82 0.97