1. Introduction
Supersonic inlets can capture supersonic flows and decelerate velocity of the flow with a succession of oblique shocks on the inside of inlet. These oblique shocks can bring about shock/shock interactions and shock/boundary layer interactions.
The shock/boundary layer interaction can cause a boundary layer separation which may result in instability and a reduction in the total pressure recovery. This could significantly degrade combustion efficiency. Therefore, the control of the shock/boundary layer interaction is crucial to the performance of supersonic inlets.
A method for overcoming the boundary layer separation is using a boundary layer bleed, wherein the low momentum flow adjacent to the inlet is diverted through separate passages. The kinetic energy of the remaining boundary layer is increased. Consequently, it has the ability to overcome the boundary layer separation.
A number of investigators used both experimental and numerical methods for further study. The study of Willis et al. is a typical example of experimental method[1-3].
The experiment focuses on the sonic flow coefficient behavior for boundary layer bleed orifice configurations.
Numerical studies has been concentrated on the aerodynamic analysis of supersonic inlet containing bleed system[4]. Because of the computational cost needed for resolving individual bleed holes and plenum, bleed boundary condition models are used in CFD simulations.
Some bleed models that are well-known are considered in this study. Mayer and Paynter bleed model computes the bleed mass flow rate based on local properties, total bleed
ACCURACY IMPROVEMENT OF THE BLEED BOUNDARY CONDITION WITH THE EFFECTS OF POROSITY VARIATIONS AND EXPANSION WAVES
G. Kim,1 Y. Choe1 and C. Kim*1,2
1Department of Aerospace Engineering, Seoul National University
2Institute of Advanced Aerospace Technology, Seoul National University
다공도 및 팽창파의 영향을 고려한 BLEED 경계조건 수치 모델링의 정확도 향상 연구
김 광 현,1 최 요 한,1 김 종 암*1,2
1서울대학교 기계항공공학부
2서울대학교 항공우주신기술연구소
The present paper deals with accuracy improvement of a bleed boundary condition model used to improve the performance of supersonic inlets. In order to accurately predict the amount of bleed mass flow rates, this study performs a scaling of sonic flow coefficient data for 90-degree bleed holes in consideration of Prandtl-Meyer expansion theory. Furthermore, it is assumed that porosity varies with stream-wise location of the porous bleed plate to accurately predict downstream boundary layer profiles. The bleed boundary condition model is demonstrated through Computational Fluid Dynamics(CFD) simulations of bleed flows on a flat plate with/without an oblique shock. As a result, the bleed model shows the improved accuracy of bleed mass rates and downstream boundary layer profiles.
Key Words : Computational Fluid Dynamics(CFD), Supersonic Inlet, Shock/Boundary Interaction, Bleed Boundary Condition, Porosity, Prandtl-Meyer Expansion Theory
Received: March 4, 2016, Revised: March 25, 2016, Accepted: March 26, 2016.
* Corresponding author, E-mail: [email protected] DOI http://dx.doi.org/10.6112/kscfe.2016.21.1.094
Ⓒ KSCFE 2016
hole area, and empirical sonic flow coefficients[5]. The use of sonic flow coefficient data requires properties at the edge of the boundary layer. Slater bleed model that performed a scaling of sonic flow coefficient data for 90-degree holes allowed the bleed mass rate to be computed based on surface properties[6]. Doerffer and Bohning bleed model computes the bleed mass rate considering the effect of a tangential flow along a porous wall and aerodynamic porosity[7].
The bleed models commonly indicate low accuracy of bleed mass rates as compared to experimental data. Since inadequate bleed is undesirable, it seems that a solution is to design bleed system with excess bleed mass rates.
However, it is not the total solution because excessive bleed mass flow rate can be inefficient and injurious. The bleed flow is extracted by suction into bleed holes and does not take part in the production of thrust. Also, the boundary layer removed becomes a part of the aircraft system, thus leading to aerodynamic drag. So, accurate prediction of the bleed mass flow rate is important in order to maximize the efficiency of supersonic inlets.
The computed downstream boundary layer profiles obtained using bleed models are somewhat fuller than experimental result near the surface. It leads to excessive bleed effects in CFD simulations, which may result in misprediction of a boundary layer separation. Consequently, it is also important to predict health of the boundary layer downstream of a bleed region[1].
The current work improves the accuracy of bleed model by introducing Prandtl-Meyer expansion theory and variable porosity. The improved bleed model is demonstrated for flows over bleed regions on flat plates with/without an oblique shock. The results from the bleed model are compared with results from other bleed models and experimental data.
2. Governing Equations and Numerical Methods 2.1 Governing Equations
The governing equations are the compressible Navier-Stokes equations.
(1)
The vector represents the conservative variables. The
, , and represent the inviscid flux vectors of , ,
-direction, respectively. The subscript indicates the viscous flux. The S is a source of the equation.
2.2 Numerical Methods
The flux scheme of AUSMPW+ is used for the spatial discretization. The AUSMPW+ scheme removes non -monotonic pressure oscillations of AUSM-type scheme near a wall or behind a shock wave[8].
Lower-Upper Symmetric Gauss-Seidel(LU-SGS) implicit time integration is used. Yoon and Jameson introduced an implicit algorithm based on a lower-upper factorization and Gauss-Seidel relaxation. The LU-SGS scheme, which requires the scalar calculation for inversion, can reduce considerable memory and computing time[9].
For an adequate description of turbulent flow-field within the framework of a Reynolds Averaged Navier-Stokes(RANS) formulation, Menter’s k-w SST model is employed. The model combines desirable elements of existing two-equation models[10].
Monotone Upstream-centered Schemes for Conservation Laws(MUSCL) is adopted to obtain higher order spatial accuracy[11]. The van Leer limiter is included to avoid spurious oscillations[12]. In order to discretize the viscous flux terms, a second order central differencing is used.
3. Improved Bleed Boundary Condition
Slater performed a scaling. The scaling simplifies implementation of bleed boundary condition by no longer requiring flow properties at the edge of the boundary layer. It reduces computational costs. Because of these strengths, the improved bleed model was developed based on Slater bleed model. The bleed flow rate is
(2)
where is the porosity that is the ratio of the sum of the cross-sectional area of all the bleed holes and the surface area of the bleed region . and are the gas constant and ratio of specific heat. and are the total pressure and temperature, and is the Mach number of the flow through the bleed holes.
The is a reference flow rate defined as
(3)
The reference bleed flow rate is defined as isentropic sonic flow condition through bleed holes. The
bleed flow is assumed to be normal to a domain boundary. The normal velocity component is given by
(4)
where is the boundary surface density.
Slater suggested an alternative reference flow rate
that is defined as
(5)
where and are the wall pressure and temperature.
The surface sonic flow coefficient is defined as
(6)
Slater bleed model assumed that the wall pressure is approximately equal to the pressure of the boundary layer edge. Also, it is assumed that the temperature recovery factor is one.
≈
and
≈ (7)
where and are the total pressure and total temperature at the boundary layer edge.
The Mach number of the boundary layer edge is substituted for freestream Mach number. However, the bleed leads to the acceleration of flow at the start of the bleed region as the flow turns into bleed holes. Therefore, the Mach number at the edge of the boundary layer over the bleed region is larger than the Mach number at the edge of the approaching boundary layer. As a result, Slater bleed model consistently underestimates the sonic flow coefficient values for all Mach numbers.
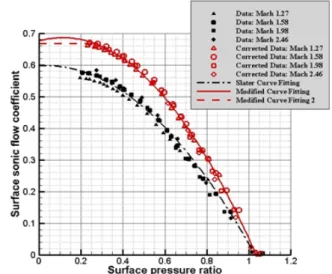
In order to solve the problem which is reduction of the accuracy of bleed model, a new scaling that considers expanded Mach number at the edge of the boundary layer is performed in this study. A local expansion process at the start of the bleed region is assumed to be a Prandtl-Meyer expansion. The expanded Mach number at the boundary layer edge can be expressed as
Fig. 1 New scaling applied to sonic flow coefficient
(8)
where is the Mach number at the edge of the approaching boundary layer, is the static pressure at the boundary layer edge before the flow is turned into bleed holes, and is the static pressure at the edge of the boundary layer above the bleed region. Because of a assumption that the static pressure at the boundary layer edge is equal to the static pressure of the surface, the static pressure at the boundary layer edge over a bleed region is equal the pressure at the surface.
An expansion of bleed flow varies with the plenum pressure ratio. At the low plenum pressure ratios, CFD simulations using Slater bleed model show much lower values of sonic flow coefficient than experimental data. At the high plenum pressure ratios, the expansion of the bleed flow is insignificant. So, it leads to a closer match with experimental data.
Considering the variation of expansion according to plenum pressure ratios, the new scaling is performed as shown in Fig. 1. At the low surface plenum pressure ratios, the deviation between a original scaling and a new scaling is large due to the effect of a Prandtl-Meyer expansion above the bleed region. The deviations become smaller as surface plenum pressure ratios become larger.
A quadratic curve was fitted to a scaled data of Fig. 1.
The quadratic equation is
(9)
where is the plenum static pressure.
Additionally, the quadratic equation from using the original scaling yields a positive slope as <
0.02585. This contradicts an expectation that sonic flow coefficients continually increase as the static plenum pressure approaches the plenum pressure that chokes the bleed system. The bleed flow rate will increase until the bleed system is choked, after which the bleed flow rate will remain constant. Accordingly, the surface sonic flow coefficient is assumed to be constant at less than the plenum pressure that would result in choked flow through bleed holes.
(10)
In calculations using the bleed models, a bleed region is assumed continuously porous through the use of a uniform porosity. However, a assumption is not adequate because it leads to only one shock at the start of the bleed region and one expansion process at the end. This assumption can influence a prediction of the boundary layer downstream of the bleed system. In effect, several shocks and expansion processes occur on the porous plate.
To account for the spatial variation of the porosity, the bleed area is span-averaged. The variable porosity
is expressed as
,
, otherwise (11)
where is the center position of bleed row and
is the radius of a bleed hole[13].
4. Numerical Results and Discussions
CFD simulations are performed to evaluate the accuracy of the improved bleed model. The simulations include the flow over a porous flat plate at four Mach number conditions. Various bleed flow rates are simulated to assess the ability of the improved bleed model to predict bleed flow properties.
An oblique shock wave interaction with a boundary layer over a porous flat plate is also included in CFD simulations. The purpose of simulations is to assess the ability of the bleed models to predict bleed properties in the presence of a shock/boundary layer interaction.
The agreement between experimental data and results obtained from CFD simulations is indicated by the coefficient of variation of the root mean square error CV(RMSE)[14]. The CV(RMSE) is expressed by
ex p
(12)
where n is the number of data points measured in the experiments. and are sonic flow coefficients obtained from the experiments and CFD simulations, respectively.
4.1 Flat Plate in Uniform, Supersonic Flow
The first application represents a uniform supersonic flow over a porous flat plate. This flow was studied in wind-tunnel tests conducted by Willis, Davis, and Hingst at the NASA Glenn Research Center in the 1990s[2]. The porous plate is the C1 plate which has 75 circular bleed holes at an angle of 90-degree to the surface distributed over a 6.985 cm by 17.78 cm area. The diameter of bleed holes is 0.635 cm. The porosity of the bleed plate is 0.1912. CFD simulations are conducted for a two-dimensional flow domain using bleed boundary conditions. Table 1 summarizes the wind-tunnel flow conditions and the boundary layer characteristics measured in the reference plane.
Mach1.27 Mach
1.58 Mach
1.98 Mach 2.46 Total pressure 89.6 103.4 137.9 172.4 Total temperature 293.0 293.0 293.0 293.0
× 1.35 1.34 1.77 1.75
2.24 2.10 2.44 2.63
0.393 0.436 0.567 0.717
0.209 0.192 0.202 0.198
1.259 1.275 1.262 1.26
× 2.07 1.69 1.50 1.29
Table 1 Porous plate 1ft. by 1ft supersonic wind-tunnel operating conditions
Fig. 2 Computational domain for flat plate containing bleed region
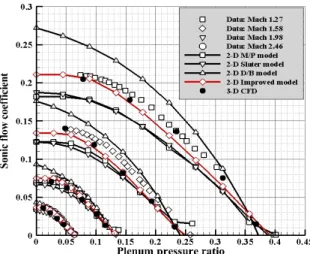
Fig. 3 Comparison of sonic flow coefficient data in a uniform, supersonic flow
A computational domain is shown in Fig. 2. The left boundary is imposed with a supersonic inflow boundary condition. The bleed boundary condition is used within the bleed region. A slip condition is used at the front of the wall and an adiabatic, no-slip condition is used on the rest of the bleed plate. The top boundary is imposed with a far-field boundary condition. The right boundary is imposed with a supersonic outflow boundary condition.
Multi-block, structured H-grid is used for the computational domain. The wall normal spacing is set to
at Mach 1.27 and at Mach 2.46.
The results obtained from using Mayer/Paynter, Slater, Doerffer/Bohning, and improved bleed model are shown in Fig. 3. As Mayer/Paynter model does not allow injection of the flow from the bleed plenum, it leads to discontinuous behavior when sonic flow coefficient data approaches zero. Some improvements can be seen from Slater model that shows a smoother variation of the bleed
flow rate as sonic flow coefficients come close to zero.
However, Slater model consistently underestimates the sonic flow coefficient values for all Mach conditions because a local expansion of the bleed flow is not considered. Doerffer/Bohning model shows sonic flow coefficient values closer to experimental data at large Mach number conditions. But, this model generally underestimates sonic flow coefficient values for high plenum pressure ratios. On the other hand, values are overestimated for low plenum pressure ratios. The results obtained through the use of Doerffer/Bohning model are too inconsistent. The improved model shows an improved match with experimental data because the model takes into account a localized expansion and acceleration of bleed flow. The CV(RMSE) values are shown in Table 2. The improved model shows a low value of the CV(RMSE), which indicates good agreement.
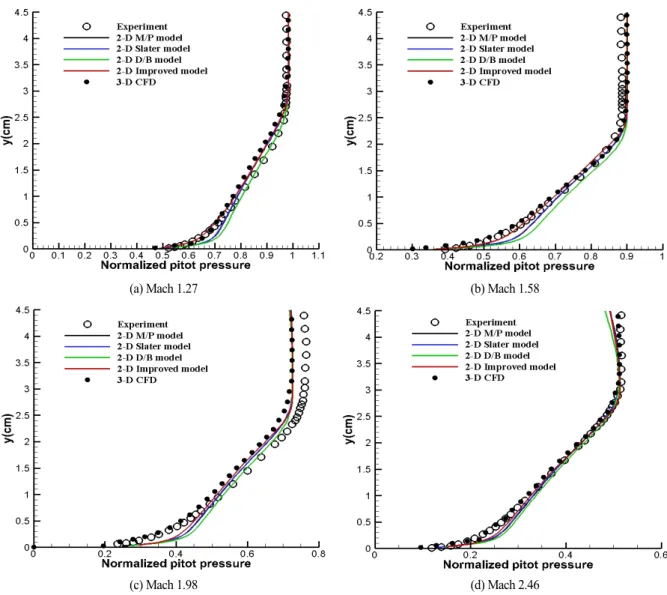
The ability of a bleed model to predict the boundary layer downstream is an important factor. Figure 4 shows comparison of normalized boundary layer pitot pressure profiles extracted at downstream of the bleed region. This comparison is performed at the maximum bleed flow rate.
When Mayer/Paynter, Slater, and Doerffer/Bohning model is applied to simulations, pitot pressure profiles for four Mach number are fuller near the surface. This is likely an effect of the surface roughness. The effect is not considered because the models assumes a continuous bleed over the bleed region. Meanwhile, results of the improved
CV(RMSE)
M/P model 0.208023
Slater model 0.219959
D/B model 0.202962
Improved model 0.101614
Table 2 CV(RMSE) of sonic flow coefficients between experimental data and predictions in uniform, supersonic flow
bleed model are found to be in closer agreement with experimental data. Because an assumption of the variable porosity brings about occurrence of several shocks and expansion processes, the improved model can more accurately predict the boundary layer downstream of a bleed region.
4.2 Flat Plate with Shock/Boundary Interaction
The second application represents the shock/boundary interaction on a flat plate. This flow was studied in wind-tunnel tests conducted by Willis, Davis, and Hingst at the NASA Glenn Research Center in the mid 1990s[3].
The freestream Mach number of wind tunnel is 2.46 and
the deflection angle of shock generator is set at 8-degree.
The porous plate is a modified version of C1 plate that has two extra rows of bleed holes distributed over a 9.525 cm by 15.875 cm area. Table 3 shows wind-tunnel flow conditions and boundary layer characteristics at the reference plane.
Figure 5 shows a computational flow domain. The left boundary is imposed with a supersonic inflow boundary condition. The top boundary includes shock generator that is treated as a slip wall. The rest of the top boundary is specified with a far-field boundary condition. The bleed boundary condition is applied on the bleed region and an adiabatic, no-slip condition is used on the rest of the
(a) Mach 1.27 (b) Mach 1.58
(c) Mach 1.98 (d) Mach 2.46
Fig. 4 Normalized pitot pressure profiles with chocked bleed flow
plate. The right of computational domain is treated as a supersonic outflow. The computational domain is composed of 105,830 cells distributed over 7 blocks with an H-grid topology. The wall normal spacing is set to . The resulting grid is 558×191.
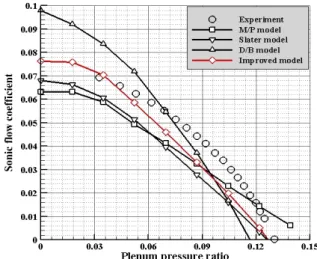
Variations of sonic flow coefficient data with bleed plenum pressure ratios are shown in Fig. 6. Mayer/Paynter model shows lower sonic flow coefficient values than experimental data at low plenum pressure ratios. At the low bleed flow rates, the result indicates high sonic flow coefficient values. It is likely that the bleed model does not allow injection flow which moves from the bleed plenum into the core flow. Slater model indicates lower values of sonic flow coefficient than experimental data, which may be provoked by factors such as turbulence modeling as well as a localized expansion of the flow.
Doerffer/Bohning model excessively tends to overestimate sonic flow coefficient values at low plenum pressure ratios, whereas values are underestimated at high bleed mass rates. It shows too inconsistent results. It seems that the discrepancy is perhaps caused by an assumption that the aerodynamic porosity is equal to the geometric porosity. The improved bleed model generally shows an
Mach 2.46 Total pressure 172.4 Total temperature 292.0
× 1.81
2.63
0.727
0.196
1.29
× 1.43
Table 3 Plate with shock interaction 1ft. by 1ft supersonic wind- tunnel operating conditions
Fig. 6 Comparison of sonic flow coefficient data on flat plate with an oblique shock interaction
improved match with experimental data due to the consideration of an expansion of bleed flow. The CV(RMSE) values are shown in Table 4. The improved model indicates a low value of the CV(RMSE). However, the model underestimates values of sonic flow coefficient at high plenum pressure ratios, which is analogous to the result of Slater model. The contributing factor such as turbulence modeling could be a cause.
CV(RMSE)
M/P model 0.241325
Slater model 0.328982
D/B model 0.298597
Improved model 0.222504
Table 4 CV(RMSE) of sonic flow coefficients between experimental data and predictions on flat plate with an oblique shock interaction
Fig. 5 Computational domain for flat plate with an oblique shock interaction
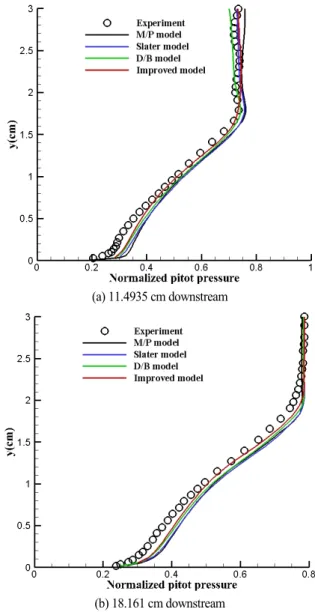
(a) 11.4935 cm downstream
(b) 18.161 cm downstream
Fig. 7 Normalized pitot pressure with choked bleed flow
Comparisons of normalized pitot pressure profiles at the boundary layer downstream are shown in Fig. 7 and 8.
Figure 7 corresponds to a bleed mass flow rate that is near the choking limit. Figure 8 corresponds to a bleed mass flow rate that is half the value that required to choke porous bleed holes. These figures contain pitot pressure profiles at the 11.4935 cm and 18.161 cm downstream of the bleed plate. Normalized pitot pressure profiles at a position just downstream of the bleed region show wiggles near the boundary layer edge. This wave structure is not captured well by bleed models. Overall, boundary layer profiles extracted from CFD simulations
(a) 11.4935 cm downstream
(b) 18.161 cm downstream
Fig. 8 Normalized pitot pressure profiles with half choked bleed flow
using the improved bleed model agree more closely with experimental data because of the consideration of the variable porosity.
5. Conclusion
Accurate prediction of the bleed system performance is important in order to maximize the efficiency of supersonic inlets. A localized expansion of the bleed flow was not considered in the Slater model. Such assumption resulted in low accuracy of the bleed model. In order to improve accuracy of a bleed boundary condition,
Prandtl-Meyer expansion theory was applied to a scaling of sonic flow coefficient data. A quadratic curve was fitted to scaled sonic flow coefficient data. Consequently, the amount of bleed mass rate can be more accurately predicted. In addition, the porosity was defined as the variable porosity that varies with the location of the bleed plate. It leads to improvement of the ability to predict the boundary layer downstream of a bleed region.
CFD simulations of supersonic flow over a flat plate with a bleed region with/without an oblique shock wave were performed. The analysis of simulations was focused on the ability of the improved bleed model to predict sonic flow coefficients and the boundary layer downstream of the bleed region. The CV(RMSE) between experimental data and results obtained from the bleed models was presented. The improved bleed model showed a low value of the CV(RMSE), which indicates improved match with the experimental data. The results of two porous plate configurations showed that the improved bleed model does a reasonable job of predicting sonic flow coefficients and downstream boundary layer profiles with and without in the presence of an oblique shock.
Acknowledgement
This research was supported by the EDISON program through the National Research Foundation of Korea (NRF-2011-0020559) and the program of Development of Space Core Technology (NRF-2015M1A3A3A05027630) through the National Research Foundation of Korea funded by the Ministry of Science, ICT & Future Planning.
Note
This paper is a revised version of a paper presented at the KSCFE 2015 Spring Annual meeting, Jeju, May 14-15, 2015.
References
[1] 1996, Willis, B.P. and Davis, D.O., "Boundary Layer Development Downstream of a Bleed Mass Flow Removal Region," AIAA 1996-3278.
[2] 1995, Willis, B.P., Davis, D.O. and Hingst, W.R.,
"Flow Coefficient Behavior for Boundary Layer Bleed Holes and Slots," AIAA 1995-0031.
[3] 1995, Willis, B.P., Davis, D.O. and Hingst, W.R.,
"Flowfield Measurements in a Normal-Hole-Bled Oblique Shock Wave and Turbulent Boundary Layer Interaction," AIAA 1995-2885.
[4] 2014, Choe, Y., "Numerical Study of Bleed Effect on Supersonic Inlet Performance under Various Bleed Conditions," Master's dissertation, Seoul National University.
[5] 1994, Mayer, D.W. and Paynter, G.C., "Boundary Conditions for Unsteady Supersonic Inlet Analyses,"
AIAA Journal, Vol.32, No.6, pp.1200-1206.
[6] 2009, Slater, J.W., "Improvements in Modeling 90-degree Bleed Holes for Supersonic Inlet," AIAA 2009-0710.
[7] 2000, Doerffer, P.P. and Bohning, R., "Modeling of Perforated Plate Aerodynamics Performance," Tech.
Rep.8.
[8] 2001, Kim, K.H., Kim, C. and Rho, O.H., "Methods for the Accurate Computations of Hypersonic Flows, Part 1: AUSMPW+ Scheme," Journal of Computational Physics, Vol.174, No.1, pp.38-80.
[9] 1988, Yoon, S. and Jameson, A., "Lower-Upper Symmetric-Gauss-Seidel Method for the Euler and Navier-Stokes Equations," AIAA Journal, Vol.26, No.9, pp.1025-1026.
[10] 1994, Menter, F.R., "Two-Equation Eddy-Viscosity Turbulence Model for Engineering Applications," AIAA Journal, Vol.32, No.8, pp.1598-1605.
[11] 1997, Toro, E.F., "Riemann Solvers and Numerical Methods for Fluid Dynamics: A Practical Introduction," Springer-Verlag, pp.409-488.
[12] 1979, Van Leer, B., "Towards the Ultimate Conservative Difference Scheme. V. A Second Order Sequel to Godunov’s Methods," Journal of Computational Physics, Vol.32, No.1, pp.101-136.
[13] 2009, Ghosh, S., Choi, J.I. and Edwards, J.R.,
"Simulation of Shock/Boundary-Layer Interactions with Bleed Using Immersed-Boundary Methods," AIAA 2009-1330.
[14] 2010, Bunnag, S., "Bleed Rate Model Based on Prandtl-Meyer Expansion for a Bleed Hole Normal to a Supersonic Freestream," Master's dissertation, University of Cincinnati.