Field Service Engineer Replenishment Policy Assessment Using a Discrete-Event and Agent-Based Simulation Model : A Case Study
Eun Suk Suh†*
Industrial Engineering Department, Seoul National University
Discrete-event와 Agent 기반의 시뮬레이션을 이용한 현장 서비스 요원 보급 정책 평가 사례 연구
서 은 석 서울대학교 산업공학과
In this paper, a simulation model for assessing the impact of alternative field service engineer replenishment policies is introduced. The end-to-end supply chain simulation model is created using a discrete-event and agent-based simulation model, which enables accurate description of key individual entities in the investigated supply chain, such as field service engineers. Once the model is validated with the historical data, it is used to assess the impacts of field service engineer replenishment policies for a major printing equipment manufacturing firm.In the case study, newly proposed replenishment policies for post-sale distribution supply chain are assessed for the level of service improvement to end customers.
Keywords: Discrete-event simulation, Agent-based model, Field replenishment policy, Supply chain modeling
1. Introduction
1.1 Motivation
The growing trend of market globalization created ample opportunities to increase market share and revenues for many industries. Additionally, this trend has resulted in increased global sourcing of resources for improved productivity, cost and mass customization. However, with such trend, the com- plexity of infrastructure to support such activities also increa- sed. One of the key supporting systems that experienced the growth of complexity is the supply chain. For many global companies, supply chain consist of infrastructures to handle inflow of material to the company and distribution networks that enable goods to be delivered to end customers in a timely manner to satisfy target levels of service, agreed upon by the
company and customers. Also, for many companies that de- velop and sell complex products (e.g. cars, printing systems), they must maintain a sizable inventory of spare parts to sup- port their products in the field, which require periodic main- tenance and unexpected repairs during their life cycles. Spare parts are usually stored in central warehouses, local service depots (e.g. at car dealers) or are being carried in the vehicle trunk of field service engineers, who visit customers’ sites to diagnose and repair equipment that cannot be moved or ship- ped to repair facilities. For these companies the acquisition, allocation and obsolescence management of spare parts are crucial to achieving the level of service of products in the field, but also present many logistical and financial challenges.
First, spare parts must be strategically acquired based on the total number of products in the field, their usage patterns and their position in total life cycle. Second, these spare parts must be properly allocated between various locations (central
†Corresponding author : Professor Eun Suk Suh, Industrial Engineering, Seoul National University, Seoul 08826, Korea, Tel : +82-2-880-7175, Fax : +82-2-889-8560, E-mail : [email protected]
Received March 15, 2015; Revision Received August 2, 2015; Accepted October 22, 2015.
warehouse, service engineer’s car trunk, or on the customer site as part of a field repair kit) to respond quickly to product maintenance and repair. Last, in case of product upgrade or phase-out, many unused spare parts become obsolete, forcing companies to scrap those parts and take the financial loss.
In this paper, the topic of spare parts allocation within the company network is explored. In order to fulfill customers’
service request quickly and to achieve desired the level of service, spare parts for field-deployed products must be stra- tegically allocated. Typically, spare parts are carried by field service engineers, who visit customer sites to diagnose and repair the product with available parts at hand. Once a part is used on the product, the field service engineer requests the- part replenishment from the central warehouse and the re- quested part is shipped out to refill the service engineer’s trunk inventory. Usually, each service engineer is assigned with parts that he/she is likely to use, and the quantity of each part is determined by the service engineer’s historical usage. However, it is inevitable that in some cases, service engineers will not have the proper part for repair, requiring him/her to revisit the customer site with the part at a later time, causing prolonged product downtime and decreased customer satisfaction. This can happen if the service engineer used the last part and is waiting for the replenishment when the service call requiring that particular part comes in. It can also happen if the service engineer responds to a call to repair a product that he/she typically does not service, thus is lack- ing the necessary spare part. Revisiting the customer site, due to the lack of the necessary part, should be minimized since this result in customer dissatisfaction and financial loss to the company, who pays for the service engineer’s labor and re- lated overhead costs.There are ways to reduce the number of service engineer’s revisit incidents through modification of the spare parts replenishment policy, either through adjust- ment of parts shipment time and/or adjustment of parts ship- ment frequency. However, modification to the replenishment policy should be implemented only after comparing quantita- tive results of all feasible alternatives. This requires model- ing of the existing spare parts acquisition, storage and distri- bution network, with enough fidelity to mimic the current re- ality, while being flexible enough to model alternative poli- cies. In many cases, discrete-event simulation is used to mo- del a supply chain of this sort. However when there are sev- eral thousand field service engineers, each with individual spare parts demand, it can present a modeling problem. One of critical downfalls of the discrete-event simulation is that it is nearly impossible to model several thousand service en- gineers individually, forcing the modeler to cluster service engineers into groups, sacrificing the fidelity of the model.
In this paper, an end-to-end supply chain simulation model is introduced, which includes spare parts acquisition from the supplier, their flow into the central warehouse, and the final distribution to field service engineers for individual inventory replenishment. The model consists of a discrete-eventsimu- lation model that describes the flow of spare parts from the
supplier to the central warehouse, and the agent-based model describing field service engineers as individual agents. The proposed simulation model enables accurate description of spare parts flow from the supplier to central warehouse and to individual service engineers in the field. The model is vali- dated using a set of historical data from a major printing equipment manufacturer. Once the model is validated, it is used to assess the feasibility of several alternative spare parts replenishment policies for field service engineers. Discussion of results and conclusion are presented.
1.2 Related Research
Spare parts inventory management is an important part of complex system deployment and operation throughout its lifetime. Complex systems are operational in the field with a long life cycle, and throughout their lifetime. They undergo several repairs and regular maintenances, requiring various spare parts in the process. The original system provider must maintain inventory of the required spare parts for repair and maintenance, in order to ensure the operability of field de- ployed systems throughout their entire system life cycle. With the rise of the product-service integrated system paradigm, the management of such spare parts inventory is becoming more important, as keeping the system available for oper- ation is becoming an important performance metric.
There are many works published in the field of spare parts inventory management, including distribution decision frame- work in a multi-echelon environment (Sherbrooke, 1986; Ha- usman and Erkip, 1994; Caggiano et al., 2009), lateral trans- shipment framework (Wong et al., 2005, Kranenburg and van Houtum, 2009; Paterson et al., 2011), integration of in- ventory decision and reliability improvement (Kim et al., 2010; Oner et al., 2010; Selcuk and Agrali, 2013), and field repair kit composition and optimization (Smith et al., 1980;
Graves, 1982; Hausman, 1982; Mamer and Smith, 1982;
Heeremans and Gelders, 1995; Teunter, 2006; Bijvank et al., 2010). The research presented in this paper deals with the re- plenishment policy aspect of field repair kit supply chains. In the literature, the field repair kit optimization problem has been viewed in two different aspects. The first view puts em- phasis on the cost model for the field repair kit problem, as proposed by Smith et al. (1980) and Mamer and Smith (1982).
Another aspect of the field repair kit is the service per- spective, where the expected level of service to the customer must be met (Graves, 1982).
The research presented in this paper contributes to the field of the repair kit problem in the following way. In this paper, the comprehensive supply chain, including the spare parts supplier, central warehouse, and field service engineers, are modeled using a combination of discrete-event simulation and an agent-based model. Agent-based models have been gaining popularity in the operation research community for modeling supply chain dynamics (Swaminathan et al., 1998), mass customization oriented supply chains (Labarthe et al.,
2007), negotiations within the supply chain (Wang et al., 2009), risk management (Giannakis and Louis, 2011). In this paper, an agent-based model was explicitly used to model the individual service engineer’s behavior in terms of spare parts demand profile, personal inventory status, and replenishment schedule. With precise modeling and simulation of field service engineers, overall system properties, such as total pe- riodic demand of a spare part and the revisit rate of service engineers due to the lack of required parts in their possession when responding to a service call. With the proposed simu- lation model, decision makers can make informed decisions based on accurate quantitative analysis results.
2. The Supply Chain Simulation Model
2.1 Simulation Model Overview
<Figure 1> shows the overall view for the proposed supply chain simulation model. The proposed simulation model rep- resents a multi-echelon supply chain, including the spare parts supplier, central warehouse, and field service engineers who service products at customer sites. The dynamic simulation model starts with the supply chain team issuing a purchase order (PO) to suppliers, each with its own lead time and or- der changing flexibility. Parts from suppliers are shipped to the central warehouse, either by regular or expedited ship- ment, based on the current on-hand inventory balance and parts backorder status. Arrived parts are stored in the central warehouse until they are requested by field service engineers who visit customer sites for product maintenance and repair.
The simulation model is divided into two sub-models. The first sub-model is the inbound supply chain model created using the discrete-event model, where the part shipment from the supplier to the central warehouse is modeled as a dis- crete-event. The second sub-model is the outbound supply chain model created using the agent based model, where in- dividual field service engineer is represented by an agent.
Two sub-models are integrated to form a combined discrete- event and agent based model for the field spare parts supply chain.
Supplier Central Warehouse
Service Engineers Customers Total Simulation Model Boundary
Inbound Model (Discrete Event)
Outbound Model (Agent Based)
Transit
Figure 1. Supply chain model framework
2.2 Inbound Supply Chain Model
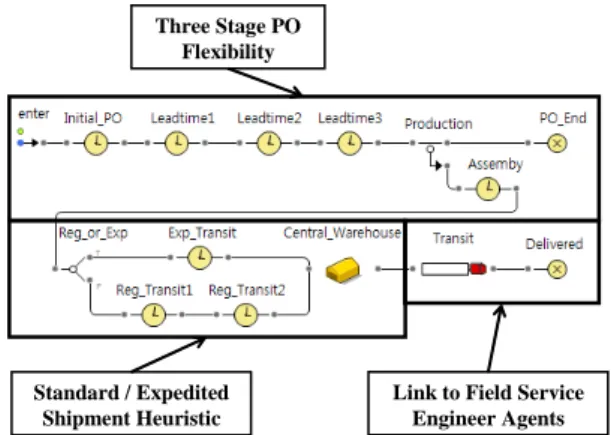
The inbound supply chain model represents the value chain from a supplier receiving a PO, making adjustments reque- sted to the PO within the contracted lead time, and shipping spare parts to the central warehouse. The inbound supply chain model is created as a discrete-event simulation model. <Figure 2> shows the discrete-event model for the inbound supply chain model. It is divided into three parts: order processing and production at the supplier’s site, normal or expedited shipment to the central warehouse, and shipment of spare parts to field service engineers.
Three Stage PO Flexibility
Standard / Expedited Shipment Heuristic
Link to Field Service Engineer Agents
Figure 2. Inbound supply chain model discrete- event model
The first part is the supplier order processing and produc- tion. One of the key issues for the company and the supplier is the agreed basic lead time for PO, and the parts quantity flexibility within the lead time. <Figure 3> shows a hypo- thetical supplier lead time and the PO flexibility. In the simu- lation model, the supplier lead time is defined as the time from when the PO is received by the supplier, to the time when the actual spare parts leaves the supplier’s warehouse.
In <Figure 3>, the supplier’s lead time is 80 days. From the time PO is issued to the 55 days before the shipment, the ori- ginal PO quantity can be adjusted by 50%. From 55 days to 30 days before the shipment, the PO quantity can be changed by 30%, and from 30 days to 5days, 10%. Finally, from 5days before the shipment, the PO cannot be changed at all due to parts being produced. This reflects reality, where flexibility of order quantity change decreases as the committed date of parts shipment nears, due to spare parts supplier’s commit- ment for acquiring resources (labor, assembly line time, ma- terials) for the PO. This is represented as staged events in the simulation model shown in <Figure 2>. Once the PO is issued, it will reach the first decision point labeled “Leadtime 1”, where the decision is made to increase or decrease the PO quantity. The PO will proceed to the next event (“Leadtime 2”), facing same decision, but with reduced flexibility. Once the PO reaches “Leadtime 3”, the PO is locked, and it pro- ceeds to “Production” where spare parts are assembled. In
<Figure 3>, there are three POs in the pipeline. Based on
overall part demand and central warehouse inventory sit- uation, quantities for these POs are adjusted within limits im- posed for each time period.
Production Adjustable
Adjustable -80 Days +50%
-50%
+10%
-10%
-30 Days -5 Days
No Flexibility Ship Adjustable
-55 Days +30%
-30%
Leadtime 1 Leadtime 2 Leadtime 3 Production
PO 3 PO 2 PO 1
PO Issued
Figure 3. A hypothetical supplier lead time and PO changing flexibility
Once parts are produced it is shipped to the central ware- house, another decision has to be made. Depends on the in- ventory situation at the central warehouse, such as the inven- tory level, inventory in transit, and near-term expected de- mand, parts can be shipped through either standard or expe- dited shipment route. If the warehouse inventory is at the ex- pected level and the near-term expected demand is within the predicted range, spare parts will be sent to the central ware- house via standard shipment mode. However, if the ware- house inventory and the spare parts shipment in the standard shipment pipeline is not enough to satisfy the near-term de- mand, then those parts must be shipped by expedited ship- ment. This heuristic is implemented in the simulation model, closely mimicking reality.
The last part of the discrete-event inbound model shown in
<Figure 2> is the shipment of spare parts to field service en- gineers, who are modeled as agents. Once the request from the field service engineer arrives, the part is assigned to that particular field service engineer and is shipped out. This me- chanism will be explained in more detail in the outbound supply chain model section.
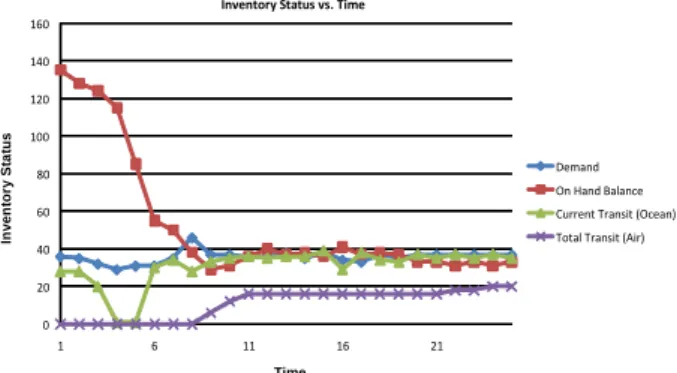
Using the simulation model, a periodic snapshot of critical metrics, such as end-of-period inventory, current inventory tied in the standard shipment route, total up-to-date expedited shipment inventory are created. <Figure 4> shows a snapshot plot for an actual spare part using the inbound supply chain model, capturing a period-by-period snapshot of the spare part inventory status. In the figure, the simulation starts with surplus central warehouse spare part inventory balance, which is current inventory, ready to be shipped to field service engi- neers. Consequently, no POs were issued for a number of pe- riods, decreasing inbound standard shipments to zero. When the excess inventory is depleted, new POs are issued. How- ever, due to a long lead time and a temporary spare part shortage as a result of the sharp cutback a few periods before, some shipments of the part had to be expedited through air shipment, instead of standard shipment via ship. This is an example of results which can be captured with the inbound supply chain simulation model. Using the actual spare parts data, like the one shown in <Figure 4>, the simulation results were compared with actual results, and it was found to match well.
0 20 40 60 80 100 120 140 160
1 6 11 16 21
Inventory Status
Time Inventory Status vs. Time
Demand On Hand Balance Current Transit (Ocean) Total Transit (Air)
Figure 4. Example of inbound supply shain simulation output
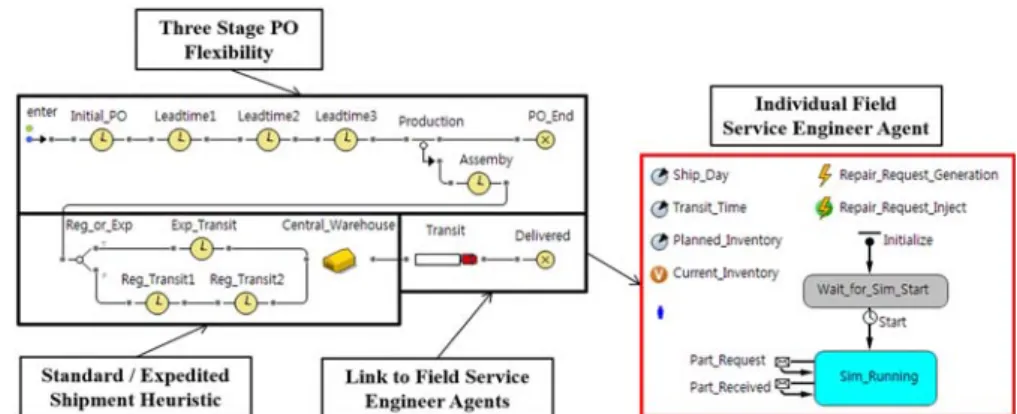
2.3 Outbound Supply Chain Model
The outbound supply chain model simulates the spare parts distribution network, from central warehouse inventory to field service engineers. Due to the limitation of discrete- event models in describing individual field service engineers’
behavior, an agent-based model is used to describe the distri- bution network. <Figure 5> shows the inbound supply chain model, combined with the outbound supply chain model with field service engineer agents in detail. In the model, the num- ber of field service engineer agent can vary from zero to sev- eral thousands, allowing great flexibility. All field service en- gineer agents have common parameters, but values are diffe- rent for each agent, reflecting different individual needs. When the simulation starts, each agent performs maintenance, uses his/her part and places a part order to the central warehouse.
The orders are fulfilled on first-in-first-out (FIFO) bases, un- less it is an emergency order, in which case it is placed in front of the regular order queue. Emergency order happens when an agent receives a service request, but does not have the part to use on the repair.
As stated earlier, each field service engineer agent has his/her unique part usage pattern and parts ship days. <Table 1> shows example of seven service engineers, each with its own unique agenda for using a specific spare part. Explana- tion of each column is presented below. Parameter value for each column is programmed into the agent-based model shown in <Figure 5>.
Ship Day : For each service engineer, the central warehouse has a specific day of the week on that it sends out the weekly spare parts replenishment. For example, in <Table 1>, the central warehouse will send spare parts replenishment to service engineer one every Monday, to service engineer three every Tuesday, and so on.
Transit Time : Transit time is the time required for weekly spare parts to reach the service engineer after they leave the central warehouse. For example, the service engineer four in
<Table 1> will receive (on average), his/her inventory re- plenishment in two-days after it leaves the central warehouse
Figure 5. Outbound supply chain model with field service engineer as an agent Table 1. An example of service engineer description
Spare Part Demand Profile Service
Engineer Ship Day Transit Time
Planned
Inventory Period 1 Period 2 Period 3 Period 4 Revisit Incident
1 Monday 1 1 0 2 1 0 0
2 Monday 3 2 2 3 1 1 2
3 Tuesday 5 0 1 0 0 0 1
4 Wednesday 2 5 4 3 2 7 1
5 Thursday 2 2 1 1 1 0 0
6 Friday 4 1 0 1 0 0 0
7 Friday 1 1 1 0 0 0 0
on Wednesday.
Planned Inventory : Each service engineer is assigned a spe- cific quantity of a particular spare part initially, depending on his/her historical part usage.
Spare Part Demand Profile : In <Table 1>, for each service engineer, a specific part demand for four consecutive periods is shown. For example, service engineer two had spare part usage of two during period one, three in period two, one in period three and one in period four. The simulation is set up so that for each period, a specified quantity of spare part de- mand will occur as the demand profile dictates, but their time of occurrence within the period is random. This is pro- grammed into each agent’s profile and is controlled by the event parameter named “Repair_Request_Generation” and
“Repair_Request_Inject.”
Revisit Incident : This is the number of occurrences when a field service engineer visits a customer site multiple times because he/she did not have the spare part. For example, ser- vice engineer four in <Table 1> had one such incident during the four periods shown. This is a critical performance metric that is used to assess the performance of alternative replen- ishment policies. This is the output metric for each agent,
which is summed up across all agents to provide the overall revisit rate for the particular part.
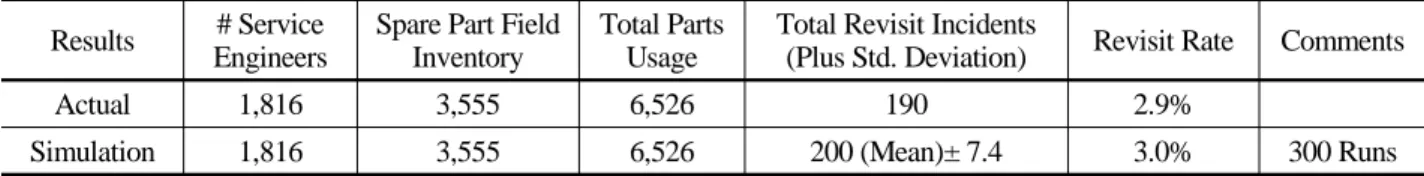
The outbound simulation model was put to the test using the actual historical data of a spare part, used by many field service engineers. <Table 2> shows the data for the spare part. Observing the historical data, there are 1,816 service en- gineers who carry this spare part in their vehicle to service their customers’ products. On average, each service engineer carries with him/her two of this spare part in the inventory.
There were 6,526 requests for this part from customers dur- ing five months period, averaging approximately 1,300 per month. Out of 6,526 requests for the part, 190 were fulfilled at the second or later visit, due to the lack of the spare part required, making the revisit rate at 2.9%.The historical data were then fed into the model, with detailed individual service engineer information, similar to the one shown in <Table 1>.
The simulation model can mimic the exact number of period- ical service requests shown in <Table 2> for the individual field service engineer. However, since the arrival time of these service requests are modelled as a uniform distribution within the specific period, Monte Carlo simulation was performed. <Table 3> shows the simulation results.
The Monte Carlo simulation result was close to the actual results, with very small standard deviation. Also, upon de-
Table 2. Spare part data used for simulation model test
Category Value Comments
Total Field Service Engineers 1,816 Number of service engineers who used this particular spare part during the period reviewed
Spare Part Field Inventory,
Held by Service Engineers 3,555 Quantity of the specific spare part which is held by field service engineers above.
Period 1 Usage (Actual) 1,418 Period 2 Usage (Actual) 1,349 Period 3 Usage (Actual) 1,168 Period 4 Usage (Actual) 1,282 Period 5 Usage (Actual) 1,309
Total Parts Usage (Actual) 6,526 Total service calls during five periods reviewed that required the usage of the spare part
Total Revisit Incidents (Actual) 190
Total number of times, out of total service calls during the periods reviewed, the service engineer had to revisit the customer site due to lack of part in his/her inventory
Revisit Rate 2.9% Total Revisit Incidents/Total Usage
Table 3. Monte carlo simulation results for the spare part shown in <Table 2>
Results # Service Engineers
Spare Part Field Inventory
Total Parts Usage
Total Revisit Incidents
(Plus Std. Deviation) Revisit Rate Comments
Actual 1,816 3,555 6,526 190 2.9%
Simulation 1,816 3,555 6,526 200 (Mean)± 7.4 3.0% 300 Runs
tailed inspection of results for individual service engineers, the simulation results mimicked real results very closely for most cases, thus validating the accuracy of the simulation model. The inbound supply chain model and the outbound supply chain model presented are combined to create the end-to-end spare parts supply chain model, covering the sup- plier, central warehouse, and field service engineers. The combined model was used in the case study to assess several alternative field service engineer replenishment policies for a major printing equipment manufacturing company, presented in the next section.
3. Case Study
3.1 Background
In the printing equipment industry, a typical business mod- el is to sell the printing equipment and the maintenance agree- ment to printing shops, offices and schools. During the peri- od specified by the maintenance agreement, field service en- gineers from the printing equipment firm will make regular visits to customer sites, performing scheduled preventive maintenances. Additionally, when the printing equipment bre- aks down unexpectedly, the required repair is performed by
field service engineers, cost of the repair covered by the maintenance agreement. Currently, the printing system man- ufacturer has several thousand field service engineers who service customer’s printing equipment throughout the coun- try, carrying spare parts for printing equipment they service as part of the repair kit, based on historical usage.
When a field service engineer responds to a service call and visits the customer site, the printer is diagnosed, and if it has a broken parts or end-of-life regular maintenance parts, they are replaced by the service engineer. The service engi- neer then records usage, and requests used spare part replen- ishment from the central warehouse. The central warehouse, upon receiving the request, allocates a part fromin-house in- ventory, and ships the part out to the service engineer on the designated day of the week. If the specific spare part is not available, the service engineer’s order is placed on a queue of orders to be fulfilled when the spare part comes in. This pro- cess applies to the situation where the service engineer has inventory of the spare part to be used while waiting for the replenishment, or no service call occurs during the replenish- ment period in case the service engineer does not have the spare part in stock.
However, when a field service engineer responds to a serv- ice call and lacks the part needed to repair the printer, an emergency part request is generated and sent to the central warehouse. The central warehouse, upon receiving the emer-
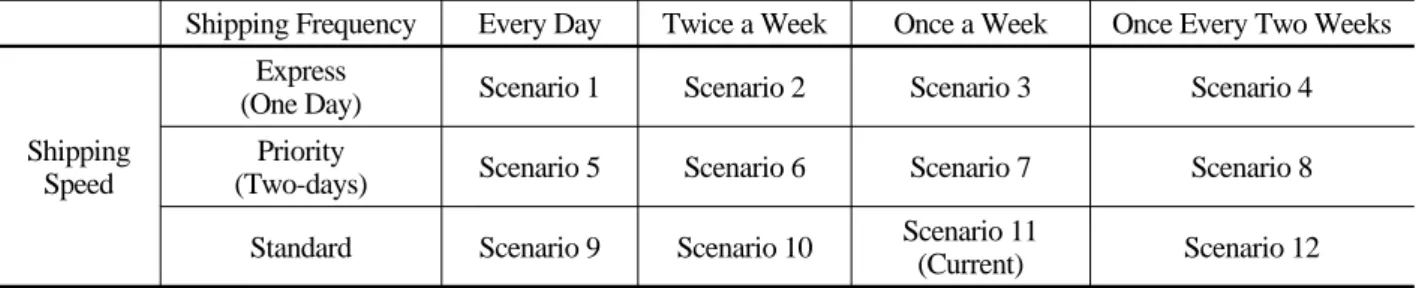
Table 4. Proposed field service engineer replenishment policy scenarios
Shipping Frequency Every Day Twice a Week Once a Week Once Every Two Weeks
Shipping Speed
Express
(One Day) Scenario 1 Scenario 2 Scenario 3 Scenario 4
Priority
(Two-days) Scenario 5 Scenario 6 Scenario 7 Scenario 8
Standard Scenario 9 Scenario 10 Scenario 11
(Current) Scenario 12 gency part request, puts the order in front of the regular part
request queue, assigns the part to the order immediately (if in stock), and ships the order out via express one-day shipment that very same day. The service engineer revisits the custom- er site, repairs the product with the part received. This revisit incident is recorded, and is used as a performance metric for the spare part supply chain. Decision makers are interested in exploring different service engineer replenishment policies that will reduce the revisit incidents, reduce inventory held by service engineers, or both. Using the simulation model presented in Section 2, several alternative policies are quanti- tatively assessed and compared to the current replenishment policy.
3.2 Case Study Approach and Proposed Policies
For the case study, following approach was taken. First, different policy scenarios for service engineer replenishment were created. Second, the key measurement metric was de- fined. The metric is the revisit rate, which is the percentage of the time the service engineer has to revisit the same site for product repair, due to the lack of the part required. Next, a set of spare parts with varying degree of inventory flow speed (slow-moving vs. fast-moving) and field inventory lev- el is selected. Selected parts are typically held by service en- gineers, and historical supply-demand data were available.
This ensures analyzed results are applicable to a wide range of spare parts. One important criterion for selecting a part is that the part must not have had any backorders for the period that the data was obtained. This was done to separate the pure revisit rate caused by the part replenishment policy from the revisit rate caused by a part stockout. For each part se- lected, Monte Carlo simulation for all alternative policy sce- narios were conducted.
<Table 4> shows the proposed alternate replenishment pol- icy scenarios for field service engineers. The current replen- ishment policy scenario in effect is marked as “Current” in the table. The central warehouse aggregates spare parts re- quests from service engineers during the week. Then, on a specific day of the week, requested spare parts are sent to service engineers who are designated to have parts shipped out that day of the week. Shipments are sent out using stand- ard shipment, and they take one day to several days to be de-
livered, depending on the distance of the service engineer’s location with respect to the central warehouse. The only ex- ception is the emergency order responding to the service en- gineer who did not have the necessary part for the customer site visit, and has to revisit with the part at another time.
These emergency orders are shipped via one-day express shipment, leaving the central warehouse the same day the or- der is received without regard to service engineer’s ship dates, if requested parts are in stock. These emergency orders take precedence over regular scheduled shipment.
Proposed replenishment policies are created through the variation of two key controllable factors. The first factor is the shipping frequency. Currently, the central warehouse ships spare parts replenishments once a week to field service engi- neers. Three alternative options are created : daily shipment, twice a week (Monday and Thursday) shipment, and bi-weekly shipment. The second factor is the speed of the shipment.
Currently, the standard parcel service is used for spare parts shipment to field service engineers. For this study, two other shipment methods are proposed: one day express shipment, and two day priority shipment. Exception to this is the emer- gency order, which is generated when the field service en- gineer visits the customer site to service the product, but does not have the part to fix it. It will always be shipped as soon as the request is received via one-day express shipment, re- gardless of the policy in effect.
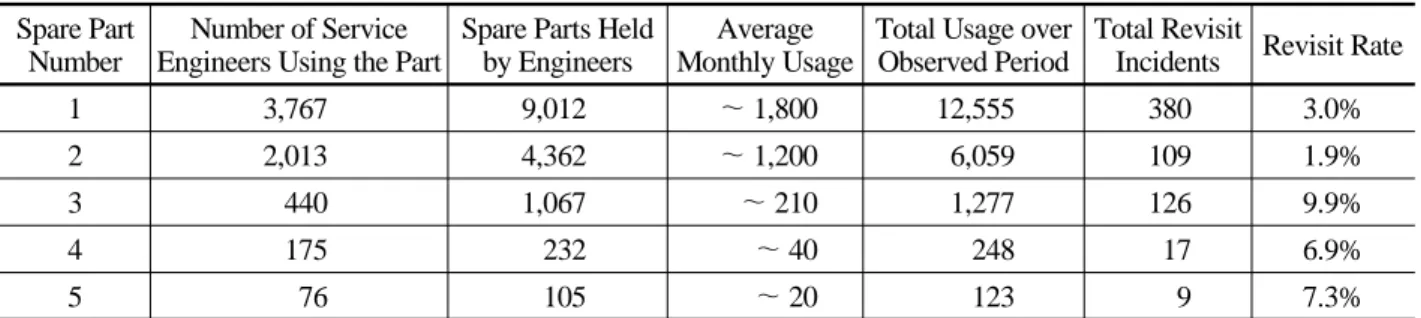
For high-volume, fast moving spare parts, the hypothesis is that they will benefit from express shipment and more fre- quent replenishment to field service engineers. For low-vol- ume, slower moving spare parts, since the demand for these parts is spread over a longer time interval, the hypothesis is that it would be more cost-effective to replenish these parts less frequently without impacting the revisit rate. The pro- posed cases in <Table 4> cover the breadth of options that are considered viable. To make the simulation analysis re- sults generalizable from the wide range of spare parts in in- ventory, a set of spare parts is selected with following con- ditions.
• Number of Field Service Engineers : Some spare parts are used by several thousand service engineers in mass quan- tities due to printers requiring spare parts being deployed in the field en-masse, while some parts are used only by a handful of service engineers due to printers being sold in
Table 5. Data for spare parts selected for analysis (partial list) Spare Part
Number
Number of Service Engineers Using the Part
Spare Parts Held by Engineers
Average Monthly Usage
Total Usage over Observed Period
Total Revisit
Incidents Revisit Rate
1 3,767 9,012 ~ 1,800 12,555 380 3.0%
2 2,013 4,362 ~ 1,200 6,059 109 1.9%
3 440 1,067 ~ 210 1,277 126 9.9%
4 175 232 ~ 40 248 17 6.9%
5 76 105 ~ 20 123 9 7.3%
Note) One Period = Month.
very few quantities. For a set of spare parts selected, the number of service engineers carrying a specific spare part ranged from less than 10 to more than 3,600.
• Spare Parts Field Inventory : Another important factor to consider is the spare parts inventory, held by field service engineers for printer repair at customer sites. Some serv- ice engineers carry more than one, due to frequent usage, while other service engineers carry only one or may not carry them at all, since they don’t service printers that re- quire that particular spare part or the spare part is seldom used. The inventory distribution is modeled at the in- dividual service engineer level in the agent-based model.
• Periodic Usage : Spare parts ranging high periodic demand to low period demand are selected. For the simulation, five or six months’ worth of historical data is used.
• Backorder History : As mentioned earlier, parts selected for analysis must not have had any backorder for the his- torical period analyzed. The reason for this is to make sure the revisit incident occurred for this part is purely due to the replenishment gap, not due to the shortage of the spare parts in general, thus not contaminating the re- visit incidents results.
More than 30spare parts were selected to represent the general spare parts inventory. <Table 5> shows data for some parts from the set selected that satisfies above criteria.
With the set of parts selected, several alternative spare parts replenishment policies are analyzed to answer several im- portant questions.
3.3 Policy Simulation Results and Analysis Question 1 : How do different replenishment policy scenarios
impact the overall revisit rate?
Twelve scenarios shown in <Table 4> are analyzed for the set of parts selected. For each case the following conditions are applied. First, for the simulation time period, historical
five or six months are simulated, under the assumption that future is similar to history. Second, for each periodic demand (a month), specific historical demand is enforced, with de- mand arriving time within each period modelled as uniform distribution. Last, for each case, to ensure convergence of re- sults, 50 random runs per scenario are performed.
Results of two parts analyzed are shown in <Table 6> and
<Table 7>. Thet-test was performed, comparing all scenario results, and the analysis confirmed the significance of each scenario result with respect to other scenario results. The analysis showed that faster and more frequent replenishment policies reduce revisit rate for both high-usage and low-usage parts as expected. The simulation enabled extraction of quan- titative results for each policy scenario proposed, allowing comparisons between different scenarios. Shipping speed had a similar effect on high-usage and low-usage parts, as the re- visit rate changed in a relative linear pattern for different ship- ment speed. However, high-usage parts and low-usage parts showed different behavior toward the shipping frequency.
Marginal results show that the high-usage part was quite sen- sitive to the shipping frequency, while the low-usage part was less sensitive to it. The reason is that since low-usage parts are used less with longer interval between each use, the revisit rate performance did not change much, whereas the high-usage part is used more frequently, being effected more from the long wait time between shipments. Observing re- sults in <Table 6> and <Table 7>, a second question was asked and analyzed with the use of simulation model.
Question 2 : If the revisit rate under the current replenish- ment policy is acceptable, then by how much can the field inventory be reduced by imple- menting the fastest replenishment policy, while maintaining the current revisit rate?
The underlying assumption in this question is that if cur- rent revisit rates for spare parts are acceptable to the manage- ment, there is an opportunity to reduce spare parts field in- ventory from the service engineer’s possession through im- plementation of a faster and more frequent replenishment policy, without impacting the revisit rate. As an example, for the part shown in <Table 6>, if the shipment frequency is set
Table 6. Simulation results for high-usage part revisit rate (periodic demand > 1,200)
Shipping Frequency Every Day Twice a Week Once a Week Once Every Two Weeks
Shipping Speed
Express
(One Day) 0.7% 0.9% 1.3% 2.7%
Priority
(Two-days) 0.8% 1.1% 1.6% 3.1%
Standard 1.0% 1.3% 1.9%
(Current) 3.4%
Table 7. Simulation results for low-usage part revisit rate (periodic demand = 79)
Average Values Shipping Frequency Every Day Twice a Week Once a Week Once Every Two Weeks
Shipping Speed
Express
(One Day) 18.9% 19.6% 20.7% 22.8%
Priority
(Two-days) 19.7% 20.5% 21.5% 23.4%
Standard 20.5% 21.1% 22.1%
(Current) 24.0%
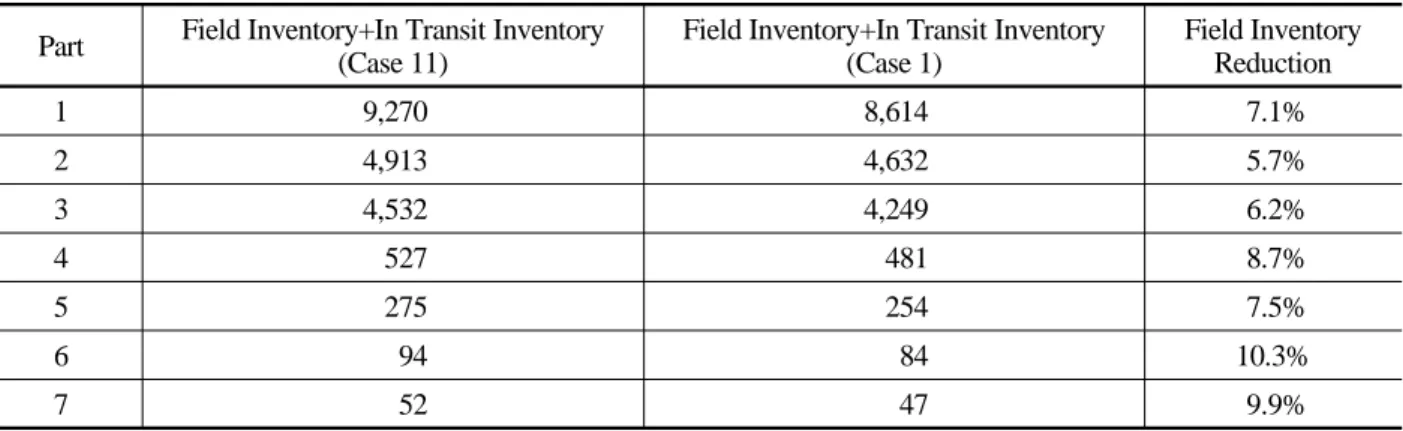
Table 8. Inventory reduction results for case 1 Part Field Inventory+In Transit Inventory
(Case 11)
Field Inventory+In Transit Inventory (Case 1)
Field Inventory Reduction
1 9,270 8,614 7.1%
2 4,913 4,632 5.7%
3 4,532 4,249 6.2%
4 527 481 8.7%
5 275 254 7.5%
6 94 84 10.3%
7 52 47 9.9%
to every day with express shipment, the revisit rate improves from 1.9% to 0.7%. However, if current 1.9% revisit rate is acceptable to the management, then there is opportunity for reducing the field inventory by changing shipment frequency and shipment speed, and taking the part out of the field serv- ice engineer’s inventory. For the analysis, following steps were taken. First, for the evaluated replenishment policy, Scenario 1 (every day shipment, one-day express shipment) was implemented to maximize the inventory reduction effect.
Second, for the inventory reduction method, the inventory of each service engineer was inspected one by one, and excess inventory was taken out for the spare parts selected. Next, for the entire span of the simulated time, historical five or six months of demands are simulated. Monte Carlo simulation was performed until the results converged. <Table 8> shows field inventory reduction results for some of the parts analyzed. Analysis of spare parts in the selected set showed range of a 5%~10% reduction in inventory, before the re- visit rate in Scenario 1 increased to the level of revisit rate
shown in Scenario 11 which is the current case. Reduction of such inventory can free up the cash tied up in the inventory.
However, this must be evaluated in conjunction of cost to implement the replenishment policy Scenario 1shown in
<Table 4>, and the benefit of reducing the revisit rate in lieu of field inventory reduction.
Question 3 : Can simulation be used to test the robustness of the spare parts distribution network?
Using the model, it was possible to test the limit of the supply chain capability and measure its robustness when the supply chain is disrupted because of natural disasters, suppli- er problem, or transportation trouble, creating backorders.
Since field service engineers already have spare parts in their inventory, they can service customers for some time, before the backorder situation impacts the revisit rate in a signifi- cant manner. The question is just how much can the current supply chain hold out in case of severe backorders, before the
revisit rate starts to escalate? To answer the question posed, a simulation was run with following condition. First, the simu- lation was run with incremental 10% parts supply reduction, starting from 10% to 30%. Second, the same historical de- mand as it was used for simulation to answer the previous questions, were used. Last, the simulation was performed us- ing the current replenishment policy (Scenario 11), with cur- rent field service engineer inventory.
Results are shown in <Figure 6>. Parts shown in the figure corresponds to parts listed in <Table 5>. Observing the plot, all parts when subject to supply disruption were able to with- stand up to 10% backorder. Once the backorder exceeds 10%, revisit rates start to escalate. This creates an oppor- tunity for carrying certain amount of backorders permanently (around 10%), creating inventory reduction. One caveat for implementing this backorder carrying policy is that when a part’s periodic demand is highly volatile, carrying certain amount of backorder close to the inflection point in the graph might cause rapid escalation of there visit rate. Exercising this policy requires extra caution.
0% 10% 20% 30%
Part 1 3.3% 3.4% 4.5% 6.8%
Part 2 1.9% 1.9% 2.5% 3.9%
Part 3 9.3% 9.4% 10.2% 12.0%
Part 4 6.8% 6.9% 7.2% 8.3%
Part 5 7.9% 8.0% 8.5% 9.8%
0.0%
2.0%
4.0%
6.0%
8.0%
10.0%
12.0%
14.0%
Revisit Rate
Revisit Rate vs. % Backorder
Figure 6. Supply chain robustness simulation results
With the simulation model constructed, several useful re- sults were obtained. With such results, policy recommenda- tions based on quantitative assessments were possible. For this case study, following recommendations were made to the management. First, implementing faster and more frequent shipment policy results in an improved field service engineer revisit rate. However, the total cost of the new policy must be considered for the full assessment of the benefit realized. Se- cond, if the revisit rate under the current replenishment poli- cy is acceptable, a reduction of field inventory can be real- ized when faster replenishment policy is instituted. The anal- ysis revealed that with the fastest policy (Scenario 1), an ave- rage inventory reduction of 5%~10% was possible. Lastly, the current spare parts supply chain can withstand up to 10%
of backorder before the revisit rate is impacted significantly.
This provides an opportunity to reduce inventory through permanently carrying certain level of backorder, but it must be implemented with caution, as parts with high demand vol- atility may be vulnerable to small disruption.
3.4 Case Study Summary
In this case study, several spare parts replenishment policy scenarios for printing equipment manufacturer’s field service engineers were assessed for service improvement and in- ventory reduction. Several alternative replenishment policies are proposed and evaluated using the simulation model in- troduced in Section 2. Analysis results revealed that by im- plementing faster and more frequent policies, reduction in re- visit rate or field inventory can be accomplished. Analysis al- so revealed that the current spare parts supply chain can with stand certain degree of supply disruption before the revisit rate is impacted. Recommendations were made based on analysis results.
4. Conclusion
In this paper, a new multi-echelon supply chain model for spare parts distribution was introduced. The model consists of an inbound supply chain model, constructed using discrete- event model, and the outbound supply chain model which consists of agent-based model, capable of describing the cha- racteristics of individual field service engineers. The simula- tion framework enables decision makers to quantitatively ad- dress various questions on distribution supply chain. In the case study, alternative replenishment policies for field serv- ice engineers are evaluated through the use of the simulation framework. After calibrating the simulation model, several analyses were performed to answer questions posed by deci- sion makers. Results showed that a faster and more frequent replenishment policy can reduce the service engineer’s re- visit rate to customers’ sites, but also provides an opportunity to reduce field inventory in lieu of the improved revisit rate.
Finally, the supply chain disruption test simulated with the current parts supply chain network revealed that the dis- tribution supply chain, as it is currently configured, can with- stand a certain degree of disruption in supplies before the re- visit rate is impacted. It is demonstrated that the agent-based modeling of the distribution supply chain network can por- tray reality with a good accuracy through detailed modeling of individual entities and their behavior. Through aggregat- ing results from individual entities, system level metrics can be obtained and used to assess the feasibility of several alter- native supply replenishment policies. Overall, the proposed simulation framework showed good potential for future sup- ply chain policy assessments.
References
Bijvank, M., Koole, G., and Vis, I. F. A. (2010), Optimising a general re- pair kit problem with a service constraint, European Journal of Operational Research, 204(1), 76-85.
Caggiano, K. E., Jackson, P. L., Muckstadt, J. A., and Rappold, J. A.
(2009), Efficient computation of time-based customer service levels in a multi-item, multi-echelon supply chain : A practical approach for inventory optimization, European Journal of Operational Research, 199(3), 744-749.
Giannakis, M. and Louis, M. (2011), A multi-agent based framework for supply chain risk management, Journal of Purchasing and Supply Management, 17(1), 23-31.
Graves, S. C. (1982), A Multiple-Item Inventory Model with a Job Completion Criterion, Management Science, 28(11), 1334-1337.
Hausman, W. H. (1982), On Optimal Repair Kits under a Job Completion Criterion, Management Science, 28(11), 1350-1351.
Hausman, W. H. and Erkip, N. K. (1994), Multiechelon Vs Single-Echelon Inventory Control Policies for Low-Demand Items, Management Science, 40(5), 597-602.
Heeremans, D. and Gelders, L. F. (1995), Multiple Period Repair Kit Problem with a Job Completion Criterion-a Case-Study, European Journal of Operational Research, 81(2), 239-248.
Kim, S., Cohen, M., and Netessine, S. (2010), Reliability or inventory?
Analysis of product support contracts in the defense industry, Working paper, Yale School of Management, Yale University.
Kranenburg, A. A. and van Houtum, G. J. (2009), A new partial pooling structure for spare parts networks, European Journal of Operational Research, 199(3), 908-921.
Labarthe, O., Espinasse, B., Ferrarini, A. and Montreuil, B. (2007), Toward a methodological framework for agent-based modelling and simulation of supply chains in a mass customization context, Simulat-
ion Modelling Practice and Theory, 15(2), 113-136.
Mamer, J. W. and Smith, S. A. (1982), Optimizing Field Repair Kits Based on Job Completion Rate, Management Science, 28(11), 1328-1333.
Oner, K. B., Kiesmuller, G. P., and van Houtum, G. J. (2010), Optimiza- tion of component reliability in the design phase of capital goods, European Journal of Operational Research, 205(3), 615-624.
Paterson, C., Kiesmuller, G., Teunter, R. and Glazebrook, K. (2011), Inventory models with lateral transshipments : A review, European Journal of Operational Research, 210(2), 125-136.
Selcuk, B. and Agrali, S. (2013), Joint spare parts inventory and reliability decisions under a service constraint, Journal of the Operational Re- search Society, 64(3), 446-458.
Sherbrooke, C. C. (1986), Vari-Metric-Improved Approximations for Multi-Indenture, Multiechelon Availability Models, Operations Research, 34(2), 311-319.
Smith, S. A., Chambers, J. C., and Shlifer, E. (1980), Optimal Inventories Based on Job Completion Rate for Repairs Requiring Multiple Items, Management Science, 26(8), 849-852.
Swaminathan, J. M., Smith, S. F., and Sadeh, N. M. (1998), Modeling supply chain dynamics : A multiagent approach, Decision Sciences, 29(3), 607-632.
Teunter, R. H. (2006), The multiple-job repair kit problem, European Journal of Operational Research, 175(2), 1103-1116.
Wang, M. H., Wang, H. Q., Vogel, D., Kumar, K., and Chiu, D. K. W.
(2009), Agent-based negotiation and decision making for dynamic supply chain formation, Engineering Applications of Artificial Intelli- gence, 22(7), 1046-1055.
Wong, H., van Houtum, G. J., Cattrysse, D., and Van Oudheusden, D.
(2005), Simple, efficient heuristics for multi-item multi-location spare parts systems with lateral transshipments and waiting time con- straints, Journal of the Operational Research Society, 56(12), 1419- 1430.